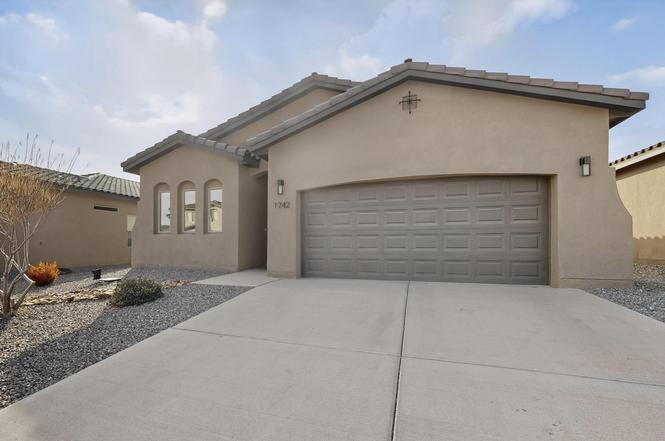
1742 Tesoro Loop NW · Los Lunas, NM
Flood risk No data
- FEMA flood zone
- —
- Chance of flooding over 30 yrs
- —
- Est. flood insurance / yr
- —
Fire risk No data
- Est. fire insurance / yr
- —
Heat risk No data
- Hot days now (above threshold)
- —
- Hot days in 30 yrs
- —
Wind risk No data
- Chance of severe wind over 30 yrs
- —
Air-quality risk No data
- Unhealthy air days now
- —
- Unhealthy air days in 30 yrs
- —
Risk factors via First Street. Map © Google.
Why this score? — see what drove the D grade
The composite is a weighted blend of 9 inputs, each scored 0–100. Each bar is that input's sub-score; the figure is the points it added to the 100-point composite (weight × sub-score).
- Cash flow +12.5/30.0
- ARV discount +7.5/15.0
- Rent growth +5.0/5.0
- 1% rule +3.7/10.0
- DSCR +3.7/10.0
- Livability +3.3/5.0
- Schools +2.6/10.0
- Condition / age +2.5/5.0
- Appreciation +0.0/10.0
$335,000
🖨 Deal sheet (PDF) 📄 Offer letter ✓ Due diligence
Listing remarks
* * * * * * * * SELLER IS OFFERING A $5000.00 CREDIT AT CLOSING TO BE USED TOWARDS CLOSING COST OR LAWNCARE * * * * * Located in the heart of Los Lunas, NM, this beautifully designed home offers the perfect balance of elegance and everyday comfort. A bright, open-concept layout welcomes you with tray ceilings, recessed lighting, ceiling fans and the comfort of refrigerated air throughout. The kitchen is both stylish and functional, featuring a spacious island with bar seating with stainless steel appliances. The primary suite is a private retreat, complete with a generous walk-in closet and a spa-like bath showcasing dual sinks, a relaxing soaking tub, and a separate shower. Step
Key facts
- Spacious island
- Walk-in closet
- Soaking tub
Tags
Property features AI
Finance
- HOA & community: Homeowners association with $30 monthly fee covering common areas
Exterior
- Parking: Attached garage; 2-car garage
- Utilities: Electricity connected; Natural gas connected; Public water; Public sewer
- Home design: Single-story home; Faces east; Resale property
- Construction: Frame construction; Pitched tile roof; Built by Abrazo
- Exterior features: Private yard; Covered patio; Wall fencing; Landscaped yard; Xeriscape; Planned unit development
Interior
- Kitchen: Dishwasher; Free-standing gas range
- Bedrooms: Bedroom 1 on main level; Bedroom 2 on main level; Bedroom 3 on main level
- Flooring: Carpet; Tile
- Bathrooms: 2 full bathrooms; Bathtub
- Heating & cooling: Natural gas heating; Refrigerated cooling
- Interior features: Breakfast bar; Ceiling fan(s); Dual sinks; Garden tub / Roman tub; Soaking tub; Separate shower; Walk-in closet(s); Main-level primary bedroom; Double-pane insulated windows
- Laundry & utility: Washer hookup; Electric dryer hookup; Gas dryer hookup
Neighborhood map
What this means for you Summary
Snapshot
- This is a 3-bed/2.0-bath other listed at $335k.
Deal economics
- At list price, monthly cash flow is $-46 ($-557/yr) — negative.
- To cash-flow at today's rent, offer at most $327k (2.4% below list).
- To meet the 1% rule (rent ≥ 1% of price), the offer needs to be $292k (12.8% below list).
- Recommended offer: $292k (12.8% below list) — sets the bar for 1% rule.
- Cap rate 6.1% vs local median 3.8% in Los Lunas — top-decile yield for the area; either an underpriced asset or a hidden risk that comps aren't pricing in. Stress-test before assuming the spread holds.
Location & tenants
- Location reads 66/100 on livability (#46 in NM) — a middle-class / working-renter tenant base. Strengths: cost of living A+, housing A+; Watch: schools F, crime F, amenities F.
- Los Lunas Public Schools (suburban): math 20% / reading 34% proficiency, ranked #34 of 95 in NM (top 36%) — low school quality limits family demand, transient renter base, plan for 1-2y turnover; 63% free/reduced lunch — lower-income household profile, screen leases tightly.
- Market conditions: Rents rising fast (+33.2%/yr); 567 active listings in the ZIP; 2 comparable units currently listed for rent nearby; 303 units permitted in Valencia County in 2024 (0 in 5+ unit buildings).
- At $2,922/mo this rent would consume 58% of the median local household income ($61k/yr) (locally 602% of renters already pay >50% of income on rent) — very limited rent-growth headroom before tenants either downsize or default.
Forward outlook
- Local home prices are declining (-3.0%/yr); year-one equity from $2k of loan paydown is wiped out by about $10k of value loss. Plan a longer hold.
- Valencia County population projected at -14% by 2050 — secular population decline; favor cash flow + early exit over multi-decade hold.
Negotiation context
- It's been on market 74 days — a 6% lower offer ($315k) is reasonable based on typical stale-listing flexibility.
Questions for the listing agent
- What do current leases actually rent for vs. the listed asking? Can we see a recent rent roll and the last 12 months of T-12 income?
- It's been on market 74 days. Have you received any prior offers? Is the seller open to a 13% concession, seller financing, or rate buy-down credit?
- What does the HOA fee cover, when was the last increase, and are there any pending special assessments or reserve-fund shortfalls?
- Why hasn't it sold? Are there any deal-killer items the seller is aware of (foundation, flood, title, zoning, code violations)?
- Is there a deadline driving the sale (1031 exchange, divorce, estate, relocation)? That informs how much negotiation room exists.
- Schools are F-rated, which usually means shorter tenancies and higher turnover. Who's the typical renter profile here, and what's been the actual vacancy rate?
- Crime grade is F in this area — have there been break-ins, vandalism, or insurance claims at this property in the last 3 years? What carrier currently insures it and at what premium?
- The area grade is low — what's the realistic commute time and amenity access for the typical tenant pool here? Any planned neighborhood developments (good or bad) we should know about?
- What's the average days-on-market for RENTAL listings here right now (not sales)? A rising rental-DOM trend means longer vacancies and softer asking-rent achievability than the comps imply.
- What's the recent tenant-quality profile in this submarket — average credit score on applications, eviction rate, late-payment / NSF rate, and stable-employment percentage? A property-management company in the area should have these aggregated.
- How much new for-sale + rental construction is in the pipeline within 1–3 miles? Heavy new supply typically softens prices + rents 12–24 months out; constrained supply supports both.
Investment metrics
- 1% rule
- 0.87% ✗
- Cap rate
- 6.13%
- Cash-on-cash
- -0.59%
- DSCR
- 0.97
- GRM
- 9.6
CMA / ARV
No comps found within radius.
Projected returns pro-forma
-3.0% appreciation · 8.0% rent growth · sell at horizon
- IRR
- -11.7%
- Equity multiple
- 0.56×
- Total profit
- $-41,731
- Equity at exit
- $49,950
- IRR
- 3.6%
- Equity multiple
- 1.32×
- Total profit
- $30,408
- Equity at exit
- $28,965
Cash invested: $93,800 (down + closing). Projections, not guarantees.
Landlord ↔ Tenant lean methodology
- Overall (STATE)
- 55 Moderately Landlord-Leaning
- State New Mexico
- 55 Moderately Landlord-Leaning · D+3
- County
- — inherits STATE
- City
- — inherits STATE
ZIP-level market 87031
- Home prices YoY
- -29.8%
- Rents YoY
- 33.2%
- Active inventory
- 567
- Price-to-rent
- 9.6×
Monthly cashflow live
- Estimated rent
- $2,922 medium interval (Pro) →
- Mortgage (P&I)
- −$1,757
- Tax from tax record
- −$428 /mo · $5,138/yr
- Insurance
- −$140
- HOA
- −$30
- Vacancy / Maint / Mgmt
- −$614
- Net cashflow
- $-46
Break-even live
Sensitivity live
| Price | -10% $143 | -5% $48 | +0% $-46 | +5% $-141 | +10% $-236 |
|---|---|---|---|---|---|
| Rent | -10% $-277 | -5% $-162 | +0% $-46 | +5% $69 | +10% $184 |
| Rate | -1.0pp $122 | -0.5pp $39 | base $-46 | +0.5pp $-133 | +1.0pp $-222 |
UW: 25.0% down · 7.5% · 30yr · 1.5% tax · 5.0% vac · 8.0% maint · 8.0% mgmt
Financing live
Cash to close
- Down payment
- $83,750
- Closing costs
- $10,050
- Reserves months
- —
- Total cash needed
- —
Loan-product check · same deal, 3 products live
Conventional
25% down · 7.5% · 30yr
- Down + closing
- —
- Monthly P&I
- —
- Monthly cashflow
- —
- DSCR
- —
- Eligible?
- —
Personal DTI + credit; lowest rate.
DSCR
20% down · 8.5% · 30yr
- Down + closing
- —
- Monthly P&I
- —
- Monthly cashflow
- —
- DSCR
- —
- Eligible?
- —
No personal income docs; deal must DSCR.
Hard money
10% down · 12.0% · 12mo
- Down + closing
- —
- Monthly P&I
- —
- Monthly cashflow
- —
- DSCR
- —
- Eligible?
- —
Short-term bridge; refi at stabilization.
Rent comps 2 comps
| Address | Beds | Baths | Sqft | Rent | $/sqft | DOM | Units | Dist |
|---|---|---|---|---|---|---|---|---|
| 1400 Tierra Verde Loop NW Los Lunas, NM | 3.0 | 3.0 | 1917 | $3,600 | $1.88 | 25d | 1 | 0.07mi |
| 1748 Valle Vista Rd NW Los Lunas, NM | 4.0 | 2.0 | 1690 | $2,125 | $1.26 | 17d | 1 | 0.35mi |
HOA detail
- Monthly dues
- $30 · $360/yr
Listing history 7 events
-
2026-04-29status Pending
-
2026-04-24price $335,000
-
2026-02-07$340,000 Active
-
2025-01-27price $351,995
-
2024-12-19price $359,995
-
2024-12-19price $354,995
-
2024-10-01price $369,995
ⓘ Source: listings_history table (triggers on properties + properties_extension) + one-shot
backfill from property_details.listing_events for pre-trigger history.
Tax reassessment forecast NM · Resets to sale price
- Current annual tax
- $5,138 · $428/mo
- Projected year-2 tax
- $5,138 · $428/mo
- Expected delta
- $0/yr ($0/mo · 0.0%)
ⓘ Screening estimate from a state-policy table — verify with the county assessor before closing.
Nearby sold comps map
Loading sold comps map…
Walkable amenities ~0.75 mi
Loading nearby amenities…
Taxation est. · year 1
- Rental income
- $35,060
- − Mortgage interest
- −$18,765
- − Property taxes
- −$5,138
- − Insurance
- −$1,675
- − Repairs & maintenance
- −$2,805
- − Management
- −$2,805
- − HOA
- −$360
- − Depreciation
- −$9,745
- Taxable loss
- −$6,233
- Est. tax savings @ 24.0%
- +$1,496
- After-tax cash flow
- $939/yr
For passive investors: Depreciation is non-cash, so a rental often shows a tax loss while cash-flowing — sheltering income. Rental losses are passive: they offset passive income freely, and up to $25,000/yr can offset ordinary (W-2) income if you actively participate and your MAGI is under $100k (phasing out to $0 by $150k); unused losses carry forward. On sale, claimed depreciation is recaptured at up to 25%, and gains may owe capital-gains tax (a 1031 exchange can defer both). Figures are a year-1 estimate at your 24.0% rate — not tax advice; consult a CPA.
Schools (NCES district)
- District
- Los Lunas Public Schools
- NCES district ID
- 3501680
- Math proficiency
- 20% —
- Reading proficiency
- 34% —
- Median HH income
- $44,438
- Composite
- 26.11/100
- National rank
- #12724
- State rank
- #34 of 95 in NM
Livability — Los Lunas
- Score
- 66/100
- State rank
- #46
- US rank
- #12347
Category grades
Schools grade is shown separately in the Schools card above.
Census & demographics
- Census place
- Los Lunas, NM
- County
- Valencia County · 68,779 people
- City population
- 47,514
- Metro
- Albuquerque, NM
- Population (ZIP)
- 47,514
- Household income
- $60,902
- Rent vs Own
- Severe rent burden
- 602.0
Population outlook (Valencia County) Hauer SSP2
- Today (2025)
- 73,788 people
- By 2030
- 72,101 · -2.3%
- By 2040
- 67,930 · -7.9%
- By 2050
- 63,191 · -14.4%
- By 2075
- 53,644 · -27.3%
- By 2100
- 40,882 · -44.6%
Race, ethnicity, and origin ACS 2023
- Neighborhood character
- Majority Hispanic (63%)
- Race & ethnicity
- Hispanic / Latino 63% White 30% Two or more races 29% Native American 4% Black 1%
- Hispanic origin (detail)
- Mexican 38%
- Common ancestry
- Serbian 1% Russian 1% Slovak 1%
- Foreign-born
- 8% · Canada
- Languages at home
- 71% English-only · Spanish 27%
Political lean MEDSL · Valencia
- 2024 margin
- R (+16.4) · D 40.9% · R 57.3% · Other 1.8%
- 2008→2024 swing
- -24.1pp toward R · 2008: 7.7pp · 2024: -16.4pp
- All cycles
- 2024: R+16.4 2020: R+9.6 2016: R+8.7 2012: D+2.5 2008: D+7.7
Not yet ingested
- Civics
- —
Market trends
- HPI YoY
- ▼ -85.17%
- Current HPI
- 201.0508
- Rent YoY
- ▲ 33.16%
- Metro
- Albuquerque, NM
- State GDP YoY
- —
- F500 in state
- 0
Price history
-9.5% since first listed7 events — show timeline
- 2026-04-29 Pending — Southwest MLS
- 2026-04-24 Price Changed $335,000 Southwest MLS
- 2026-02-07 Listed $340,000 Southwest MLS
- 2025-01-27 Price Changed $351,995 Southwest MLS
- 2024-12-19 Price Changed $359,995 Southwest MLS
- 2024-12-19 Price Changed $354,995 Southwest MLS
- 2024-10-01 Price Changed $369,995 Southwest MLS
Cash-flow waterfall
monthlySold comps — $/sqft
last 12 mo · ≤1 miLoading sold comps…