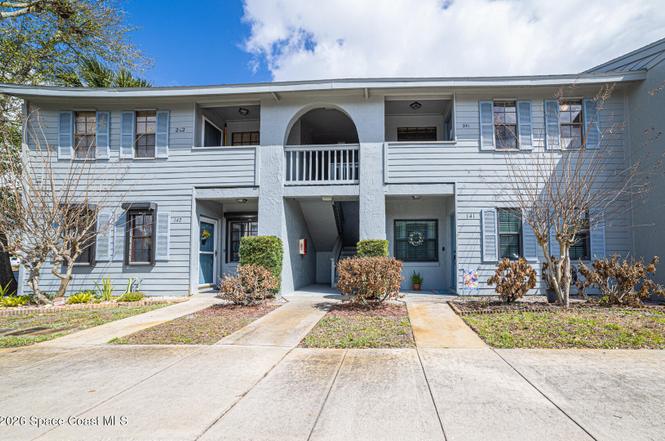
1695 Harrison St #241 · Titusville, FL
Flood risk 6/10 · Moderate
- FEMA flood zone
- X (unshaded)
- Chance of flooding over 30 yrs
- 0.73%
- Est. flood insurance / yr
- $507 – $1,088
Fire risk 4/10 · Minor
- Est. fire insurance / yr
- $947 – $1,759
Heat risk 10/10 · Severe
- Hot days now (above 108°F)
- 7 days/yr
- Hot days in 30 yrs
- 22 days/yr
Wind risk 10/10 · Severe
- Chance of severe wind over 30 yrs
- 99.0%
Air-quality risk 1/10 · Minimal
- Unhealthy air days now
- 0 days/yr
- Unhealthy air days in 30 yrs
- 0 days/yr
Risk factors via First Street. Map © Google.
Why this score? — see what drove the B- grade
The composite is a weighted blend of 9 inputs, each scored 0–100. Each bar is that input's sub-score; the figure is the points it added to the 100-point composite (weight × sub-score).
- Cash flow +26.8/30.0
- 1% rule +10.0/10.0
- DSCR +9.2/10.0
- ARV discount +7.5/15.0
- Schools +4.7/10.0
- Livability +4.2/5.0
- Rent growth +2.8/5.0
- Condition / age +2.5/5.0
- Appreciation +0.0/10.0
$99,000
🖨 Deal sheet 📄 Offer letter ✓ Due diligence
Listing remarks
Centrally located 2 bedroom, 2 full bathroom condo in Titusville offering comfortable living and convenient access to everything the Space Coast has to offer. This unit features a functional layout, spacious living area, and a private screened patio perfect for relaxing. The community offers easy access to major roadways including US Highway 1 and Interstate 95, making commuting simple. Just minutes from the Indian River Lagoon, Kennedy Space Center, and the Kennedy Space Center Visitor Complex, with nearby shopping, dining, and parks. A short drive to Cocoa Beach and Playalinda Beach for some of Florida's best beaches and rocket launch viewing. Nearby shopping, pool and clubhouse. Ideal as
Key facts
- $335 HOA
- Community pool
- Built 1985
Tags
Property features AI
Finance
- Other: Pets allowed with breed restrictions
- HOA & community: Association: Village Square Condo Association; Association fee $335 monthly
Exterior
- Parking: Assigned parking
- Utilities: Public sewer; Electricity connected; Water connected; Sewer connected
- Home design: Condominium; 2 stories; Entry level 2
- Construction: Wood siding construction
- Exterior features: Lot features: Other; Faces west
Interior
- Kitchen: Dishwasher; Electric range
- Bedrooms: 2 bedrooms
- Bathrooms: 2 full bathrooms
- Heating & cooling: Electric heating; Central air conditioning
- Interior features: Unfurnished unit; Central air
- Laundry & utility: Washer; Dryer
Neighborhood map
What this means for you Summary
Snapshot
- This is a 2-bed/2.0-bath condo listed at $99k.
Deal economics
- At list price, monthly cash flow is $271 ($3k/yr) — positive.
- The deal already cash-flows at list — no discount required.
- Meets the 1% rule at list price ($2k rent vs $99k).
- Recommended offer: $96k (3.0% below list) — sets the bar for market timing.
Location & tenants
- Location reads 84/100 on livability (#42 in FL, #668 nationally) — a professional / high-income tenant draw. Strengths: commute A+, cost of living A+, housing A+; Watch: crime D, employment D.
- Brevard (suburban): math 53% / reading 57% proficiency, ranked #19 of 73 in FL (top 26%) — acceptable for families but not a draw, mixed tenant base, ~2y average lease.
- Zoned schools: Apollo Elementary School (math 47% / reading 51%, grade D, #1,134 of 2,144 statewide, top 54%, 730 students, 68% FRL); Andrew Jackson Middle School (math 52% / reading 47%, grade C, #259 of 571 statewide, top 46%, 551 students, 58% FRL); Titusville High School (math 33% / reading 52%, grade F, #264 of 667 statewide, top 41%, 1,314 students, 55% FRL) — zoned schools average 60% FRL vs 43% district-wide (18 pts higher); higher-poverty schools than district average — tighter screening recommended.
- Market conditions: Rents rising (+1.3%/yr); 462 active listings in the ZIP; 40 comparable units currently listed for rent nearby; rentals at typical pace (median 24d on market — plan ~3-4 weeks tenant-placement turnaround); 4,602 units permitted in Brevard County in 2024 (702 in 5+ unit buildings).
Forward outlook
- Local home prices are declining (-3.0%/yr); year-one equity from $684 of loan paydown is wiped out by about $3k of value loss. Plan a longer hold.
- Brevard County population projected at +15% by 2050 — modest demand growth; plan on rents tracking national, not racing it.
Negotiation context
- It's been on market 48 days — a 3% lower offer ($96k) is reasonable based on typical stale-listing flexibility.
- 2 sale attempts; this cycle's ask has dropped $41k (29%) from the opening price — seller is motivated, your offer sets the floor, not the list.
- Current owner paid $42k; list at $99k implies a 133% gain — meaningful room to come down on a strong offer.
Risks & watch-outs
- Watch-outs: HOA is 22% of rent.
- Climate carrying-cost: major flood risk; severe wind risk, 99% chance of damaging wind over 30y; extreme-heat days projected 7→22/yr by 2055 (HVAC capex compounding) — expect insurance premiums to compound above CPI over the hold.
Questions for the listing agent
- It's been on market 48 days. Have you received any prior offers? Is the seller open to a 3% concession, seller financing, or rate buy-down credit?
- What does the HOA fee cover, when was the last increase, and are there any pending special assessments or reserve-fund shortfalls?
- Any open or pending special assessments — roof, HVAC, plumbing, elevator, façade? What's the per-unit balance and payoff schedule, and is the seller paying it off at close or rolling it to the buyer?
- Is there a deadline driving the sale (1031 exchange, divorce, estate, relocation)? That informs how much negotiation room exists.
- Crime grade is D in this area — have there been break-ins, vandalism, or insurance claims at this property in the last 3 years? What carrier currently insures it and at what premium?
- What's the average days-on-market for RENTAL listings here right now (not sales)? A rising rental-DOM trend means longer vacancies and softer asking-rent achievability than the comps imply.
- What's the recent tenant-quality profile in this submarket — average credit score on applications, eviction rate, late-payment / NSF rate, and stable-employment percentage? A property-management company in the area should have these aggregated.
- How much new apartment / multifamily construction is in the pipeline within 1–3 miles? Heavy new supply (>2% of stock underway) typically softens rents 12–24 months out; light construction supports rent growth.
Investment metrics
- 1% rule
- 1.54% ✓
- Cap rate
- 9.57%
- Cash-on-cash
- 11.71%
- DSCR
- 1.52
- GRM
- 5.4
CMA / ARV
No comps found within radius.
Projected returns pro-forma
-3.0% appreciation · 1.29% rent growth · sell at horizon
- IRR
- -1.2%
- Equity multiple
- 0.96×
- Total profit
- $-1,219
- Equity at exit
- $14,761
- IRR
- 6.2%
- Equity multiple
- 1.42×
- Total profit
- $11,606
- Equity at exit
- $8,560
Cash invested: $27,720 (down + closing). Projections, not guarantees.
Landlord ↔ Tenant lean methodology
- Overall (STATE)
- 87 Strongly Landlord-Friendly
- State Florida
- 87 Strongly Landlord-Friendly · R+3
- County
- — inherits STATE
- City
- — inherits STATE
ZIP-level market 32780
- Rents YoY
- 1.3%
- Active inventory
- 462
- Price-to-rent
- 5.4×
Monthly cashflow live
- Estimated rent
- $1,526 high interval (Pro) →
- Mortgage (P&I)
- −$519
- Tax from tax record
- −$40 /mo · $478/yr
- Insurance
- −$41
- HOA
- −$335
- Vacancy / Maint / Mgmt
- −$321
- Net cashflow
- $271
Break-even live
UW: 25.0% down · 7.5% · 30yr · 1.5% tax · 5.0% vac · 8.0% maint · 8.0% mgmt
Financing live
Cash to close
- Down payment
- $24,750
- Closing costs
- $2,970
- Reserves months
- —
- Total cash needed
- —
Loan-product check · same deal, 3 products live
Conventional
25% down · 7.5% · 30yr
- Down + closing
- —
- Monthly P&I
- —
- Monthly cashflow
- —
- DSCR
- —
- Eligible?
- —
Personal DTI + credit; lowest rate.
DSCR
20% down · 8.5% · 30yr
- Down + closing
- —
- Monthly P&I
- —
- Monthly cashflow
- —
- DSCR
- —
- Eligible?
- —
No personal income docs; deal must DSCR.
Hard money
10% down · 12.0% · 12mo
- Down + closing
- —
- Monthly P&I
- —
- Monthly cashflow
- —
- DSCR
- —
- Eligible?
- —
Short-term bridge; refi at stabilization.
Rent comps 40 comps
| Address | Beds | Baths | Sqft | Rent | $/sqft | DOM | Units | Dist |
|---|---|---|---|---|---|---|---|---|
| 1735 Harrison St #231 Titusville, FL | 2.0 | 2.0 | 915 | $1,700 | $1.86 | 19d | 1 | 0.04mi |
| 3072 Finsterwald Dr Titusville, FL | 1.0 | 1.0 | 750 | $1,775 | $2.37 | 23d | 1 | 0.28mi |
| 1237 Country Club Dr Titusville, FL | 2.0 | 2.0 | 970 | $1,600 | $1.65 | 23d | 1 | 0.55mi |
| 1209 Country Club Dr Titusville, FL | 2.0 | 2.0 | 935 | $1,700 | $1.82 | 23d | 1 | 0.55mi |
| 1099 Country Club Dr #811 Titusville, FL | 2.0 | 2.0 | 940 | $1,800 | $1.91 | 23d | 1 | 0.63mi |
| 1041 Country Club Dr #426 Titusville, FL | 2.0 | 2.0 | 1020 | $1,800 | $1.76 | 23d | 1 | 0.68mi |
| 1041 Country Club Dr Titusville, FL | 2.0 | 2.0 | 1020 | $1,900 | $1.86 | 23d | 1 | 0.68mi |
| 1039 Country Club Dr Titusville, FL | 2.0 | 2.0 | 1020 | $1,800 | $1.76 | 23d | 1 | 0.68mi |
| 2999 Sir Hamilton Cir #9 Titusville, FL | 2.0 | 1.0 | 960 | $1,250 | $1.30 | 23d | 1 | 0.82mi |
| 2511 Country Club Dr Unit B118 Titusville, FL | 2.0 | 1.5 | 1075 | $1,200 | $1.12 | 23d | 1 | 0.82mi |
| 3645 Barna Ave Titusville, FL | 1.0–2.0 | 1.0 | 895 | $1,350 | $1.51 | 23d | 4 | 0.86mi |
| 1590 S Deleon Ave Titusville, FL | 3.0 | 1.0 | 1072 | $1,600 | $1.49 | 23d | 1 | 0.86mi |
| 3119 Sir Hamilton Cir Titusville, FL | 2.0 | 1.0 | 960 | $1,250 | $1.30 | 14d | 1 | 0.87mi |
| 3142 Sir Hamilton Cir Titusville, FL | 1.0 | 1.0 | 736 | $1,250 | $1.70 | 23d | 1 | 0.88mi |
| 3039 Sir Hamilton Cir #8 Titusville, FL | 2.0 | 2.0 | 960 | $1,500 | $1.56 | 23d | 1 | 0.89mi |
| 3021 Sir Hamilton Cir Titusville, FL | 2.0 | 2.0 | 1040 | $1,275 | $1.23 | 23d | 1 | 0.89mi |
| 3035 Sir Hamilton Cir Titusville, FL | 2.0 | 2.0 | 960 | $1,400 | $1.46 | 14d | 1 | 0.89mi |
| 3147 Sir Hamilton Cir #10 Titusville, FL | 2.0 | 1.0 | 960 | $1,400 | $1.46 | 23d | 1 | 0.90mi |
| 2170 Knox Mc Rae Dr #39 Titusville, FL | 1.0 | 1.0 | 550 | $1,000 | $1.82 | 14d | 1 | 0.94mi |
| 2170 Knox Mc Rae Dr #38 Titusville, FL | 1.0 | 1.0 | 550 | $1,050 | $1.91 | 23d | 1 | 0.94mi |
| 2170 Knox Mc Rae Dr #5 Titusville, FL | 2.0 | 2.0 | 831 | $1,100 | $1.32 | 21d | 1 | 0.94mi |
| 2192 Knox McRae Dr Unit 1 Titusville, FL | 2.0 | 1.0 | 817 | $1,100 | $1.35 | 23d | 1 | 0.95mi |
| 2190 Knox McRae Dr Unit D Titusville, FL | 2.0 | 1.0 | 820 | $1,100 | $1.34 | 19d | 1 | 0.95mi |
| 2190 Knox McRae Dr Unit F Titusville, FL | 2.0 | 1.0 | 820 | $1,050 | $1.28 | 23d | 1 | 0.95mi |
| 2205 Knox McRae Dr Unit 14 Titusville, FL | 2.0 | 2.0 | 840 | $1,125 | $1.34 | 23d | 1 | 1.01mi |
| 933 Gibson St Titusville, FL | 3.0 | 1.0 | 816 | $1,275 | $1.56 | 14d | 1 | 1.02mi |
| 3550 Sable Palm Ln Unit L Titusville, FL | 1.0 | 1.0 | 695 | $1,150 | $1.65 | 23d | 1 | 1.15mi |
| 1710 S Washington Ave #16 Titusville, FL | 2.0 | 1.0 | 710 | $1,100 | $1.55 | 23d | 1 | 1.16mi |
| 1710 S Washington Ave Unit 1 Titusville, FL | 2.0 | 1.0 | 710 | $1,250 | $1.76 | 23d | 1 | 1.16mi |
| 1516 Roger Dr Unit 2 Titusville, FL | 1.0 | 1.0 | 550 | $1,600 | $2.91 | 23d | 1 | 1.17mi |
| 3570 Sable Palm Ln Titusville, FL | 1.0–2.0 | 1.0–2.0 | 779 | $1,350 | $1.73 | 21d | 3 | 1.18mi |
| 3555 Sable Palm Ln Unit 7K Titusville, FL | 2.0 | 2.0 | 864 | $1,300 | $1.50 | 23d | 1 | 1.20mi |
| 3555 Sable Palm Ln Unit F Titusville, FL | 2.0 | 2.0 | 864 | $1,350 | $1.56 | 23d | 1 | 1.20mi |
| 3590 Sable Palm Ln Unit G Titusville, FL | 1.0 | 1.0 | 695 | $1,125 | $1.62 | 23d | 1 | 1.23mi |
| 2825 S Washington Ave Titusville, FL | 2.0 | 1.0 | 613 | $2,050 | $3.34 | 14d | 31 | 1.25mi |
| 2825 S Washington Ave Titusville, FL | 2.0 | 1.0 | 613 | $2,050 | $3.34 | 14d | 31 | 1.25mi |
| 1540 Riverside Dr #402 Titusville, FL | 2.0 | 2.0 | 1120 | $1,800 | $1.61 | 23d | 1 | 1.26mi |
| 102 Court St Titusville, FL | 1.0–2.0 | 1.0 | 721 | $1,550 | $2.15 | 23d | 6 | 1.27mi |
| 2465 S Washington Ave #108 Titusville, FL | 2.0 | 2.0 | 830 | $1,800 | $2.17 | 23d | 1 | 1.27mi |
| 2465 S Washington Ave Unit A202 Titusville, FL | 2.0 | 2.0 | 830 | $1,900 | $2.29 | 14d | 1 | 1.27mi |
HOA detail condo
- Monthly dues
- $335 · $4,020/yr
- Likely covers
- pool
- Assessments
- None detected in remarks — confirm with the listing agent.
Listing history 22 events
-
2026-06-18days on market $99,000 Active 48 DOM
-
2026-06-17days on market $99,000 Active 47 DOM
-
2026-06-16days on market $99,000 Active 46 DOM
-
2026-06-15days on market $99,000 Active 45 DOM
-
2026-06-14days on market $99,000 Active 43 DOM
-
2026-06-10days on market $99,000 Active 40 DOM
-
2026-06-08days on market $99,000 Active 38 DOM
-
2026-06-07days on market $99,000 Active 37 DOM
-
2026-06-05days on market $99,000 Active 34 DOM
-
2026-06-03days on market $99,000 Active 33 DOM
-
2026-06-02days on market $99,000 Active 32 DOM
-
2026-06-01days on market $99,000 Active 31 DOM
-
2026-05-31days on market $99,000 Active 30 DOM
-
2026-05-31days on market $99,000 Active 29 DOM
-
2026-05-29price $99,000
-
2026-05-29status Active
-
2026-04-02historical
-
2026-03-05$140,000 Active
-
2000-08-29soldstatus $42,500
-
1997-06-18soldstatus $30,000
-
1996-06-25soldstatus $17,700
-
1990-07-01soldstatus $640,000
ⓘ Source: listings_history table (triggers on properties + properties_extension) + one-shot
backfill from property_details.listing_events for pre-trigger history.
Tax reassessment forecast FL · Resets to sale price
- Current annual tax
- $478 · $40/mo
- Projected year-2 tax
- $822 · $68/mo
- Expected delta
- +$344/yr (+$29/mo · 72.0%)
ⓘ Screening estimate from a state-policy table — verify with the county assessor before closing.
Climate risk First Street
- Flood 6/10 Major FEMA zone X (unshaded) · 73% chance over 30 yrs
- Wildfire 4/10 Moderate
- Heat 10/10 Extreme 7 d/yr ≥108°F today · 22 d/yr by 30 yrs out
- Wind 10/10 Extreme 99% chance of damaging wind over 30 yrs
- Air quality 1/10 Low 0 unhealthy d/yr today · 0 by 30 yrs out
Nearby sold comps map
Loading sold comps map…
Walkable amenities ~0.75 mi
Loading nearby amenities…
Taxation est. · year 1
- Rental income
- $18,315
- − Mortgage interest
- −$5,546
- − Property taxes
- −$478
- − Insurance
- −$495
- − Repairs & maintenance
- −$1,465
- − Management
- −$1,465
- − HOA
- −$4,020
- − Depreciation
- −$2,880
- Taxable income
- $1,966
- Est. tax owed @ 24.0%
- −$472
- After-tax cash flow
- $2,774/yr
For passive investors: Depreciation is non-cash, so a rental often shows a tax loss while cash-flowing — sheltering income. Rental losses are passive: they offset passive income freely, and up to $25,000/yr can offset ordinary (W-2) income if you actively participate and your MAGI is under $100k (phasing out to $0 by $150k); unused losses carry forward. On sale, claimed depreciation is recaptured at up to 25%, and gains may owe capital-gains tax (a 1031 exchange can defer both). Figures are a year-1 estimate at your 24.0% rate — not tax advice; consult a CPA.
Schools (NCES district)
- District
- Brevard
- NCES district ID
- 1200150
- Math proficiency
- 53% ▼ -9.00%
- Reading proficiency
- 57% ▼ -4.00%
- Median HH income
- $49,426
- Composite
- 46.86/100
- National rank
- #2370
- State rank
- #19 of 73 in FL
Livability — Titusville
- Score
- 84/100
- State rank
- #42
- US rank
- #668
Category grades
Schools grade is shown separately in the Schools card above.
Census & demographics
- Census place
- Titusville, FL
- County
- Brevard County · 602,871 people
- City population
- 60,286
- Metro
- Palm Bay-Melbourne-Titusville, FL
- Population (ZIP)
- 40,064
- Household income
- $67,690
- Rent vs Own
- Severe rent burden
- 1141.0
Population outlook (Brevard County) Hauer SSP2
- Today (2025)
- 623,254 people
- By 2030
- 648,420 · +4.0%
- By 2040
- 690,009 · +10.7%
- By 2050
- 715,669 · +14.8%
- By 2075
- 775,744 · +24.5%
- By 2100
- 776,687 · +24.6%
Race, ethnicity, and origin ACS 2023
- Neighborhood character
- Predominantly White (70%)
- Race & ethnicity
- White 70% Black 13% Hispanic / Latino 8% Two or more races 8% Asian 3%
- Hispanic origin (detail)
- Mexican 1% Puerto Rican 4% Cuban 1%
- Common ancestry
- Romanian 2% Slovak 2% Lithuanian 2%
- Foreign-born
- 8% · Canada, China
- Languages at home
- 89% English-only · Spanish 6% Other Indo-European 1% German/W. Germanic 1%
Political lean MEDSL · Brevard
- 2024 margin
- Strong R (+20.8) · D 39.1% · R 59.9% · Other 1.0%
- 2008→2024 swing
- -10.4pp toward R · 2008: -10.4pp · 2024: -20.8pp
- All cycles
- 2024: R+20.8 2020: R+16.4 2016: R+19.8 2012: R+12.7 2008: R+10.4
Not yet ingested
- Civics
- —
Market trends
- HPI YoY
- ▼ -162.54%
- Current HPI
- 297.151
- Rent YoY
- ▲ 1.29%
- Metro
- Palm Bay-Melbourne-Titusville, FL
- State GDP YoY
- ▲ 3.28%
- F500 in state
- 36
Industry mix (Fortune 500 HQ in FL)
| Industry | F500 HQs | Revenue |
|---|---|---|
| Industrial Technology | 2 | $29B |
|
||
| Insurance | 2 | $17B |
|
||
| Retail | 1 | $60B |
|
||
| Technology Distribution | 1 | $58B |
|
||
| Homebuilding | 1 | $35B |
|
||
| Technology Manufacturing | 1 | $35B |
|
||
Price history
-84.5% since first listed8 events — show timeline
- 2026-05-29 Price Changed $99,000 SCMLS
- 2026-05-29 Relisted — SCMLS
- 2026-04-02 Listing Removed — SCMLS
- 2026-03-05 Listed $140,000 SCMLS
- 2000-08-29 Sold (Public Records) $42,500 Public Records
- 1997-06-18 Sold (Public Records) $30,000 Public Records
- 1996-06-25 Sold (Public Records) $17,700 Public Records
- 1990-07-01 Sold (Public Records) $640,000 Public Records
Property tax history
-4.1%/yrLatest (2025): $478 · +5.0% YoY. Source: county tax records.
Cash-flow waterfall
monthlySold comps — $/sqft
last 12 mo · ≤1 miLoading sold comps…