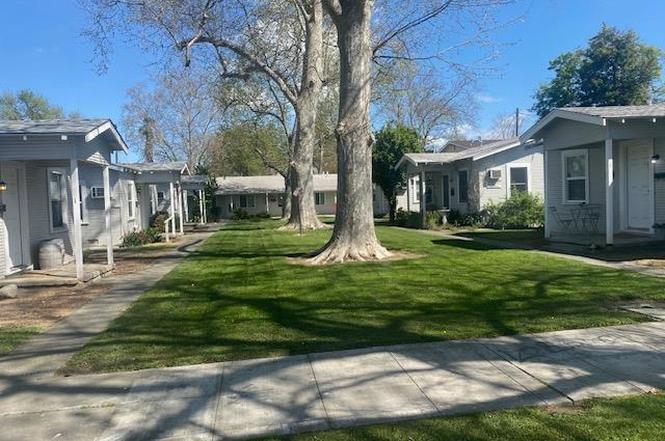
 10-Plex
125 College St · Woodland, CA
Flood risk 9/10 · Severe
- FEMA flood zone
- X (unshaded)
- Chance of flooding over 30 yrs
- 0.99%
- Est. flood insurance / yr
- $507 – $1,088
Fire risk 1/10 · Minimal
- Est. fire insurance / yr
- $659 – $1,223
Heat risk 7/10 · Major
- Hot days now (above 104°F)
- 7 days/yr
- Hot days in 30 yrs
- 14 days/yr
Wind risk 1/10 · Minimal
- Chance of severe wind over 30 yrs
- —
Air-quality risk 10/10 · Severe
- Unhealthy air days now
- 26 days/yr
- Unhealthy air days in 30 yrs
- 28 days/yr
Risk factors via First Street. Map © Google.
Why this score? — see what drove the B grade
The composite is a weighted blend of 9 inputs, each scored 0–100. Each bar is that input's sub-score; the figure is the points it added to the 100-point composite (weight × sub-score).
- Cash flow +30.0/30.0
- 1% rule +10.0/10.0
- DSCR +10.0/10.0
- ARV discount +7.5/15.0
- Schools +4.0/10.0
- Rent growth +3.6/5.0
- Livability +3.4/5.0
- Condition / age +2.5/5.0
- Appreciation +0.0/10.0
$1,499,000
🖨 Deal sheet 📄 Offer letter ✓ Due diligence
Multi-family units
County records classify this as Multi-Family (5+ Unit). Listing-text estimate: 10 units. confirmed
5+ unit building — per-unit beds/baths from public records are typically unavailable; the breakdown below (if shown) is an estimate from the listing text.
Listing remarks
10 UNIT INCOME PROPERTY. Approximate gross rental income for the year is $170,412. Insurance is $21,000. This unique and well maintained property features a total of 10 units, which include, 6 charming single level 1 bedroom 1 bath individual cottages and four single level 1 bedroom 1 bath apartments. Six units have been remodeled with new kitchen cabinets, countertops, appliances, laminate flooring throughout, double paned windows and updated bathrooms with new showers, vanities, and commodes. Each cottage includes its own indoor laundry room. New dual paned windows have been installed in the remodeled units, with select upgrades in the remaining apartments. A laundry room is available for
Key facts
- 0.46 acre lot
- 2 parking spots
- Built 1930
Neighborhood map
What this means for you Summary
Snapshot
- This is a 10 × 10-bed/?-bath units multifamily listed at $1.50M.
Deal economics
- At list price, monthly cash flow is $10k ($116k/yr) — positive. Per door: $968/mo.
- The deal already cash-flows at list — no discount required.
- Meets the 1% rule at list price ($25k rent vs $1.50M).
- Recommended offer: $1.32M (12.0% below list) — sets the bar for market timing.
- Cap rate 14.1% vs local median 3.4% in Woodland — top-decile yield for the area; either an underpriced asset or a hidden risk that comps aren't pricing in. Stress-test before assuming the spread holds.
Location & tenants
- Location reads 67/100 on livability (#314 in CA) — a middle-class / working-renter tenant base. Strengths: employment A, housing A; Watch: amenities C-, schools F, cost of living F.
- Woodland Joint Unified (suburban): math 34% / reading 58% proficiency, ranked #171 of 517 in CA (top 33%) — families likely to look elsewhere, expect single-tenant / working-renter base with shorter leases.
- Market conditions: Rents rising fast (+4.5%/yr); 106 active listings in the ZIP; solid renter incomes; 721 units permitted in Yolo County in 2024 (260 in 5+ unit buildings).
- At $24,729/mo this rent would consume 373% of the median local household income ($79k/yr) (locally 1397% of renters already pay >50% of income on rent) — very limited rent-growth headroom before tenants either downsize or default.
Forward outlook
- Local home prices are declining (-3.0%/yr); year-one equity from $10k of loan paydown is wiped out by about $45k of value loss. Plan a longer hold.
- Yolo County population projected at +31% by 2050 — long-run rental-demand tailwind backs the buy-and-hold thesis.
- At projected returns (-3.0% appreciation + 4.5% rent growth), your $420k cash investment doubles in ~5 years — after that, you're playing with house money.
Negotiation context
- It's been on market 236 days — a 12% lower offer ($1.32M) is reasonable based on typical stale-listing flexibility.
- Current owner paid $850k; list at $1.50M implies a 76% gain — meaningful room to come down on a strong offer.
Risks & watch-outs
- Watch-outs: flood insurance adds $66/mo; built in 1930 — expect roof / HVAC / electrical / plumbing capex.
- Climate carrying-cost: severe flood risk; extreme-heat days projected 7→14/yr by 2055 (HVAC capex compounding) — expect insurance premiums to compound above CPI over the hold.
Questions for the listing agent
- It's been on market 236 days. Have you received any prior offers? Is the seller open to a 12% concession, seller financing, or rate buy-down credit?
- Can we see the unit-by-unit rent roll, current vacancy, and any below-market leases? What's the average tenancy length?
- What capital expenditures (roof, boiler, parking lot, exteriors) have been made in the last 5 years, and what's planned in the next 2?
- Built in 1930 — when were the roof, HVAC, electrical panel, plumbing, and water heater last replaced?
- What's the actual annual flood-insurance premium (NFIP or private), and is the property in a SFHA with mandatory coverage?
- Why hasn't it sold? Are there any deal-killer items the seller is aware of (foundation, flood, title, zoning, code violations)?
- Is there a deadline driving the sale (1031 exchange, divorce, estate, relocation)? That informs how much negotiation room exists.
- Schools are F-rated, which usually means shorter tenancies and higher turnover. Who's the typical renter profile here, and what's been the actual vacancy rate?
- What's the average days-on-market for RENTAL listings here right now (not sales)? A rising rental-DOM trend means longer vacancies and softer asking-rent achievability than the comps imply.
- What's the recent tenant-quality profile in this submarket — average credit score on applications, eviction rate, late-payment / NSF rate, and stable-employment percentage? A property-management company in the area should have these aggregated.
- How much new apartment / multifamily construction is in the pipeline within 1–3 miles? Heavy new supply (>2% of stock underway) typically softens rents 12–24 months out; light construction supports rent growth.
Investment metrics
- 1% rule
- 1.65% ✓
- Cap rate
- 14.09%
- Cash-on-cash
- 27.86%
- DSCR
- 2.24
- GRM
- 5.1
CMA / ARV
No comps found within radius.
Projected returns pro-forma
-3.0% appreciation · 4.5% rent growth · sell at horizon
- IRR
- 23.4%
- Equity multiple
- 1.98×
- Total profit
- $411,479
- Equity at exit
- $223,506
- IRR
- 32.2%
- Equity multiple
- 4.13×
- Total profit
- $1,312,599
- Equity at exit
- $129,606
Cash invested: $419,720 (down + closing). Projections, not guarantees.
Landlord ↔ Tenant lean methodology
- Overall (STATE)
- 18 Strongly Tenant-Friendly
- State California
- 18 Strongly Tenant-Friendly · D+13
- County
- — inherits STATE
- City
- — inherits STATE
ZIP-level market 95695
- Rents YoY
- 4.5%
- Active inventory
- 106
- Price-to-rent
- 50.5×
Monthly cashflow live
- Estimated rent
- $24,729 medium interval (Pro) →
- Mortgage (P&I)
- −$7,861
- Tax from tax record
- −$1,305 /mo · $15,664/yr
- Insurance
- −$625
- Flood insurance flood zone
- −$66 /mo · $798/yr
- HOA
- −$0
- Vacancy / Maint / Mgmt
- −$5,193
- Net cashflow
- $9,679
Break-even live
10-unit breakdown (identical units grouped — click to expand)
| Units | Beds | Baths | Est. rent |
|---|---|---|---|
| 10× units | 10 | — | $24,730 |
| #1 | 10 | — | $2,473 |
| #2 | 10 | — | $2,473 |
| #3 | 10 | — | $2,473 |
| #4 | 10 | — | $2,473 |
| #5 | 10 | — | $2,473 |
| #6 | 10 | — | $2,473 |
| #7 | 10 | — | $2,473 |
| #8 | 10 | — | $2,473 |
| #9 | 10 | — | $2,473 |
| #10 | 10 | — | $2,473 |
| Total (10 units) | $24,729 | ||
UW: 25.0% down · 7.5% · 30yr · 1.5% tax · 5.0% vac · 8.0% maint · 8.0% mgmt
Financing live
Cash to close
- Down payment
- $374,750
- Closing costs
- $44,970
- Reserves months
- —
- Total cash needed
- —
Loan-product check · same deal, 3 products live
Conventional
25% down · 7.5% · 30yr
- Down + closing
- —
- Monthly P&I
- —
- Monthly cashflow
- —
- DSCR
- —
- Eligible?
- —
Personal DTI + credit; lowest rate.
DSCR
20% down · 8.5% · 30yr
- Down + closing
- —
- Monthly P&I
- —
- Monthly cashflow
- —
- DSCR
- —
- Eligible?
- —
No personal income docs; deal must DSCR.
Hard money
10% down · 12.0% · 12mo
- Down + closing
- —
- Monthly P&I
- —
- Monthly cashflow
- —
- DSCR
- —
- Eligible?
- —
Short-term bridge; refi at stabilization.
Listing history 3 events
-
2008-05-27soldstatus $850,000
-
2007-04-30soldstatus $825,000
-
1999-04-30soldstatus $300,000
ⓘ Source: listings_history table (triggers on properties + properties_extension) + one-shot
backfill from property_details.listing_events for pre-trigger history.
Tax reassessment forecast CA · Resets to sale price
- Current annual tax
- $15,664 · $1,305/mo
- Projected year-2 tax
- $15,664 · $1,305/mo
- Expected delta
- $0/yr ($0/mo · 0.0%)
ⓘ Screening estimate from a state-policy table — verify with the county assessor before closing.
Climate risk First Street
- Flood 9/10 Extreme FEMA zone X (unshaded) · 99% chance over 30 yrs
- Wildfire 1/10 Low
- Heat 7/10 Severe 7 d/yr ≥104°F today · 14 d/yr by 30 yrs out
- Wind 1/10 Low
- Air quality 10/10 Extreme 26 unhealthy d/yr today · 28 by 30 yrs out
Nearby sold comps map
Loading sold comps map…
Walkable amenities ~0.75 mi
Loading nearby amenities…
Taxation est. · year 1
- Rental income
- $296,748
- − Mortgage interest
- −$83,967
- − Property taxes
- −$15,664
- − Insurance
- −$8,292
- − Repairs & maintenance
- −$23,740
- − Management
- −$23,740
- − Depreciation
- −$43,607
- Taxable income
- $97,738
- Est. tax owed @ 24.0%
- −$23,457
- After-tax cash flow
- $92,687/yr
For passive investors: Depreciation is non-cash, so a rental often shows a tax loss while cash-flowing — sheltering income. Rental losses are passive: they offset passive income freely, and up to $25,000/yr can offset ordinary (W-2) income if you actively participate and your MAGI is under $100k (phasing out to $0 by $150k); unused losses carry forward. On sale, claimed depreciation is recaptured at up to 25%, and gains may owe capital-gains tax (a 1031 exchange can defer both). Figures are a year-1 estimate at your 24.0% rate — not tax advice; consult a CPA.
Schools (NCES district)
- District
- Woodland Joint Unified
- NCES district ID
- 0643080
- Math proficiency
- 34% ▲ 6.00%
- Reading proficiency
- 58% ▲ 15.00%
- Median HH income
- $57,556
- Composite
- 40.1/100
- National rank
- #3803
- State rank
- #171 of 517 in CA
Livability — Woodland
- Score
- 67/100
- State rank
- #314
- US rank
- #10682
Category grades
Schools grade is shown separately in the Schools card above.
Census & demographics
- Census place
- Woodland, CA
- County
- Yolo County · 212,115 people
- City population
- 66,420
- Metro
- Sacramento-Roseville-Folsom, CA
- Population (ZIP)
- 37,702
- Household income
- $79,486
- Rent vs Own
- Severe rent burden
- 1397.0
Population outlook (Yolo County) Hauer SSP2
- Today (2025)
- 242,183 people
- By 2030
- 257,662 · +6.4%
- By 2040
- 288,050 · +18.9%
- By 2050
- 318,202 · +31.4%
- By 2075
- 392,736 · +62.2%
- By 2100
- 438,150 · +80.9%
Race, ethnicity, and origin ACS 2023
- Neighborhood character
- Diverse neighborhood (Simpson 0.58)
- Race & ethnicity
- Hispanic / Latino 52% White 38% Two or more races 21% Asian 4% Native American 2% Black 1%
- Hispanic origin (detail)
- Mexican 47%
- Common ancestry
- Italian 3% Slovak 2% Romanian 2%
- Foreign-born
- 18% · Canada, China, South Korea
- Languages at home
- 63% English-only · Spanish 33% Other Indo-European 2% Other Asian/Pacific 1%
Political lean MEDSL · Yolo
- 2024 margin
- Solid D (+36.2) · D 66.3% · R 30.1% · Other 3.6%
- 2008→2024 swing
- 0.0pp no change · 2008: 36.2pp · 2024: 36.2pp
- All cycles
- 2024: D+36.2 2020: D+41.4 2016: D+42.0 2012: D+33.2 2008: D+36.2
Not yet ingested
- Civics
- —
Market trends
- HPI YoY
- ▼ -383.53%
- Current HPI
- 286.5911
- Rent YoY
- ▲ 4.50%
- Metro
- Sacramento-Roseville-Folsom, CA
- State GDP YoY
- ▲ 3.21%
- F500 in state
- 116
Industry mix (Fortune 500 HQ in CA)
| Industry | F500 HQs | Revenue |
|---|---|---|
| Technology | 27 | $1,492B |
|
||
| Financial Services | 3 | $174B |
|
||
| Retail | 3 | $44B |
|
||
| Insurance | 3 | $26B |
|
||
| Media / Entertainment | 2 | $115B |
|
||
| Pharmaceuticals / Biotech | 2 | $62B |
|
||
Price history
+183.3% since first listed3 events — show timeline
- 2008-05-27 Sold (Public Records) $850,000 Public Records
- 2007-04-30 Sold (Public Records) $825,000 Public Records
- 1999-04-30 Sold (Public Records) $300,000 Public Records
Property tax history
+3.4%/yrLatest (2025): $15,664 · +2.2% YoY. Source: county tax records.
Cash-flow waterfall
monthlySold comps — $/sqft
last 12 mo · ≤1 miLoading sold comps…