 Multi-family
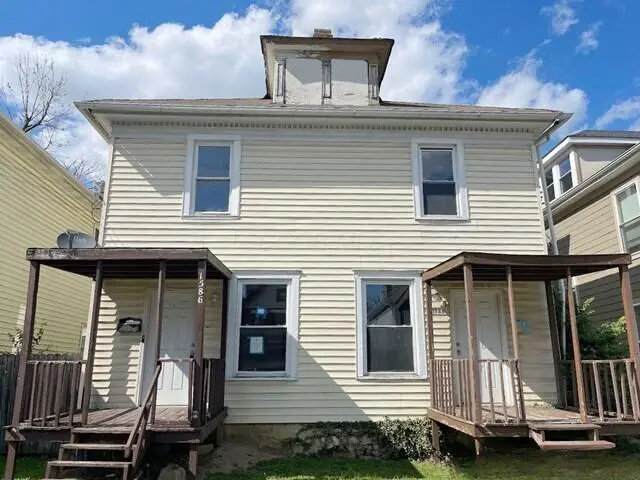
1586 Greenway Ave #1588 · Columbus, OH
Flood risk 3/10 · Minor
- FEMA flood zone
- X (unshaded)
- Chance of flooding over 30 yrs
- 0.2%
- Est. flood insurance / yr
- $473 – $860
Fire risk 1/10 · Minimal
- Est. fire insurance / yr
- $713 – $1,323
Heat risk 4/10 · Minor
- Hot days now (above 100°F)
- 7 days/yr
- Hot days in 30 yrs
- 18 days/yr
Wind risk 2/10 · Minimal
- Chance of severe wind over 30 yrs
- 1.0%
Air-quality risk 3/10 · Minor
- Unhealthy air days now
- 2 days/yr
- Unhealthy air days in 30 yrs
- 4 days/yr
Risk factors via First Street. Map © Google.
Why this score? — see what drove the C grade
The composite is a weighted blend of 9 inputs, each scored 0–100. Each bar is that input's sub-score; the figure is the points it added to the 100-point composite (weight × sub-score).
- Cash flow +20.1/30.0
- ARV discount +13.6/15.0
- DSCR +6.4/10.0
- 1% rule +5.0/10.0
- Livability +4.0/5.0
- Rent growth +3.8/5.0
- Condition / age +2.5/5.0
- Schools +1.7/10.0
- Appreciation +0.0/10.0
$309,900
🖨 Deal sheet 📄 Offer letter ✓ Due diligence
Multi-family units
County records classify this as Multi-Family (2-4 Unit). Listing-text estimate: 1 unit. estimate disagrees with records
Listing remarks
Great investment opportunity! 2 units with 3 bedrooms and 1 upstairs bathroom per unit. Both are blank slates and ready for your vision. Parking in back. Situated in quick moving and upcoming neighborhood! Call your Realtor today for your viewing.
Key facts
- Parking in back
- 4,356 sq ft lot
- Built 1910
Tags
Property features AI
Finance
- Financial info: Property is real estate owned (REO)
Exterior
- Utilities: Public water; Public sewer
- Home design: Duplex; Built in 1910; Street address includes unit 1588
- Construction: Built in 1910
- Exterior features: Lot is approximately 0.1 acres
Interior
- Heating & cooling: Forced air heating; No central cooling
- Interior features: Forced air heating; No central cooling
Neighborhood map
What this means for you Summary
Snapshot
- This is a 6-bed/2.0-bath multifamily listed at $310k.
Deal economics
- At list price, monthly cash flow is $384 ($5k/yr) — positive.
- The deal already cash-flows at list — no discount required.
- Meets the 1% rule at list price ($3k rent vs $310k).
- Recommended offer: $301k (3.0% below list) — sets the bar for market timing.
- Cap rate 7.8% vs local median 3.8% in Columbus — top-decile yield for the area; either an underpriced asset or a hidden risk that comps aren't pricing in. Stress-test before assuming the spread holds.
Location & tenants
- Location reads 81/100 on livability (#97 in OH, #1,491 nationally) — a professional / high-income tenant draw. Strengths: commute A+, cost of living A+, housing A+; Watch: employment C-, crime F.
- Columbus City School District (urban): math 15% / reading 26% proficiency, ranked #626 of 656 in OH (top 95%) — low school quality limits family demand, transient renter base, plan for 1-2y turnover; 72% free/reduced lunch — lower-income household profile, screen leases tightly.
- Market conditions: Rents rising fast (+5.0%/yr); 94 active listings in the ZIP; 3 comparable units currently listed for rent nearby; rentals leasing fast (median 2d on market — plan ~1-2 weeks tenant-placement turnaround); 8,139 units permitted in Franklin County in 2024 (5,940 in 5+ unit buildings).
- At $3,110/mo this rent would consume 78% of the median local household income ($48k/yr) (locally 859% of renters already pay >50% of income on rent) — very limited rent-growth headroom before tenants either downsize or default.
Forward outlook
- Local home prices are declining (-3.0%/yr); year-one equity from $2k of loan paydown is wiped out by about $9k of value loss. Plan a longer hold.
- Franklin County population projected at +34% by 2050 — long-run rental-demand tailwind backs the buy-and-hold thesis.
Negotiation context
- It's been on market 34 days — a 3% lower offer ($301k) is reasonable based on typical stale-listing flexibility.
- 2 sale attempts since 18y ago with the ask held roughly flat each time — persistent listings suggest the price (not the market) is what's stuck; bring a comps-based counter.
Risks & watch-outs
- Watch-outs: built in 1910 — expect roof / HVAC / electrical / plumbing capex.
Questions for the listing agent
- It's been on market 34 days. Have you received any prior offers? Is the seller open to a 3% concession, seller financing, or rate buy-down credit?
- Built in 1910 — when were the roof, HVAC, electrical panel, plumbing, and water heater last replaced?
- Is there a deadline driving the sale (1031 exchange, divorce, estate, relocation)? That informs how much negotiation room exists.
- Crime grade is F in this area — have there been break-ins, vandalism, or insurance claims at this property in the last 3 years? What carrier currently insures it and at what premium?
- What's the average days-on-market for RENTAL listings here right now (not sales)? A rising rental-DOM trend means longer vacancies and softer asking-rent achievability than the comps imply.
- What's the recent tenant-quality profile in this submarket — average credit score on applications, eviction rate, late-payment / NSF rate, and stable-employment percentage? A property-management company in the area should have these aggregated.
- How much new apartment / multifamily construction is in the pipeline within 1–3 miles? Heavy new supply (>2% of stock underway) typically softens rents 12–24 months out; light construction supports rent growth.
Investment metrics
- 1% rule
- 1.00% ✓
- Cap rate
- 7.78%
- Cash-on-cash
- 5.31%
- DSCR
- 1.24
- GRM
- 8.3
CMA / ARV
- ARV (median comp)
- $358,344
- List price
- $309,900
- Delta
- -13.52%
- Verdict
- UNDERPRICED
- Comps
- 20 within 1.0 mi
Show comp detail 9 sales within ~0.75 mi
| Address | Dist | Beds/Ba | Sqft | Sold | Price | $/sf | Match |
|---|---|---|---|---|---|---|---|
| 324-326 Taylor Ave | 0.07mi | 6/— | 2,560 (+4%) | 14mo | $260,000 | $102 | 78 |
| 363-365 Woodland Ave | 0.15mi | 6/— | 2,288 (-7%) | 6mo | $350,000 | $153 | 76 |
| 449-451 N Champion Ave | 0.47mi | 6/— | 2,408 (-2%) | 1mo | $318,000 | $132 | 73 |
| 1529-1531 Richmond Ave | 0.17mi | 6/— | 2,352 (-4%) | 14mo | $352,500 | $150 | 73 |
| 515-517 N Champion Ave | 0.49mi | 6/— | 2,340 (-5%) | 5mo | $217,500 | $93 | 65 |
| 524 N Champion Ave #522 | 0.46mi | 6/— | 2,236 (-9%) | 10mo | $325,000 | $145 | 55 |
| 1310-1312 Atcheson St | 0.40mi | 6/— | 2,236 (-9%) | 14mo | $280,000 | $125 | 54 |
| 205-207 N 22nd St | 0.68mi | 6/— | 2,520 (+2%) | 23mo | $190,000 | $75 | 45 |
| 1214 Atcheson St #1216 | 0.54mi | 6/— | 2,184 (-11%) | 17mo | $355,000 | $163 | 42 |
Match score weights: distance 35% · size 25% · config 20% · recency 20%. Top-matched comps best support the ARV.
Projected returns pro-forma
-3.0% appreciation · 5.03% rent growth · sell at horizon
- IRR
- -5.9%
- Equity multiple
- 0.78×
- Total profit
- $-19,270
- Equity at exit
- $46,207
- IRR
- 6.0%
- Equity multiple
- 1.49×
- Total profit
- $42,459
- Equity at exit
- $26,794
Cash invested: $86,772 (down + closing). Projections, not guarantees.
Landlord ↔ Tenant lean methodology
- Overall (STATE)
- 73 Landlord-Friendly
- State Ohio
- 73 Landlord-Friendly · R+6
- County
- — inherits STATE
- City
- — inherits STATE
ZIP-level market 43203
- Home prices YoY
- -31.9%
- Rents YoY
- 5.0%
- Active inventory
- 94
- Price-to-rent
- 16.6×
Monthly cashflow live
- Estimated rent
- $3,110 high interval (Pro) →
- Mortgage (P&I)
- −$1,625
- Tax from tax record
- −$319 /mo · $3,823/yr
- Insurance
- −$129
- HOA
- −$0
- Vacancy / Maint / Mgmt
- −$653
- Net cashflow
- $384
Break-even live
2-unit breakdown (identical units grouped — click to expand)
| Units | Beds | Baths | Est. rent |
|---|---|---|---|
| 2× units | 3 | 1 | $3,110 |
| #1 | 3 | 1 | $1,555 |
| #2 | 3 | 1 | $1,555 |
| Total (2 units) | $3,110 | ||
UW: 25.0% down · 7.5% · 30yr · 1.5% tax · 5.0% vac · 8.0% maint · 8.0% mgmt
Financing live
Cash to close
- Down payment
- $77,475
- Closing costs
- $9,297
- Reserves months
- —
- Total cash needed
- —
Loan-product check · same deal, 3 products live
Conventional
25% down · 7.5% · 30yr
- Down + closing
- —
- Monthly P&I
- —
- Monthly cashflow
- —
- DSCR
- —
- Eligible?
- —
Personal DTI + credit; lowest rate.
DSCR
20% down · 8.5% · 30yr
- Down + closing
- —
- Monthly P&I
- —
- Monthly cashflow
- —
- DSCR
- —
- Eligible?
- —
No personal income docs; deal must DSCR.
Hard money
10% down · 12.0% · 12mo
- Down + closing
- —
- Monthly P&I
- —
- Monthly cashflow
- —
- DSCR
- —
- Eligible?
- —
Short-term bridge; refi at stabilization.
Rent comps 3 comps
| Address | Beds | Baths | Sqft | Rent | $/sqft | DOM | Units | Dist |
|---|---|---|---|---|---|---|---|---|
| 1445 E Broad St Columbus, OH | 1.0–5.0 | 1.0–5.0 | 2164 | $3,500 | $1.62 | 1d | 4 | 0.59mi |
| 78 Auburn Ave Columbus, OH | 5.0 | 3.5 | 2799 | $3,950 | $1.41 | 1d | 1 | 0.62mi |
| 438 S Ohio Ave Columbus, OH | 5.0 | 2.0 | 1900 | $2,195 | $1.16 | 43d | 1 | 1.34mi |
Listing history 17 events
-
2026-06-18days on market $309,900 Active 34 DOM
-
2026-06-17pricedays on market $309,900 Active 33 DOM
-
2026-06-16days on market $325,000 Active 32 DOM
-
2026-06-15days on market $325,000 Active 31 DOM
-
2026-06-13days on market $325,000 Active 29 DOM
-
2026-06-13days on market $325,000 Active 28 DOM
-
2026-06-09days on market $325,000 Active 25 DOM
-
2026-06-08days on market $325,000 Active 24 DOM
-
2026-06-07days on market $325,000 Active 23 DOM
-
2026-06-05days on market $325,000 Active 20 DOM
-
2026-06-03days on market $325,000 Active 19 DOM
-
2026-06-02days on market $325,000 Active 18 DOM
-
2026-06-01days on market $325,000 Active 17 DOM
-
2026-05-31days on market $325,000 Active 16 DOM
-
2026-05-15$325,000 Active 247-char remark
-
2009-07-19historical
-
2008-07-21$56,200
ⓘ Source: listings_history table (triggers on properties + properties_extension) + one-shot
backfill from property_details.listing_events for pre-trigger history.
Tax reassessment forecast OH · Partial reset (capped growth)
- Current annual tax
- $3,823 · $319/mo
- Projected year-2 tax
- $4,328 · $361/mo
- Expected delta
- +$506/yr (+$42/mo · 13.2%)
ⓘ Screening estimate from a state-policy table — verify with the county assessor before closing.
Climate risk First Street
- Flood 3/10 Moderate FEMA zone X (unshaded) · 20% chance over 30 yrs
- Wildfire 1/10 Low
- Heat 4/10 Moderate 7 d/yr ≥100°F today · 18 d/yr by 30 yrs out
- Wind 2/10 Low 100% chance of damaging wind over 30 yrs
- Air quality 3/10 Moderate 2 unhealthy d/yr today · 4 by 30 yrs out
Nearby sold comps map
Loading sold comps map…
Walkable amenities ~0.75 mi
Loading nearby amenities…
Taxation est. · year 1
- Rental income
- $37,320
- − Mortgage interest
- −$17,359
- − Property taxes
- −$3,823
- − Insurance
- −$1,550
- − Repairs & maintenance
- −$2,986
- − Management
- −$2,986
- − Depreciation
- −$9,015
- Taxable loss
- −$398
- Est. tax savings @ 24.0%
- +$95
- After-tax cash flow
- $4,704/yr
For passive investors: Depreciation is non-cash, so a rental often shows a tax loss while cash-flowing — sheltering income. Rental losses are passive: they offset passive income freely, and up to $25,000/yr can offset ordinary (W-2) income if you actively participate and your MAGI is under $100k (phasing out to $0 by $150k); unused losses carry forward. On sale, claimed depreciation is recaptured at up to 25%, and gains may owe capital-gains tax (a 1031 exchange can defer both). Figures are a year-1 estimate at your 24.0% rate — not tax advice; consult a CPA.
Schools (NCES district)
- District
- Columbus City School District
- NCES district ID
- 3904380
- Math proficiency
- 15% ▼ -17.00%
- Reading proficiency
- 26% ▼ -12.00%
- Median HH income
- $38,483
- Composite
- 17.19/100
- National rank
- #9105
- State rank
- #626 of 656 in OH
Livability — Columbus
- Score
- 81/100
- State rank
- #97
- US rank
- #1491
Category grades
Schools grade is shown separately in the Schools card above.
Census & demographics
- Census place
- Columbus, OH
- County
- Franklin County · 1,351,780 people
- City population
- 612,189
- Metro
- Columbus, OH
- Population (ZIP)
- 8,618
- Household income
- $47,572
- Rent vs Own
- Severe rent burden
- 859.0
Population outlook (Franklin County) Hauer SSP2
- Today (2025)
- 1,456,139 people
- By 2030
- 1,556,890 · +6.9%
- By 2040
- 1,757,349 · +20.7%
- By 2050
- 1,950,539 · +34.0%
- By 2075
- 2,376,171 · +63.2%
- By 2100
- 2,636,796 · +81.1%
Race, ethnicity, and origin ACS 2023
- Neighborhood character
- Diverse neighborhood (Simpson 0.56)
- Race & ethnicity
- Black 59% White 29% Two or more races 8% Hispanic / Latino 2% Asian 2%
- Common ancestry
- Lithuanian 1% Romanian 1% Swiss 1%
- Foreign-born
- 12% · Canada
- Languages at home
- 86% English-only · Other Indo-European 1% Spanish 1% French/Haitian/Cajun 1%
Political lean MEDSL · Franklin
- 2024 margin
- Strong D (+28.4) · D 63.7% · R 35.3% · Other 1.0%
- 2008→2024 swing
- +7.7pp toward D · 2008: 20.7pp · 2024: 28.4pp
- All cycles
- 2024: D+28.4 2020: D+31.4 2016: D+25.9 2012: D+21.7 2008: D+20.7
Not yet ingested
- Civics
- —
Market trends
- HPI YoY
- ▼ -102.09%
- Current HPI
- 217.3929
- Rent YoY
- ▲ 5.03%
- Metro
- Columbus, OH
- State GDP YoY
- ▲ 1.98%
- F500 in state
- 48
Industry mix (Fortune 500 HQ in OH)
| Industry | F500 HQs | Revenue |
|---|---|---|
| Insurance | 3 | $145B |
|
||
| Industrial Machinery | 3 | $49B |
|
||
| Financial Services | 3 | $24B |
|
||
| Consumer Goods | 2 | $93B |
|
||
| Aerospace / Defense | 2 | $47B |
|
||
| Utilities | 2 | $33B |
|
||
Price history
+451.4% since first listed4 events — show timeline
- 2026-06-17 Price Changed $309,900 CBRMLS
- 2026-05-15 Listed $325,000 CBRMLS
- 2009-07-19 Listing Removed — CBRMLS
- 2008-07-21 Listed $56,200 CBRMLS
Property tax history
+7.6%/yrLatest (2024): $3,823 · +1.3% YoY. Source: county tax records.
Cash-flow waterfall
monthlySold comps — $/sqft
last 12 mo · ≤1 miLoading sold comps…