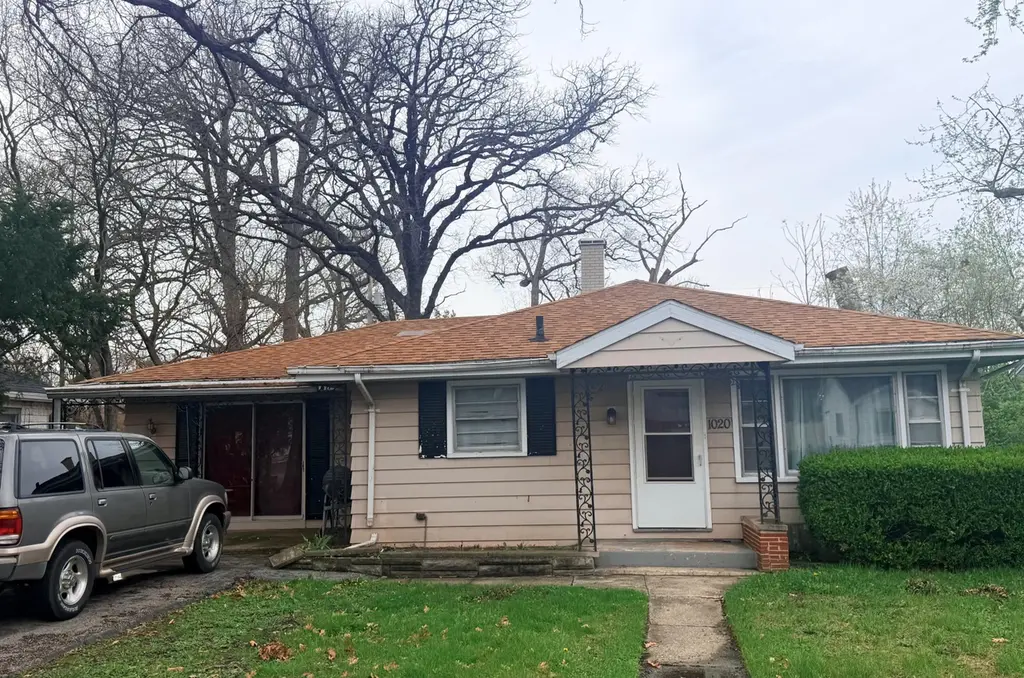
1020 E 61st Pl · Merrillville, IN
Flood risk 1/10 · Minimal
- FEMA flood zone
- X (unshaded)
- Chance of flooding over 30 yrs
- 0.0%
- Est. flood insurance / yr
- $507 – $1,088
Fire risk 2/10 · Minimal
- Est. fire insurance / yr
- $717 – $1,331
Heat risk 2/10 · Minimal
- Hot days now (above 101°F)
- 7 days/yr
- Hot days in 30 yrs
- 15 days/yr
Wind risk 2/10 · Minimal
- Chance of severe wind over 30 yrs
- —
Air-quality risk 3/10 · Minor
- Unhealthy air days now
- 2 days/yr
- Unhealthy air days in 30 yrs
- 3 days/yr
Risk factors via First Street. Map © Google.
Why this score? — see what drove the B grade
The composite is a weighted blend of 9 inputs, each scored 0–100. Each bar is that input's sub-score; the figure is the points it added to the 100-point composite (weight × sub-score).
- Cash flow +28.8/30.0
- ARV discount +15.0/15.0
- DSCR +10.0/10.0
- 1% rule +8.1/10.0
- Livability +3.8/5.0
- Rent growth +3.5/5.0
- Schools +2.6/10.0
- Condition / age +2.5/5.0
- Appreciation +0.0/10.0
$129,900
🖨 Deal sheet 📄 Offer letter ✓ Due diligence
Listing remarks MLS
Investor Special in Merrillville!! This 3-bedroom, 1-bath ranch home is the perfect project for investors or 1st time homeowners looking to build equity. The home features a functional layout and includes additional storage space in the backyard, offering added convenience for future occupants. The property provides easy access to shopping, dining, schools, and major highways, making it attractive for both homeowners and tenants. With the right vision and updates, this property can be transformed into a profitable investment. SOLD AS IS.
Key facts
- Functional layout
- 9,147 sq ft lot
- Built 1952
Tags
Neighborhood map
What this means for you Summary
Snapshot
- This is a 3-bed/1.0-bath single-family listed at $130k.
Deal economics
- At list price, monthly cash flow is $438 ($5k/yr) — positive.
- The deal already cash-flows at list — no discount required.
- Meets the 1% rule at list price ($2k rent vs $130k).
- Recommended offer: $128k (1.5% below list) — sets the bar for market timing.
- Cap rate 10.3% vs local median 4.7% in Merrillville — top-decile yield for the area; either an underpriced asset or a hidden risk that comps aren't pricing in. Stress-test before assuming the spread holds.
Location & tenants
- Location reads 76/100 on livability (#50 in IN, #3,393 nationally) — a middle-class / working-renter tenant base. Strengths: commute A+, cost of living A+, housing A+; Watch: schools D+, amenities F, health & safety D-.
- Merrillville Community School Corporation (suburban): math 22% / reading 36% proficiency, ranked #240 of 301 in IN (top 80%) — low school quality limits family demand, transient renter base, plan for 1-2y turnover.
- Market conditions: Rents rising fast (+4.1%/yr); 264 active listings in the ZIP; 12 comparable units currently listed for rent nearby; rentals leasing fast (median 6d on market — plan ~1-2 weeks tenant-placement turnaround); 1,642 units permitted in Lake County in 2024 (14 in 5+ unit buildings).
- This rent runs 32% of the median local income ($64k/yr) — at the standard rent-burdened threshold; future hikes will face affordability resistance.
Forward outlook
- Local home prices are declining (-3.0%/yr); year-one equity from $898 of loan paydown is wiped out by about $4k of value loss. Plan a longer hold.
- Lake County population projected to shrink 7% by 2050 — rents likely to lag national; underwrite the cash flow, not the appreciation.
- At projected returns (-3.0% appreciation + 4.1% rent growth), your $36k cash investment doubles in ~8 years — after that, you're playing with house money.
Negotiation context
- It's been on market 27 days — a 2% lower offer ($128k) is reasonable based on typical stale-listing flexibility.
- 2 sale attempts since 12y ago with the ask held roughly flat each time — persistent listings suggest the price (not the market) is what's stuck; bring a comps-based counter.
- Current owner paid $38k; list at $130k implies a 246% gain — meaningful room to come down on a strong offer.
Risks & watch-outs
- Watch-outs: built in 1952 — expect roof / HVAC / electrical / plumbing capex.
Questions for the listing agent
- Built in 1952 — when were the roof, HVAC, electrical panel, plumbing, and water heater last replaced?
- Is there a deadline driving the sale (1031 exchange, divorce, estate, relocation)? That informs how much negotiation room exists.
- Schools are D-rated, which usually means shorter tenancies and higher turnover. Who's the typical renter profile here, and what's been the actual vacancy rate?
- What's the average days-on-market for RENTAL listings here right now (not sales)? A rising rental-DOM trend means longer vacancies and softer asking-rent achievability than the comps imply.
- What's the recent tenant-quality profile in this submarket — average credit score on applications, eviction rate, late-payment / NSF rate, and stable-employment percentage? A property-management company in the area should have these aggregated.
- How much new for-sale + rental construction is in the pipeline within 1–3 miles? Heavy new supply typically softens prices + rents 12–24 months out; constrained supply supports both.
Investment metrics
- 1% rule
- 1.31% ✓
- Cap rate
- 10.34%
- Cash-on-cash
- 14.45%
- DSCR
- 1.64
- GRM
- 6.4
CMA / ARV
- ARV (median comp)
- $222,113
- List price
- $129,900
- Delta
- -41.52%
- Verdict
- UNDERPRICED
- Comps
- 20 within 1.0 mi
Show comp detail 9 sales within ~0.75 mi
| Address | Dist | Beds/Ba | Sqft | Sold | Price | $/sf | Match |
|---|---|---|---|---|---|---|---|
| 6325 Kentucky Pl | 0.20mi | 3/1.0 | 1,333 (-8%) | 10mo | $172,500 | $129 | 69 |
| 1016 E 63rd Pl | 0.20mi | 3/1.0 | 1,319 (-9%) | 12mo | $219,400 | $166 | 66 |
| 6200 Kentucky Pl | 0.08mi | 3/1.5 | 1,654 (+14%) | 16mo | $220,000 | $133 | 57 |
| 5618 Indiana St | 0.63mi | 3/2.0 | 1,470 (+2%) | 18mo | $235,000 | $160 | 49 |
| 5912 Vermont St | 0.22mi | 3/2.0 | 1,624 (+12%) | 20mo | $259,900 | $160 | 48 |
| 1455 Mississippi Pl | 0.56mi | 3/2.0 | 1,655 (+14%) | 2mo | $235,000 | $142 | 44 |
| 1455 Swift St | 0.59mi | 3/2.0 | 1,632 (+13%) | 8mo | $295,000 | $181 | 41 |
| 4521 W 15th Pl | 0.55mi | 3/2.0 | 1,654 (+14%) | 15mo | $299,000 | $181 | 34 |
| 1437 Mississippi Pl | 0.58mi | 3/1.5 | 1,650 (+14%) | 20mo | $235,000 | $142 | 31 |
Match score weights: distance 35% · size 25% · config 20% · recency 20%. Top-matched comps best support the ARV.
Projected returns pro-forma
-3.0% appreciation · 4.1% rent growth · sell at horizon
- IRR
- 6.1%
- Equity multiple
- 1.24×
- Total profit
- $8,765
- Equity at exit
- $19,369
- IRR
- 16.5%
- Equity multiple
- 2.42×
- Total profit
- $51,618
- Equity at exit
- $11,231
Cash invested: $36,372 (down + closing). Projections, not guarantees.
Landlord ↔ Tenant lean methodology
- Overall (STATE)
- 90 Strongly Landlord-Friendly
- State Indiana
- 90 Strongly Landlord-Friendly · R+11
- County
- — inherits STATE
- City
- — inherits STATE
ZIP-level market 46410
- Rents YoY
- 4.1%
- Active inventory
- 264
- Price-to-rent
- 6.4×
Monthly cashflow live
- Estimated rent
- $1,695 high interval (Pro) →
- Mortgage (P&I)
- −$681
- Tax from tax record
- −$166 /mo · $1,995/yr
- Insurance
- −$54
- HOA
- −$0
- Vacancy / Maint / Mgmt
- −$356
- Net cashflow
- $438
Break-even live
UW: 25.0% down · 7.5% · 30yr · 1.5% tax · 5.0% vac · 8.0% maint · 8.0% mgmt
Financing live
Cash to close
- Down payment
- $32,475
- Closing costs
- $3,897
- Reserves months
- —
- Total cash needed
- —
Loan-product check · same deal, 3 products live
Conventional
25% down · 7.5% · 30yr
- Down + closing
- —
- Monthly P&I
- —
- Monthly cashflow
- —
- DSCR
- —
- Eligible?
- —
Personal DTI + credit; lowest rate.
DSCR
20% down · 8.5% · 30yr
- Down + closing
- —
- Monthly P&I
- —
- Monthly cashflow
- —
- DSCR
- —
- Eligible?
- —
No personal income docs; deal must DSCR.
Hard money
10% down · 12.0% · 12mo
- Down + closing
- —
- Monthly P&I
- —
- Monthly cashflow
- —
- DSCR
- —
- Eligible?
- —
Short-term bridge; refi at stabilization.
Rent comps 12 comps
| Address | Beds | Baths | Sqft | Rent | $/sqft | DOM | Units | Dist |
|---|---|---|---|---|---|---|---|---|
| 6004 Virginia St Merrillville, IN | 3.0 | 2.5 | 1544 | $1,800 | $1.17 | 1d | 1 | 0.33mi |
| 5850 Pennsylvania St Merrillville, IN | 1.0–2.0 | 1.0 | 826 | $1,195 | $1.45 | 1d | 4 | 0.60mi |
| 6271 Oregon St Hobart, IN | 4.0 | 2.0 | 1648 | $1,895 | $1.15 | 16d | 1 | 1.08mi |
| 330 E 69th Pl Merrillville, IN | 3.0 | 1.5 | 1482 | $1,850 | $1.25 | 1d | 1 | 1.15mi |
| 5719 Van Buren St Merrillville, IN | 3.0 | 2.0 | 950 | $1,500 | $1.58 | 22d | 1 | 1.21mi |
| 5026 Kentucky St Gary, IN | 3.0 | 1.0 | 1200 | $1,100 | $0.92 | 6d | 1 | 1.39mi |
| 5001 Carolina St Gary, IN | 3.0 | 1.0 | 875 | $1,350 | $1.54 | 2d | 1 | 1.43mi |
| 910 W 56th Ave Merrillville, IN | 4.0 | 1.5 | 1431 | $1,825 | $1.28 | 1d | 1 | 1.45mi |
| 4974 Tennessee St Gary, IN | 2.0 | 1.0 | 1100 | $1,175 | $1.07 | 19d | 1 | 1.45mi |
| 505 W 53rd Ave Merrillville, IN | 4.0 | 2.0 | 1650 | $1,650 | $1.00 | 1d | 1 | 1.47mi |
| 6850 Van Buren Pl Merrillville, IN | 3.0 | 1.0 | 1120 | $1,795 | $1.60 | 20d | 1 | 1.49mi |
| 6839 Harrison St Merrillville, IN | 3.0 | 1.0 | 1128 | $1,650 | $1.46 | 12d | 1 | 1.50mi |
Listing history 5 events
-
2026-05-13status Pending 544-char remark
Show marketing remark (544 chars)
Investor Special in Merrillville!! This 3-bedroom, 1-bath ranch home is the perfect project for investors or 1st time homeowners looking to build equity. The home features a functional layout and includes additional storage space in the backyard, offering added convenience for future occupants. The property provides easy access to shopping, dining, schools, and major highways, making it attractive for both homeowners and tenants. With the right vision and updates, this property can be transformed into a profitable investment. SOLD AS IS.
-
2026-04-15$129,900 Active 544-char remark
Show marketing remark (544 chars)
Investor Special in Merrillville!! This 3-bedroom, 1-bath ranch home is the perfect project for investors or 1st time homeowners looking to build equity. The home features a functional layout and includes additional storage space in the backyard, offering added convenience for future occupants. The property provides easy access to shopping, dining, schools, and major highways, making it attractive for both homeowners and tenants. With the right vision and updates, this property can be transformed into a profitable investment. SOLD AS IS.
-
2022-05-26price $1,300
-
2014-03-07soldstatus $37,500 147-char remark
Show marketing remark (147 chars)
Foreclosure is fixer upper opportunity for cash buyer investors. All data is believed accurate but not warranted. Property is sold as is, where is.
-
2014-02-04$39,999 147-char remark
Show marketing remark (147 chars)
Foreclosure is fixer upper opportunity for cash buyer investors. All data is believed accurate but not warranted. Property is sold as is, where is.
ⓘ Source: listings_history table (triggers on properties + properties_extension) + one-shot
backfill from property_details.listing_events for pre-trigger history.
Tax reassessment forecast IN · Partial reset (capped growth)
- Current annual tax
- $1,995 · $166/mo
- Projected year-2 tax
- $1,995 · $166/mo
- Expected delta
- $0/yr ($0/mo · 0.0%)
ⓘ Screening estimate from a state-policy table — verify with the county assessor before closing.
Climate risk First Street
- Flood 1/10 Low FEMA zone X (unshaded) · 0% chance over 30 yrs
- Wildfire 2/10 Low
- Heat 2/10 Low 7 d/yr ≥101°F today · 15 d/yr by 30 yrs out
- Wind 2/10 Low
- Air quality 3/10 Moderate 2 unhealthy d/yr today · 3 by 30 yrs out
Nearby sold comps map
Loading sold comps map…
Walkable amenities ~0.75 mi
Loading nearby amenities…
Taxation est. · year 1
- Rental income
- $20,346
- − Mortgage interest
- −$7,276
- − Property taxes
- −$1,995
- − Insurance
- −$650
- − Repairs & maintenance
- −$1,628
- − Management
- −$1,628
- − Depreciation
- −$3,779
- Taxable income
- $3,391
- Est. tax owed @ 24.0%
- −$814
- After-tax cash flow
- $4,441/yr
For passive investors: Depreciation is non-cash, so a rental often shows a tax loss while cash-flowing — sheltering income. Rental losses are passive: they offset passive income freely, and up to $25,000/yr can offset ordinary (W-2) income if you actively participate and your MAGI is under $100k (phasing out to $0 by $150k); unused losses carry forward. On sale, claimed depreciation is recaptured at up to 25%, and gains may owe capital-gains tax (a 1031 exchange can defer both). Figures are a year-1 estimate at your 24.0% rate — not tax advice; consult a CPA.
Schools (NCES district)
- District
- Merrillville Community School Corporation
- NCES district ID
- 1809690
- Math proficiency
- 22% ▼ -17.00%
- Reading proficiency
- 36% ▼ -8.00%
- Median HH income
- $54,401
- Composite
- 25.74/100
- National rank
- #7375
- State rank
- #240 of 301 in IN
Livability — Merrillville
- Score
- 76/100
- State rank
- #50
- US rank
- #3393
Category grades
Schools grade is shown separately in the Schools card above.
Census & demographics
- Census place
- Merrillville, IN
- County
- Lake County · 422,878 people
- City population
- 39,243
- Metro
- Chicago-Naperville-Elgin, IL-IN-WI
- Population (ZIP)
- 39,243
- Household income
- $64,127
- Rent vs Own
- Severe rent burden
- 1644.0
Population outlook (Lake County) Hauer SSP2
- Today (2025)
- 484,026 people
- By 2030
- 478,091 · -1.2%
- By 2040
- 462,974 · -4.3%
- By 2050
- 449,894 · -7.1%
- By 2075
- 436,169 · -9.9%
- By 2100
- 426,607 · -11.9%
Race, ethnicity, and origin ACS 2023
- Neighborhood character
- Diverse neighborhood (Simpson 0.66)
- Race & ethnicity
- Black 46% White 32% Hispanic / Latino 16% Two or more races 9% Asian 2%
- Hispanic origin (detail)
- Mexican 11% Puerto Rican 3%
- Common ancestry
- Romanian 4% Iranian 2% Italian 1%
- Foreign-born
- 7% · Canada
- Languages at home
- 88% English-only · Spanish 7% Other Indo-European 2%
Political lean MEDSL · Lake
- 2024 margin
- Lean D (+5.6) · D 52.1% · R 46.5% · Other 1.5%
- 2008→2024 swing
- -28.6pp toward R · 2008: 34.3pp · 2024: 5.6pp
- All cycles
- 2024: D+5.6 2020: D+15.1 2016: D+20.6 2012: D+31.0 2008: D+34.3
Not yet ingested
- Civics
- —
Market trends
- HPI YoY
- ▼ -180.11%
- Current HPI
- 240.8833
- Rent YoY
- ▲ 4.10%
- Metro
- Chicago-Naperville-Elgin, IL-IN-WI
- State GDP YoY
- ▲ 2.90%
- F500 in state
- 18
Industry mix (Fortune 500 HQ in IN)
| Industry | F500 HQs | Revenue |
|---|---|---|
| Industrial Machinery | 2 | $37B |
|
||
| Healthcare | 1 | $177B |
|
||
| Pharmaceuticals | 1 | $45B |
|
||
| Metals / Steel | 1 | $18B |
|
||
| Agriculture | 1 | $17B |
|
||
| Packaging | 1 | $12B |
|
||
Price history
+224.8% since first listed5 events — show timeline
- 2026-05-13 Pending — NIRA MLS as Distributed by MLS Grid
- 2026-04-15 Listed $129,900 NIRA MLS as Distributed by MLS Grid
- 2022-05-26 Price Changed $1,300 RENT.
- 2014-03-07 Sold (MLS) $37,500 NIRA MLS as Distributed by MLS Grid
- 2014-02-04 Listed $39,999 NIRA MLS as Distributed by MLS Grid
Property tax history
+0.3%/yrLatest (2024): $1,995 · +2.6% YoY. Source: county tax records.
Cash-flow waterfall
monthlySold comps — $/sqft
last 12 mo · ≤1 miLoading sold comps…