5604 Newcastle Ct #5711 · Ave Maria, FL
Flood risk No data
- FEMA flood zone
- —
- Chance of flooding over 30 yrs
- —
- Est. flood insurance / yr
- —
Fire risk No data
- Est. fire insurance / yr
- —
Heat risk No data
- Hot days now (above threshold)
- —
- Hot days in 30 yrs
- —
Wind risk No data
- Chance of severe wind over 30 yrs
- —
Air-quality risk No data
- Unhealthy air days now
- —
- Unhealthy air days in 30 yrs
- —
Risk factors via First Street. Map © Google.
Why this score? — see what drove the C+ grade
The composite is a weighted blend of 9 inputs, each scored 0–100. Each bar is that input's sub-score; the figure is the points it added to the 100-point composite (weight × sub-score).
- Cash flow +19.6/30.0
- 1% rule +8.6/10.0
- ARV discount +7.5/15.0
- DSCR +6.2/10.0
- Schools +5.0/10.0
- Appreciation +4.5/10.0
- Condition / age +4.0/5.0
- Rent growth +3.2/5.0
- Livability +2.5/5.0
$319,997
🖨 Deal sheet 📄 Offer letter ✓ Due diligence
Listing remarks
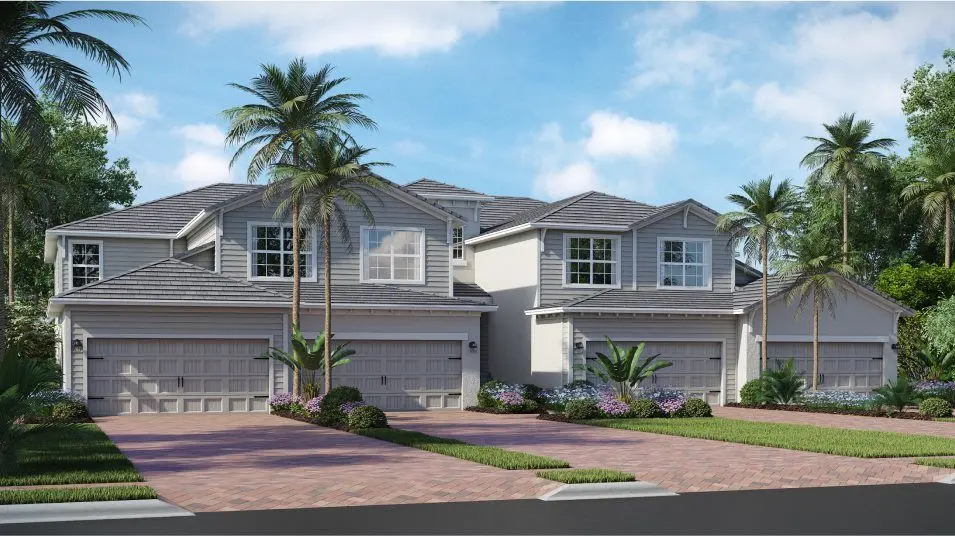
One or more photo(s) has been virtually staged, AI generated or rendered. MOVE-IN READY!! This spacious single-story attached home features an open layout among the dining room, kitchen and living room, with sliding doors that extend to the lanai for outdoor activities. Near the foyer are two secondary bedrooms, while the owner’s suite is tucked away on the other side for extra privacy. Welcome to paradise—where you’ll find championship golf, top-tier resort amenities and endless opportunities to play, relax and connect. Set in stunning Ave Maria, this gated community is thoughtfully designed for your next best chapter. Prices, dimensions and features may vary and are subj
Key facts
- Gated community
- Open layout
- Sliding doors
Tags
Property features AI
Finance
- Financial info: List price $319,997
Exterior
- Parking: 2 total parking spaces; 2-car garage
- Home design: Condominium / townhouse unit at 5604 Newcastle Ct #5711, Ave Maria FL 34142; Plan name: Arrowhead
- Exterior features: Living area of 1,741 square feet
Interior
- Bedrooms: 3 bedrooms
- Bathrooms: 2 full bathrooms
- Interior features: Spec-built Arrowhead plan; Active listing
Neighborhood map
What this means for you Summary
Snapshot
- This is a 3-bed/2.0-bath condo listed at $320k. Condition is rated good.
Deal economics
- At list price, monthly cash flow is $371 ($4k/yr) — positive.
- The deal already cash-flows at list — no discount required.
- Meets the 1% rule at list price ($4k rent vs $320k).
Location & tenants
- Location reads: area grade C — affects rentability + tenant quality, not the cash-flow math above.
- Collier (suburban): math 60% / reading 56% proficiency, ranked #16 of 73 in FL (top 22%) — acceptable for families but not a draw, mixed tenant base, ~2y average lease.
- Market conditions: Rents rising (+3.0%/yr); 449 active listings in the ZIP; 40 comparable units currently listed for rent nearby; rentals at typical pace (median 23d on market — plan ~3-4 weeks tenant-placement turnaround); 3,520 units permitted in Collier County in 2024 (959 in 5+ unit buildings).
- At $4,340/mo this rent would consume 84% of the median local household income ($62k/yr) (locally 1093% of renters already pay >50% of income on rent) — very limited rent-growth headroom before tenants either downsize or default.
Forward outlook
- Local home prices are declining (-1.1%/yr); year-one equity from $2k of loan paydown is wiped out by about $3k of value loss. Plan a longer hold.
- Collier County population projected at +30% by 2050 — long-run rental-demand tailwind backs the buy-and-hold thesis.
Negotiation context
- Only 9 days on market — expect competitive offers; lowballing is unlikely to land.
Questions for the listing agent
- What does the HOA fee cover, when was the last increase, and are there any pending special assessments or reserve-fund shortfalls?
- Any open or pending special assessments — roof, HVAC, plumbing, elevator, façade? What's the per-unit balance and payoff schedule, and is the seller paying it off at close or rolling it to the buyer?
- Is there a deadline driving the sale (1031 exchange, divorce, estate, relocation)? That informs how much negotiation room exists.
- What's the average days-on-market for RENTAL listings here right now (not sales)? A rising rental-DOM trend means longer vacancies and softer asking-rent achievability than the comps imply.
- What's the recent tenant-quality profile in this submarket — average credit score on applications, eviction rate, late-payment / NSF rate, and stable-employment percentage? A property-management company in the area should have these aggregated.
- How much new apartment / multifamily construction is in the pipeline within 1–3 miles? Heavy new supply (>2% of stock underway) typically softens rents 12–24 months out; light construction supports rent growth.
Investment metrics
- 1% rule
- 1.36% ✓
- Cap rate
- 7.68%
- Cash-on-cash
- 4.97%
- DSCR
- 1.22
- GRM
- 6.1
CMA / ARV
No comps found within radius.
Projected returns pro-forma
-1.05% appreciation · 2.95% rent growth · sell at horizon
- IRR
- -0.2%
- Equity multiple
- 0.99×
- Total profit
- $-790
- Equity at exit
- $76,503
- IRR
- 6.6%
- Equity multiple
- 1.63×
- Total profit
- $56,577
- Equity at exit
- $79,705
Cash invested: $89,599 (down + closing). Projections, not guarantees.
Landlord ↔ Tenant lean methodology
- Overall (STATE)
- 87 Strongly Landlord-Friendly
- State Florida
- 87 Strongly Landlord-Friendly · R+3
- County
- — inherits STATE
- City
- — inherits STATE
ZIP-level market 34142
- Home prices YoY
- -0.5%
- Rents YoY
- 3.0%
- Active inventory
- 449
- Price-to-rent
- 6.1×
Monthly cashflow live
- Estimated rent
- $4,340 high interval (Pro) →
- Mortgage (P&I)
- −$1,678
- Tax est. 1.5%
- −$400 /mo · $4,800/yr
- Insurance
- −$133
- HOA
- −$846
- Vacancy / Maint / Mgmt
- −$911
- Net cashflow
- $371
Break-even live
UW: 25.0% down · 7.5% · 30yr · 1.5% tax · 5.0% vac · 8.0% maint · 8.0% mgmt
Financing live
Cash to close
- Down payment
- $79,999
- Closing costs
- $9,600
- Reserves months
- —
- Total cash needed
- —
Loan-product check · same deal, 3 products live
Conventional
25% down · 7.5% · 30yr
- Down + closing
- —
- Monthly P&I
- —
- Monthly cashflow
- —
- DSCR
- —
- Eligible?
- —
Personal DTI + credit; lowest rate.
DSCR
20% down · 8.5% · 30yr
- Down + closing
- —
- Monthly P&I
- —
- Monthly cashflow
- —
- DSCR
- —
- Eligible?
- —
No personal income docs; deal must DSCR.
Hard money
10% down · 12.0% · 12mo
- Down + closing
- —
- Monthly P&I
- —
- Monthly cashflow
- —
- DSCR
- —
- Eligible?
- —
Short-term bridge; refi at stabilization.
Rent comps 40 comps
| Address | Beds | Baths | Sqft | Rent | $/sqft | DOM | Units | Dist |
|---|---|---|---|---|---|---|---|---|
| 5583 Double Eagle Cir Unit 4118 Ave Maria, FL | 3.0 | 2.0 | 1301 | $4,700 | $3.61 | 23d | 1 | 0.10mi |
| 5583 Double Eagle Cir #4135 Ave Maria, FL | 2.0 | 2.0 | 1120 | $2,195 | $1.96 | 23d | 1 | 0.10mi |
| 5583 Double Eagle Cir Unit 4143 Ave Maria, FL | 2.0 | 2.0 | 1120 | $5,795 | $5.17 | 23d | 1 | 0.10mi |
| 5583 Double Eagle Cir #4137 Ave Maria, FL | 2.0 | 2.0 | 1154 | $5,795 | $5.02 | 21d | 1 | 0.10mi |
| 5538 Hampton Links Ct Ave Maria, FL | 3.0 | 3.0 | 2247 | $6,295 | $2.80 | 21d | 1 | 0.10mi |
| 5629 Double Eagle Cir Ave Maria, FL | 2.0 | 2.0 | 1120 | $5,495 | $4.91 | 23d | 1 | 0.10mi |
| 5522 Hampton Links Ct Ave Maria, FL | 2.0 | 2.5 | 1850 | $3,995 | $2.16 | 23d | 1 | 0.10mi |
| 5583 Double Eagle Cir Ave Maria, FL | 2.0 | 2.0 | 1239 | $2,495 | $2.01 | 23d | 1 | 0.11mi |
| 5445 Double Eagle Cir #3013 Ave Maria, FL | 2.0 | 2.0 | 1366 | $2,595 | $1.90 | 21d | 1 | 0.11mi |
| 5445 Double Eagle Cir #3026 Ave Maria, FL | 2.0 | 2.0 | 1569 | $2,350 | $1.50 | 21d | 1 | 0.11mi |
| 5427 Double Eagle Cir #2826 Ave Maria, FL | 2.0 | 2.0 | 1569 | $6,495 | $4.14 | 23d | 1 | 0.12mi |
| 5445 Double Eagle Cir Ave Maria, FL | 2.0 | 2.0 | 1355 | $2,995 | $2.21 | 23d | 1 | 0.12mi |
| 5427 Double Eagle Cir #2825 Ave Maria, FL | 2.0 | 2.0 | 1355 | $6,295 | $4.65 | 23d | 1 | 0.12mi |
| 5427 Double Eagle Cir #2822 Ave Maria, FL | 2.0 | 2.0 | 1355 | $5,795 | $4.28 | 23d | 1 | 0.12mi |
| 5427 Double Eagle Cir #2815 Ave Maria, FL | 2.0 | 2.0 | 1400 | $2,700 | $1.93 | 23d | 1 | 0.12mi |
| 5545 Hampton Links Ct Ave Maria, FL | 4.0 | 3.0 | 2247 | $8,500 | $3.78 | 23d | 1 | 0.13mi |
| 5667 Melbourne Ct #7812 Ave Maria, FL | 3.0 | 2.0 | 1741 | $6,250 | $3.59 | 11d | 1 | 0.13mi |
| 5661 Melbourne Ct #8011 Ave Maria, FL | 3.0 | 2.0 | 1741 | $7,295 | $4.19 | 11d | 1 | 0.14mi |
| 5651 Double Eagle Cir #4318 Ave Maria, FL | 3.0 | 2.0 | 1301 | $2,200 | $1.69 | 21d | 1 | 0.15mi |
| 5651 Double Eagle Cir Unit 1545996P Ave Maria, FL | 2.0 | 2.0 | 1280 | $2,581 | $2.02 | 13d | 1 | 0.15mi |
| 5651 Double Eagle Cir #4323 Ave Maria, FL | 2.0 | 2.0 | 1154 | $5,795 | $5.02 | 21d | 1 | 0.15mi |
| 5715 Double Eagle Cir Unit 4416 1 Ave Maria, FL | 2.0 | 2.0 | 1154 | $2,300 | $1.99 | 23d | 1 | 0.15mi |
| 5715 Double Eagle Cir Unit 4432AVE Ave Maria, FL | 2.0 | 2.0 | 1283 | $2,495 | $1.94 | 23d | 1 | 0.15mi |
| 5651 Double Eagle Cir Ave Maria, FL | 2.0 | 2.0 | 1154 | $2,495 | $2.16 | 23d | 1 | 0.16mi |
| 5555 Double Eagle Cir #3914 Ave Maria, FL | 2.0 | 2.0 | 1120 | $5,795 | $5.17 | 23d | 1 | 0.17mi |
| 5555 Double Eagle Cir #3936 Ave Maria, FL | 2.0 | 2.0 | 1154 | $2,100 | $1.82 | 13d | 1 | 0.17mi |
| 5555 Double Eagle Cir #3918 Ave Maria, FL | 3.0 | 2.0 | 1301 | $5,995 | $4.61 | 23d | 1 | 0.17mi |
| 5555 Double Eagle Cir Unit 3916 Ave Maria, FL | 2.0 | 2.0 | 1154 | $5,950 | $5.16 | 23d | 1 | 0.17mi |
| 5555 Double Eagle Cir #3913 Ave Maria, FL | 2.0 | 2.0 | 1154 | $2,100 | $1.82 | 23d | 1 | 0.17mi |
| 5674 Melbourne Ct Unit 7721 Ave Maria, FL | 3.0 | 2.0 | 2110 | $7,295 | $3.46 | 11d | 1 | 0.17mi |
| 5680 Melbourne Ct #7521 Ave Maria, FL | 3.0 | 2.0 | 2110 | $2,650 | $1.26 | 3d | 1 | 0.17mi |
| 5704 Melbourne Ct Ave Maria, FL | 3.0 | 2.0 | 1741 | $3,995 | $2.29 | 23d | 1 | 0.18mi |
| 5187 Nevola Ave Ave Maria, FL | 3.0 | 2.5 | 1680 | $2,700 | $1.61 | 21d | 1 | 0.20mi |
| 5527 Double Eagle Cir Unit 3838 Ave Maria, FL | 3.0 | 2.0 | 1301 | $2,295 | $1.76 | 23d | 1 | 0.21mi |
| 5527 Double Eagle Cir Unit 3815 Ave Maria, FL | 2.0 | 2.0 | 1120 | $5,795 | $5.17 | 23d | 1 | 0.21mi |
| 5739 Oakmont Ct Ave Maria, FL | 3.0 | 2.0 | 1710 | $3,700 | $2.16 | 23d | 1 | 0.23mi |
| 5739 Oakmont Ct #8412 Ave Maria, FL | 3.0 | 2.0 | 1741 | $7,295 | $4.19 | 23d | 1 | 0.23mi |
| 5376 Fancourt Links Way Ave Maria, FL | 2.0 | 2.5 | 1850 | $6,850 | $3.70 | 21d | 1 | 0.23mi |
| 5412 Fancourt Links Way Ave Maria, FL | 4.0 | 3.0 | 2247 | $8,000 | $3.56 | 21d | 1 | 0.23mi |
| 5715 Double Eagle Cir Ave Maria, FL | 2.0 | 2.0 | 1120 | $3,295 | $2.94 | 23d | 1 | 0.23mi |
HOA detail condo
- Monthly dues
- $846 · $10,152/yr
- Likely covers
- security
- Assessments
- None detected in remarks — confirm with the listing agent.
Listing history 14 events
-
2026-06-18days on market $319,997 Active 9 DOM
-
2026-06-17days on market $319,997 Active 8 DOM
-
2026-06-16days on market $319,997 Active 7 DOM
-
2026-06-15days on market $319,997 Active 6 DOM
-
2026-06-14days on market $319,997 Active 4 DOM
-
2026-06-10remarks 681-char remark
-
2026-06-10days on market $319,997 Active 1 DOM
-
2026-06-09days on market $319,997 Active 13 DOM
-
2026-06-08days on market $319,997 Active 12 DOM
-
2026-06-07days on market $319,997 Active 11 DOM
-
2026-06-02days on market $319,997 Active 6 DOM
-
2026-06-01days on market $319,997 Active 5 DOM
-
2026-05-31days on market $319,997 Active 4 DOM
-
2026-05-30days on market $319,997 Active 3 DOM
ⓘ Source: listings_history table (triggers on properties + properties_extension) + one-shot
backfill from property_details.listing_events for pre-trigger history.
Nearby sold comps map
Loading sold comps map…
Walkable amenities ~0.75 mi
Loading nearby amenities…
Taxation est. · year 1
- Rental income
- $52,078
- − Mortgage interest
- −$17,925
- − Property taxes
- −$4,800
- − Insurance
- −$1,600
- − Repairs & maintenance
- −$4,166
- − Management
- −$4,166
- − HOA
- −$10,152
- − Depreciation
- −$9,309
- Taxable loss
- −$40
- Est. tax savings @ 24.0%
- +$10
- After-tax cash flow
- $4,462/yr
For passive investors: Depreciation is non-cash, so a rental often shows a tax loss while cash-flowing — sheltering income. Rental losses are passive: they offset passive income freely, and up to $25,000/yr can offset ordinary (W-2) income if you actively participate and your MAGI is under $100k (phasing out to $0 by $150k); unused losses carry forward. On sale, claimed depreciation is recaptured at up to 25%, and gains may owe capital-gains tax (a 1031 exchange can defer both). Figures are a year-1 estimate at your 24.0% rate — not tax advice; consult a CPA.
Condition & rehab AI · 3 photos
This single-story attached home is in good condition with a modern kitchen and well-maintained exterior. It has the potential for minor updates to enhance its curb appeal and interior aesthetics, making it an attractive property for both resale and rental.
Value-add opportunities
- Both Painting the exterior and interior walls — Fresh paint can enhance curb appeal and interior aesthetics.
- Both Landscaping improvements — Enhanced landscaping can increase curb appeal and attract potential buyers/tenants.
- Resale Kitchen appliances replacement — Modern appliances can appeal to a broader range of buyers.
- Resale Flooring replacement — New flooring can improve the overall look and feel of the home.
Renovation cost estimate screening
Value-add ROI direction
- Both Painting the exterior and interior walls — Fresh paint can enhance curb appeal and interior aesthetics. ↑
- Both Landscaping improvements — Enhanced landscaping can increase curb appeal and attract potential buyers/tenants. ↑
- Resale Kitchen appliances replacement — Modern appliances can appeal to a broader range of buyers. ↑
- Resale Flooring replacement — New flooring can improve the overall look and feel of the home. ↑
ⓘ Cost ranges are severity-bucket heuristics (US national rule-of-thumb). Get contractor quotes + a written scope before underwriting a rehab budget.
Schools (NCES district)
- District
- Collier
- NCES district ID
- 1200330
- Math proficiency
- 60% ▼ -4.00%
- Reading proficiency
- 56% ▼ -2.00%
- Median HH income
- $58,275
- Composite
- 50.23/100
- National rank
- #1892
- State rank
- #16 of 73 in FL
Livability — Ave Maria
No livability data for this city. (Only ~50 U.S. cities are tracked.)
Census & demographics
- Census place
- Ave Maria, FL
- County
- Collier County · 396,295 people
- Metro
- Naples-Marco Island, FL
- Population (ZIP)
- 35,149
- Household income
- $62,333
- Rent vs Own
- Severe rent burden
- 1093.0
Population outlook (Collier County) Hauer SSP2
- Today (2025)
- 420,858 people
- By 2030
- 450,054 · +6.9%
- By 2040
- 502,232 · +19.3%
- By 2050
- 544,932 · +29.5%
- By 2075
- 627,203 · +49.0%
- By 2100
- 659,015 · +56.6%
Race, ethnicity, and origin ACS 2023
- Neighborhood character
- Majority Hispanic (63%)
- Race & ethnicity
- Hispanic / Latino 63% Two or more races 39% Black 19% White 16% Native American 7%
- Hispanic origin (detail)
- Mexican 43% Puerto Rican 3% Cuban 2% Dominican 1%
- Common ancestry
- Hispanic 8% Slovak 1% Serbian 1%
- Foreign-born
- 32% · Canada, Jamaica
- Languages at home
- 34% English-only · Spanish 53% French/Haitian/Cajun 12%
Political lean MEDSL · Collier
- 2024 margin
- Solid R (+33.1) · D 33.1% · R 66.2%
- 2008→2024 swing
- -10.6pp toward R · 2008: -22.5pp · 2024: -33.1pp
- All cycles
- 2024: R+33.1 2020: R+24.7 2016: R+26.0 2012: R+30.1 2008: R+22.5
Not yet ingested
- Civics
- —
Market trends
- HPI YoY
- ▼ -1.05%
- Current HPI
- 226.9105
- Rent YoY
- ▲ 2.95%
- Metro
- Naples-Marco Island, FL
- State GDP YoY
- ▲ 3.28%
- F500 in state
- 36
Industry mix (Fortune 500 HQ in FL)
| Industry | F500 HQs | Revenue |
|---|---|---|
| Industrial Technology | 2 | $29B |
|
||
| Insurance | 2 | $17B |
|
||
| Retail | 1 | $60B |
|
||
| Technology Distribution | 1 | $58B |
|
||
| Homebuilding | 1 | $35B |
|
||
| Technology Manufacturing | 1 | $35B |
|
||
Cash-flow waterfall
monthlySold comps — $/sqft
last 12 mo · ≤1 miLoading sold comps…