12717 NE 36th St · Oklahoma City, OK
Flood risk 1/10 · Minimal
- FEMA flood zone
- X (unshaded)
- Chance of flooding over 30 yrs
- 0.0%
- Est. flood insurance / yr
- $507 – $1,088
Fire risk 5/10 · Moderate
- Est. fire insurance / yr
- $2,463 – $4,575
Heat risk 6/10 · Moderate
- Hot days now (above 108°F)
- 7 days/yr
- Hot days in 30 yrs
- 19 days/yr
Wind risk 3/10 · Minor
- Chance of severe wind over 30 yrs
- 5.0%
Air-quality risk 2/10 · Minimal
- Unhealthy air days now
- 1 days/yr
- Unhealthy air days in 30 yrs
- 2 days/yr
Risk factors via First Street. Map © Google.
Why this score? — see what drove the D- grade
The composite is a weighted blend of 9 inputs, each scored 0–100. Each bar is that input's sub-score; the figure is the points it added to the 100-point composite (weight × sub-score).
- ARV discount +15.0/15.0
- Appreciation +10.0/10.0
- Cash flow +4.4/30.0
- Livability +4.0/5.0
- Rent growth +2.5/5.0
- Condition / age +2.5/5.0
- Schools +0.7/10.0
- 1% rule +0.4/10.0
- DSCR +0.0/10.0
$160,000
🖨 Deal sheet (PDF) 📄 Offer letter ✓ Due diligence
Listing remarks
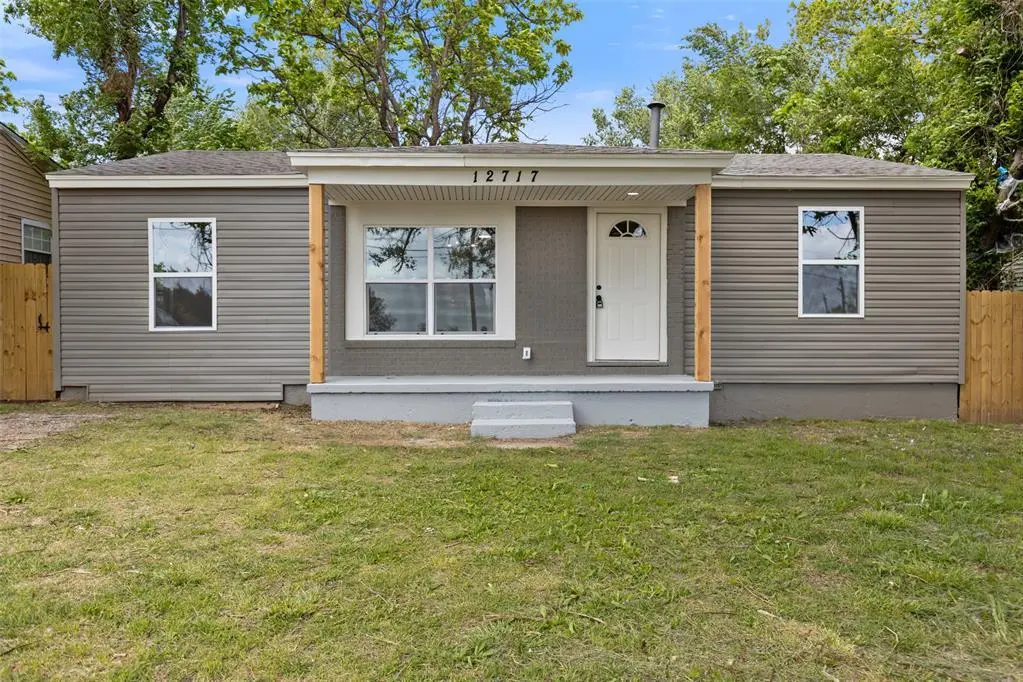
Welcome to this beautifully updated 3-bedroom, 1-bath home in Spencer, OK, offering 1,184 square feet of stylish and comfortable living space. From the moment you arrive, you’ll appreciate the fully refreshed exterior and inviting front porch—perfect for relaxing. Inside, the home features a spacious, modern kitchen with plenty of room for cooking and gathering. Large windows throughout flood the interior with natural light, creating a bright and airy feel in every room. Thoughtful updates give the home a clean, move-in-ready appeal while maintaining a warm and welcoming atmosphere. Step out back to enjoy a generously sized yard, ideal for entertaining, outdoor activities, or si
Key facts
- Large windows
- Inviting front porch
- Updated exterior
Tags
Property features AI
Finance
- Other: Located in Parker Heights addition; No storm shelter; Homestead not indicated
- Financial info: Loan qualification possible; Not assumable
- HOA & community: No mandatory association dues
Exterior
- Home design: Single family residence; One-level home; Existing property
- Construction: Frame construction; Composition roof; Conventional foundation
- Exterior features: Interior lot; No additional exterior features listed
Interior
- Bedrooms: 3 bedrooms
- Bathrooms: 1 full bathroom
- Interior features: One living area; No fireplace
Neighborhood map
What this means for you Summary
Snapshot
- This is a 2-bed/1.0-bath other listed at $160k.
Deal economics
- At list price, monthly cash flow is $-420 ($-5k/yr) — negative.
- To cash-flow at today's rent, offer at most $99k (38.0% below list).
- To meet the 1% rule (rent ≥ 1% of price), the offer needs to be $87k (45.7% below list).
- Recommended offer: $87k (45.7% below list) — sets the bar for 1% rule.
Location & tenants
- Location reads 80/100 on livability (#3 in OK, #1,635 nationally) — a professional / high-income tenant draw. Strengths: amenities A+, commute A+, cost of living A+; Watch: crime F.
- Oklahoma City (urban): math 7% / reading 10% proficiency, ranked #254 of 270 in OK (top 94%) — low school quality limits family demand, transient renter base, plan for 1-2y turnover; 82% free/reduced lunch — lower-income household profile, screen leases tightly.
- Zoned schools: Star Spencer Hs (math 5% / reading 5%, grade F, #430 of 447 statewide, top 99%, 378 students, 0% FRL) — zoned schools average 0% FRL vs 82% district-wide (82 pts lower); this property's tenant base skews higher-income than the district average.
- Market conditions: 50 active listings in the ZIP; 2 comparable units currently listed for rent nearby; 5,365 units permitted in Oklahoma County in 2024 (569 in 5+ unit buildings).
Forward outlook
- In year one you build about $17k of equity ($1k loan paydown + $16k appreciation (10.0% local appreciation)).
- Oklahoma County population projected at +41% by 2050 — long-run rental-demand tailwind backs the buy-and-hold thesis.
- By year 3, paydown + projected appreciation supports a ~$43k cash-out refi (75% LTV) — recoverable capital for the next deal without selling this one.
Negotiation context
- It's been on market 58 days — a 3% lower offer ($155k) is reasonable based on typical stale-listing flexibility.
- 2 sale attempts since 20y ago; this cycle's ask has dropped $10k (6%) from the opening price — seller is motivated, your offer sets the floor, not the list.
- Current owner paid $25k; list at $160k implies a 540% gain — meaningful room to come down on a strong offer.
Risks & watch-outs
- Watch-outs: built in 1955 — expect roof / HVAC / electrical / plumbing capex.
- Climate carrying-cost: moderate wildfire risk; extreme-heat days projected 7→19/yr by 2055 (HVAC capex compounding) — expect insurance premiums to compound above CPI over the hold.
Questions for the listing agent
- What do current leases actually rent for vs. the listed asking? Can we see a recent rent roll and the last 12 months of T-12 income?
- It's been on market 58 days. Have you received any prior offers? Is the seller open to a 46% concession, seller financing, or rate buy-down credit?
- Built in 1955 — when were the roof, HVAC, electrical panel, plumbing, and water heater last replaced?
- Is there a deadline driving the sale (1031 exchange, divorce, estate, relocation)? That informs how much negotiation room exists.
- Schools are F-rated, which usually means shorter tenancies and higher turnover. Who's the typical renter profile here, and what's been the actual vacancy rate?
- Crime grade is F in this area — have there been break-ins, vandalism, or insurance claims at this property in the last 3 years? What carrier currently insures it and at what premium?
- The area grade is low — what's the realistic commute time and amenity access for the typical tenant pool here? Any planned neighborhood developments (good or bad) we should know about?
- What's the average days-on-market for RENTAL listings here right now (not sales)? A rising rental-DOM trend means longer vacancies and softer asking-rent achievability than the comps imply.
- What's the recent tenant-quality profile in this submarket — average credit score on applications, eviction rate, late-payment / NSF rate, and stable-employment percentage? A property-management company in the area should have these aggregated.
- How much new for-sale + rental construction is in the pipeline within 1–3 miles? Heavy new supply typically softens prices + rents 12–24 months out; constrained supply supports both.
Investment metrics
- 1% rule
- 0.54% ✗
- Cap rate
- 3.14%
- Cash-on-cash
- -11.24%
- DSCR
- 0.50
- GRM
- 15.4
CMA / ARV
- ARV (median comp)
- $206,244
- List price
- $160,000
- Delta
- -22.42%
- Verdict
- UNDERPRICED
- Comps
- 19 within 1.0 mi
Projected returns pro-forma
10.0% appreciation · 3.0% rent growth · sell at horizon
- IRR
- 16.4%
- Equity multiple
- 2.35×
- Total profit
- $60,419
- Equity at exit
- $144,141
- IRR
- 15.7%
- Equity multiple
- 5.44×
- Total profit
- $198,973
- Equity at exit
- $310,845
Cash invested: $44,800 (down + closing). Projections, not guarantees.
Landlord ↔ Tenant lean methodology
- Overall (STATE)
- 83 Strongly Landlord-Friendly
- State Oklahoma
- 83 Strongly Landlord-Friendly · R+20
- County
- — inherits STATE
- City
- — inherits STATE
ZIP-level market 73084
- Home prices YoY
- 24.3%
- Active inventory
- 50
- Price-to-rent
- 15.4×
Monthly cashflow live
- Estimated rent
- $868 medium interval (Pro) →
- Mortgage (P&I)
- −$839
- Tax est. 1.5%
- −$200 /mo · $2,400/yr
- Insurance
- −$67
- HOA
- −$0
- Vacancy / Maint / Mgmt
- −$182
- Net cashflow
- $-420
Break-even live
Sensitivity live
| Price | -10% $-309 | -5% $-364 | +0% $-420 | +5% $-475 | +10% $-530 |
|---|---|---|---|---|---|
| Rent | -10% $-488 | -5% $-454 | +0% $-420 | +5% $-385 | +10% $-351 |
| Rate | -1.0pp $-339 | -0.5pp $-379 | base $-420 | +0.5pp $-461 | +1.0pp $-503 |
UW: 25.0% down · 7.5% · 30yr · 1.5% tax · 5.0% vac · 8.0% maint · 8.0% mgmt
Financing live
Cash to close
- Down payment
- $40,000
- Closing costs
- $4,800
- Reserves months
- —
- Total cash needed
- —
Loan-product check · same deal, 3 products live
Conventional
25% down · 7.5% · 30yr
- Down + closing
- —
- Monthly P&I
- —
- Monthly cashflow
- —
- DSCR
- —
- Eligible?
- —
Personal DTI + credit; lowest rate.
DSCR
20% down · 8.5% · 30yr
- Down + closing
- —
- Monthly P&I
- —
- Monthly cashflow
- —
- DSCR
- —
- Eligible?
- —
No personal income docs; deal must DSCR.
Hard money
10% down · 12.0% · 12mo
- Down + closing
- —
- Monthly P&I
- —
- Monthly cashflow
- —
- DSCR
- —
- Eligible?
- —
Short-term bridge; refi at stabilization.
Rent comps 2 comps
| Address | Beds | Baths | Sqft | Rent | $/sqft | DOM | Units | Dist |
|---|---|---|---|---|---|---|---|---|
| 4216 N Hiwassee Rd Choctaw, OK | 3.0 | 1.0 | 900 | $900 | $1.00 | 11d | 1 | 0.58mi |
| 2547 Nichols Dr Unit 1 Choctaw, OK | 1.0 | 1.0 | 725 | $780 | $1.08 | 5d | 1 | 1.29mi |
Listing history 19 events
-
2026-06-21days on market $160,000 Active 58 DOM
-
2026-06-18days on market $160,000 Active 55 DOM
-
2026-06-17days on market $160,000 Active 54 DOM
-
2026-06-16days on market $160,000 Active 53 DOM
-
2026-06-15days on market $160,000 Active 52 DOM
-
2026-06-13days on market $160,000 Active 50 DOM
-
2026-06-10price $160,000 Active 46 DOM
-
2026-06-09days on market $165,000 Active 46 DOM
-
2026-06-08days on market $165,000 Active 45 DOM
-
2026-06-07days on market $165,000 Active 44 DOM
-
2026-06-05days on market $165,000 Active 41 DOM
-
2026-06-03days on market $165,000 Active 40 DOM
-
2026-06-02days on market $165,000 Active 39 DOM
-
2026-06-01days on market $165,000 Active 38 DOM
-
2026-05-31days on market $165,000 Active 37 DOM
-
2026-04-24$169,900 Active 837-char remark
-
2006-11-17historical
-
2006-11-14$29,900
-
1985-09-01soldstatus $25,000
ⓘ Source: listings_history table (triggers on properties + properties_extension) + one-shot
backfill from property_details.listing_events for pre-trigger history.
Climate risk First Street
- Flood 1/10 Low FEMA zone X (unshaded) · 0% chance over 30 yrs
- Wildfire 5/10 Major
- Heat 6/10 Major 7 d/yr ≥108°F today · 19 d/yr by 30 yrs out
- Wind 3/10 Moderate 5% chance of damaging wind over 30 yrs
- Air quality 2/10 Low 1 unhealthy d/yr today · 2 by 30 yrs out
Nearby sold comps map
Loading sold comps map…
Walkable amenities ~0.75 mi
Loading nearby amenities…
Taxation est. · year 1
- Rental income
- $10,420
- − Mortgage interest
- −$8,962
- − Property taxes
- −$2,400
- − Insurance
- −$800
- − Repairs & maintenance
- −$834
- − Management
- −$834
- − Depreciation
- −$4,655
- Taxable loss
- −$8,064
- Est. tax savings @ 24.0%
- +$1,935
- After-tax cash flow
- $-3,102/yr
For passive investors: Depreciation is non-cash, so a rental often shows a tax loss while cash-flowing — sheltering income. Rental losses are passive: they offset passive income freely, and up to $25,000/yr can offset ordinary (W-2) income if you actively participate and your MAGI is under $100k (phasing out to $0 by $150k); unused losses carry forward. On sale, claimed depreciation is recaptured at up to 25%, and gains may owe capital-gains tax (a 1031 exchange can defer both). Figures are a year-1 estimate at your 24.0% rate — not tax advice; consult a CPA.
Schools (NCES district)
- District
- Oklahoma City
- NCES district ID
- 4022770
- Math proficiency
- 7% ▼ -5.00%
- Reading proficiency
- 10% ▼ -6.00%
- Median HH income
- $35,606
- Composite
- 7.0/100
- National rank
- #9970
- State rank
- #254 of 270 in OK
Livability — Oklahoma City
- Score
- 80/100
- State rank
- #3
- US rank
- #1635
Category grades
Schools grade is shown separately in the Schools card above.
Census & demographics
- Census place
- Oklahoma City, OK
- City population
- 498,656
- Population (ZIP)
- 6,296
Population outlook (Oklahoma County) Hauer SSP2
- Today (2025)
- 911,875 people
- By 2030
- 982,413 · +7.7%
- By 2040
- 1,130,468 · +24.0%
- By 2050
- 1,288,422 · +41.3%
- By 2075
- 1,711,482 · +87.7%
- By 2100
- 2,088,448 · +129.0%
Race, ethnicity, and origin ACS 2023
- Neighborhood character
- Diverse neighborhood (Simpson 0.64)
- Race & ethnicity
- Black 52% White 24% Hispanic / Latino 16% Two or more races 12% Native American 2%
- Hispanic origin (detail)
- Mexican 14%
- Common ancestry
- Italian 2% Lithuanian 2%
- Foreign-born
- 6% · Canada
- Languages at home
- 86% English-only · Spanish 14%
Political lean MEDSL · Oklahoma
- 2024 margin
- Toss-up / Even · D 48.0% · R 49.7% · Other 2.3%
- 2008→2024 swing
- +15.1pp toward D · 2008: -16.8pp · 2024: -1.7pp
- All cycles
- 2024: R+1.7 2020: R+1.1 2016: R+10.5 2012: R+16.7 2008: R+16.8
Not yet ingested
- Civics
- —
Market trends
- HPI YoY
- ▲ 53.65%
- Current HPI
- 274.4301
- Rent YoY
- —
- Metro
- —
- State GDP YoY
- ▲ 1.55%
- F500 in state
- 6
Industry mix (Fortune 500 HQ in OK)
| Industry | F500 HQs | Revenue |
|---|---|---|
| Energy | 3 | $48B |
|
||
Price history
+540.0% since first listed6 events — show timeline
- 2026-06-09 Price Changed $160,000 MLSOK
- 2026-05-28 Price Changed $165,000 MLSOK
- 2026-04-24 Listed $169,900 MLSOK
- 2006-11-17 Listing Removed — MLSOK
- 2006-11-14 Listed $29,900 MLSOK
- 1985-09-01 Sold (Public Records) $25,000 Public Records
Property tax history
-12.8%/yrLatest (2025): $79 · -86.8% YoY. Source: county tax records.
Cash-flow waterfall
monthlySold comps — $/sqft
last 12 mo · ≤1 miLoading sold comps…