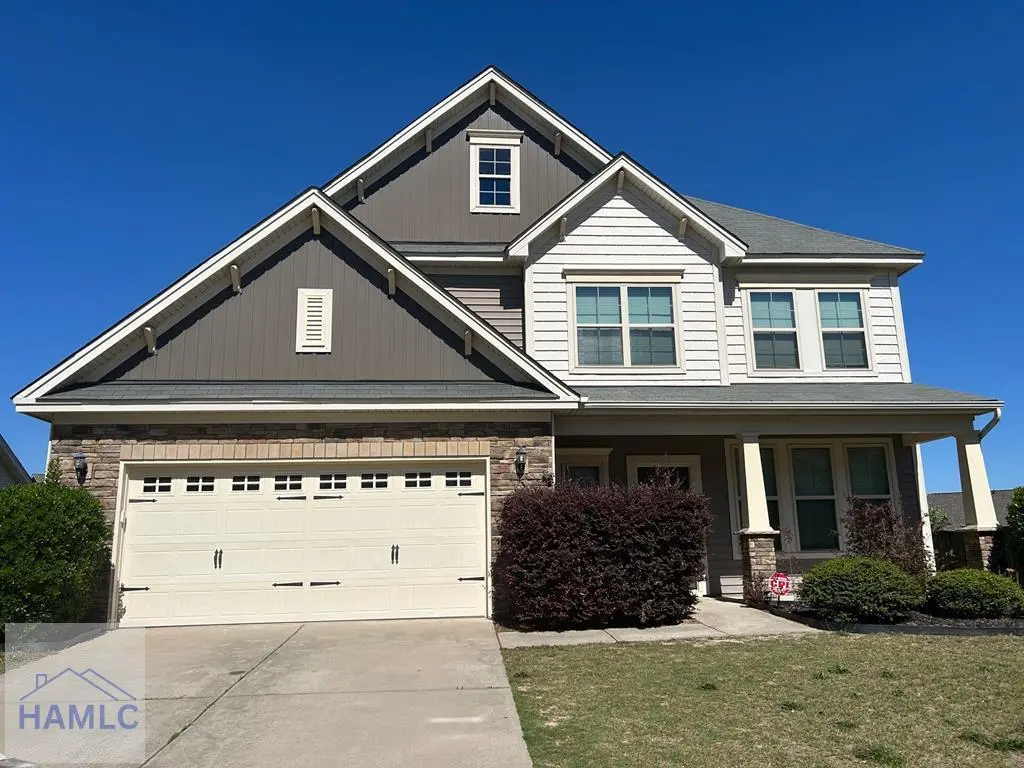
228 Jordan Springs Cir · Blythewood, SC
Flood risk 1/10 · Minimal
- FEMA flood zone
- X (unshaded)
- Chance of flooding over 30 yrs
- 0.0%
- Est. flood insurance / yr
- $507 – $1,088
Fire risk 2/10 · Minimal
- Est. fire insurance / yr
- $783 – $1,453
Heat risk 6/10 · Moderate
- Hot days now (above 107°F)
- 7 days/yr
- Hot days in 30 yrs
- 16 days/yr
Wind risk 6/10 · Moderate
- Chance of severe wind over 30 yrs
- 62.0%
Air-quality risk 3/10 · Minor
- Unhealthy air days now
- 2 days/yr
- Unhealthy air days in 30 yrs
- 3 days/yr
Risk factors via First Street. Map © Google.
Why this score? — see what drove the D grade
The composite is a weighted blend of 9 inputs, each scored 0–100. Each bar is that input's sub-score; the figure is the points it added to the 100-point composite (weight × sub-score).
- Cash flow +13.8/30.0
- ARV discount +10.7/15.0
- DSCR +4.2/10.0
- Schools +3.6/10.0
- Livability +3.5/5.0
- Rent growth +3.2/5.0
- 1% rule +3.1/10.0
- Condition / age +2.5/5.0
- Appreciation +0.0/10.0
$290,000
🖨 Deal sheet (PDF) 📄 Offer letter ✓ Due diligence
Listing remarks
Welcome Home! This motivated Seller of this beautifully well-constructed and highly maintained two-story home that is located in the highly sought-after area of Spring Park Subdivision in the Northeast area of Columbia. It's a spacious 4-bedroom 2 1/2 bath home with over 2200 square feet of comfortable living space that offers lots of flexibility with its great floorplan featuring large walk-in closets in all bedrooms. One bedroom could be used as flex room due to its large size. Primary bedroom is on the main floor. This home offers lots of versatility. You must see to appreciate the possibilities in this home. It is located near great schools, shopping areas, and more for cozy and conveni
Key facts
- Near shopping areas
- Flex room
- Near great schools
Tags
Property features AI
Finance
- HOA & community: Homeowners association with an annual fee of $230 (about $19.17/month); Subdivision: Spring Park; Community sidewalks
Exterior
- Parking: 2 total parking spaces; 2-car garage
- Security: Smoke detector(s)
- Utilities: Public water; Public sewer; Electricity available / electric on property
- Home design: Single family residence; Two levels; Residential property
- Construction: Stone and vinyl siding exterior; Shingle roof; Slab foundation; Built using traditional residential construction
- Exterior features: Landscaped yard; Privacy fencing in back yard; Irrigation equipment; Other exterior features
Interior
- Kitchen: Electric oven; Microwave; Refrigerator
- Bathrooms: 2 full bathrooms; 1 half bathroom
- Interior features: Ceiling fans; Kitchen island; Gas log fireplace in living room; Smoke detectors
- Laundry & utility: Washer hookup; Tankless water heater
Neighborhood map
What this means for you Summary
Snapshot
- This is a 4-bed/3.0-bath single-family listed at $290k.
Deal economics
- At list price, monthly cash flow is $24 ($290/yr) — positive.
- The deal already cash-flows at list — no discount required.
- To meet the 1% rule (rent ≥ 1% of price), the offer needs to be $234k (19.2% below list).
- Recommended offer: $234k (19.2% below list) — sets the bar for 1% rule.
Location & tenants
- Location reads 70/100 on livability (#58 in SC) — a middle-class / working-renter tenant base. Strengths: crime A+, employment A+, housing A+; Watch: amenities F, commute F, health & safety F.
- Richland 02 (suburban): math 35% / reading 47% proficiency, ranked #29 of 80 in SC (top 36%) — families likely to look elsewhere, expect single-tenant / working-renter base with shorter leases.
- Zoned schools: Sandlapper Elementary (math 30% / reading 34%, grade F, #369 of 597 statewide, top 64%, 656 students, 71% FRL); Longleaf Middle (math 19% / reading 41%, grade F, #136 of 229 statewide, top 60%, 802 students, 69% FRL); Westwood High (math 47% / reading 87%, grade B, #73 of 196 statewide, top 41%, 1,684 students, 66% FRL) — zoned schools average 69% FRL vs 38% district-wide (31 pts higher); higher-poverty schools than district average — tighter screening recommended.
- Market conditions: Rents rising (+2.8%/yr); 417 active listings in the ZIP; 10 comparable units currently listed for rent nearby; rentals at typical pace (median 16d on market — plan ~3-4 weeks tenant-placement turnaround); 3,472 units permitted in Richland County in 2024 (1,096 in 5+ unit buildings).
- This rent runs 38% of the median local income ($74k/yr) — at the standard rent-burdened threshold; future hikes will face affordability resistance.
Forward outlook
- Local home prices are declining (-3.0%/yr); year-one equity from $2k of loan paydown is wiped out by about $9k of value loss. Plan a longer hold.
- Richland County population projected at +30% by 2050 — long-run rental-demand tailwind backs the buy-and-hold thesis.
Negotiation context
- Only 7 days on market — expect competitive offers; lowballing is unlikely to land.
- 2 sale attempts since 2y ago with the ask held roughly flat each time — persistent listings suggest the price (not the market) is what's stuck; bring a comps-based counter.
Risks & watch-outs
- Climate carrying-cost: major wind risk, 62% chance of damaging wind over 30y; extreme-heat days projected 7→16/yr by 2055 (HVAC capex compounding) — expect insurance premiums to compound above CPI over the hold.
Questions for the listing agent
- What does the HOA fee cover, when was the last increase, and are there any pending special assessments or reserve-fund shortfalls?
- Is there a deadline driving the sale (1031 exchange, divorce, estate, relocation)? That informs how much negotiation room exists.
- Schools are B-rated — typically a magnet for longer-tenancy family renters. What's the average tenant stay here, and is there a school-zone premium baked into asking?
- The area grade is low — what's the realistic commute time and amenity access for the typical tenant pool here? Any planned neighborhood developments (good or bad) we should know about?
- What's the average days-on-market for RENTAL listings here right now (not sales)? A rising rental-DOM trend means longer vacancies and softer asking-rent achievability than the comps imply.
- What's the recent tenant-quality profile in this submarket — average credit score on applications, eviction rate, late-payment / NSF rate, and stable-employment percentage? A property-management company in the area should have these aggregated.
- How much new for-sale + rental construction is in the pipeline within 1–3 miles? Heavy new supply typically softens prices + rents 12–24 months out; constrained supply supports both.
Investment metrics
- 1% rule
- 0.81% ✗
- Cap rate
- 6.39%
- Cash-on-cash
- 0.36%
- DSCR
- 1.02
- GRM
- 10.3
CMA / ARV
- ARV (on-the-fly)
- $312,086
- Comps found
- 1
Show comp detail 1 sale within ~0.75 mi
| Address | Dist | Beds/Ba | Sqft | Sold | Price | $/sf | Match |
|---|---|---|---|---|---|---|---|
| 533 Long Pine Dr | 0.61mi | 4/2.5 | 2,448 (+8%) | 23mo | $335,000 | $137 | 38 |
Match score weights: distance 35% · size 25% · config 20% · recency 20%. Top-matched comps best support the ARV.
Projected returns pro-forma
-3.0% appreciation · 2.81% rent growth · sell at horizon
- IRR
- -16.0%
- Equity multiple
- 0.43×
- Total profit
- $-45,974
- Equity at exit
- $43,240
- IRR
- -7.9%
- Equity multiple
- 0.51×
- Total profit
- $-40,179
- Equity at exit
- $25,074
Cash invested: $81,200 (down + closing). Projections, not guarantees.
Landlord ↔ Tenant lean methodology
- Overall (STATE)
- 90 Strongly Landlord-Friendly
- State South Carolina
- 90 Strongly Landlord-Friendly · R+6
- County
- — inherits STATE
- City
- — inherits STATE
ZIP-level market 29229
- Home prices YoY
- -21.5%
- Rents YoY
- 2.8%
- Active inventory
- 417
- Price-to-rent
- 10.3×
Monthly cashflow live
- Estimated rent
- $2,343 high interval (Pro) →
- Mortgage (P&I)
- −$1,521
- Tax from tax record
- −$166 /mo · $1,992/yr
- Insurance
- −$121
- HOA
- −$19
- Vacancy / Maint / Mgmt
- −$492
- Net cashflow
- $24
Break-even live
Sensitivity live
| Price | -10% $188 | -5% $106 | +0% $24 | +5% $-58 | +10% $-140 |
|---|---|---|---|---|---|
| Rent | -10% $-161 | -5% $-68 | +0% $24 | +5% $117 | +10% $209 |
| Rate | -1.0pp $170 | -0.5pp $98 | base $24 | +0.5pp $-51 | +1.0pp $-127 |
UW: 25.0% down · 7.5% · 30yr · 1.5% tax · 5.0% vac · 8.0% maint · 8.0% mgmt
Financing live
Cash to close
- Down payment
- $72,500
- Closing costs
- $8,700
- Reserves months
- —
- Total cash needed
- —
Loan-product check · same deal, 3 products live
Conventional
25% down · 7.5% · 30yr
- Down + closing
- —
- Monthly P&I
- —
- Monthly cashflow
- —
- DSCR
- —
- Eligible?
- —
Personal DTI + credit; lowest rate.
DSCR
20% down · 8.5% · 30yr
- Down + closing
- —
- Monthly P&I
- —
- Monthly cashflow
- —
- DSCR
- —
- Eligible?
- —
No personal income docs; deal must DSCR.
Hard money
10% down · 12.0% · 12mo
- Down + closing
- —
- Monthly P&I
- —
- Monthly cashflow
- —
- DSCR
- —
- Eligible?
- —
Short-term bridge; refi at stabilization.
Rent comps 10 comps
| Address | Beds | Baths | Sqft | Rent | $/sqft | DOM | Units | Dist |
|---|---|---|---|---|---|---|---|---|
| 2108 Wilkinson Dr Columbia, SC | 4.0 | 2.5 | 2181 | $2,139 | $0.98 | 4d | 1 | 0.71mi |
| 221 Meyer Ln Columbia, SC | 4.0 | 3.5 | 2184 | $2,349 | $1.08 | 16d | 1 | 0.79mi |
| 830 Wing Stripe Ct Columbia, SC | 5.0 | 3.5 | 3044 | $2,395 | $0.79 | 5d | 1 | 0.83mi |
| 213 Sagamare Rd Columbia, SC | 4.0 | 3.0 | 1664 | $1,970 | $1.18 | 25d | 1 | 0.88mi |
| 608 Cottontail Ct N Columbia, SC | 4.0 | 2.0 | 1701 | $2,139 | $1.26 | 5d | 1 | 0.92mi |
| 429 Buttonbush Ct Columbia, SC | 4.0 | 2.5 | 2715 | $1,995 | $0.73 | 4d | 1 | 0.98mi |
| 13 Coral Ct Columbia, SC | 5.0 | 2.5 | 2424 | $2,469 | $1.02 | 25d | 1 | 1.07mi |
| 102 Petworth Dr Columbia, SC | 4.0 | 3.0 | 1664 | $2,050 | $1.23 | 4d | 1 | 1.09mi |
| 669 Pine Lilly Dr Columbia, SC | 4.0 | 2.5 | 2912 | $2,595 | $0.89 | 25d | 1 | 1.14mi |
| 5 Glendevon Ct Columbia, SC | 5.0 | 2.5 | 2050 | $2,500 | $1.22 | 25d | 1 | 1.37mi |
HOA detail
- Monthly dues
- $19 · $228/yr
Listing history 4 events
-
2026-05-22status Pending
-
2026-05-15$290,000 Active
-
2025-01-05historical $2,180
-
2024-12-27$2,180
ⓘ Source: listings_history table (triggers on properties + properties_extension) + one-shot
backfill from property_details.listing_events for pre-trigger history.
Tax reassessment forecast SC · Resets to sale price
- Current annual tax
- $1,992 · $166/mo
- Projected year-2 tax
- $1,992 · $166/mo
- Expected delta
- $0/yr ($0/mo · 0.0%)
ⓘ Screening estimate from a state-policy table — verify with the county assessor before closing.
Climate risk First Street
- Flood 1/10 Low FEMA zone X (unshaded) · 0% chance over 30 yrs
- Wildfire 2/10 Low
- Heat 6/10 Major 7 d/yr ≥107°F today · 16 d/yr by 30 yrs out
- Wind 6/10 Major 62% chance of damaging wind over 30 yrs
- Air quality 3/10 Moderate 2 unhealthy d/yr today · 3 by 30 yrs out
Nearby sold comps map
Loading sold comps map…
Walkable amenities ~0.75 mi
Loading nearby amenities…
Taxation est. · year 1
- Rental income
- $28,113
- − Mortgage interest
- −$16,245
- − Property taxes
- −$1,992
- − Insurance
- −$1,450
- − Repairs & maintenance
- −$2,249
- − Management
- −$2,249
- − HOA
- −$228
- − Depreciation
- −$8,436
- Taxable loss
- −$4,736
- Est. tax savings @ 24.0%
- +$1,137
- After-tax cash flow
- $1,427/yr
For passive investors: Depreciation is non-cash, so a rental often shows a tax loss while cash-flowing — sheltering income. Rental losses are passive: they offset passive income freely, and up to $25,000/yr can offset ordinary (W-2) income if you actively participate and your MAGI is under $100k (phasing out to $0 by $150k); unused losses carry forward. On sale, claimed depreciation is recaptured at up to 25%, and gains may owe capital-gains tax (a 1031 exchange can defer both). Figures are a year-1 estimate at your 24.0% rate — not tax advice; consult a CPA.
Schools (NCES district)
- District
- Richland 02
- NCES district ID
- 4503390
- Math proficiency
- 35% ▼ -15.00%
- Reading proficiency
- 47% ▼ -5.00%
- Median HH income
- $59,684
- Composite
- 36.2/100
- National rank
- #4730
- State rank
- #29 of 80 in SC
Livability — Blythewood
- Score
- 70/100
- State rank
- #58
- US rank
- #7406
Category grades
Schools grade is shown separately in the Schools card above.
Census & demographics
- County
- Richland County · 389,530 people
- City population
- 30,454
- Metro
- Columbia, SC
- Population (ZIP)
- 51,861
- Household income
- $74,043
- Rent vs Own
- Severe rent burden
- 1939.0
Population outlook (Richland County) Hauer SSP2
- Today (2025)
- 459,667 people
- By 2030
- 487,524 · +6.1%
- By 2040
- 542,035 · +17.9%
- By 2050
- 595,371 · +29.5%
- By 2075
- 732,998 · +59.5%
- By 2100
- 820,415 · +78.5%
Race, ethnicity, and origin ACS 2023
- Neighborhood character
- Diverse neighborhood (Simpson 0.56)
- Race & ethnicity
- Black 62% White 24% Hispanic / Latino 8% Two or more races 6% Asian 3%
- Hispanic origin (detail)
- Mexican 2% Puerto Rican 2%
- Common ancestry
- Slovak 1% Lithuanian 1% Romanian 1%
- Foreign-born
- 7% · Canada, South Korea, Jamaica
- Languages at home
- 89% English-only · Spanish 6% Other Indo-European 1% Korean 1%
Political lean MEDSL · Richland
- 2024 margin
- Solid D (+34.6) · D 66.4% · R 31.8% · Other 1.8%
- 2008→2024 swing
- +5.7pp toward D · 2008: 28.9pp · 2024: 34.6pp
- All cycles
- 2024: D+34.6 2020: D+38.3 2016: D+32.9 2012: D+33.3 2008: D+28.9
Not yet ingested
- Civics
- —
Market trends
- HPI YoY
- ▼ -51.11%
- Current HPI
- 186.782
- Rent YoY
- ▲ 2.81%
- Metro
- Columbia, SC
- State GDP YoY
- ▲ 4.51%
- F500 in state
- 2
Industry mix (Fortune 500 HQ in SC)
| Industry | F500 HQs | Revenue |
|---|---|---|
| Packaging | 1 | $7B |
|
||
Price history
+13202.8% since first listed4 events — show timeline
- 2026-05-22 Pending — HABR
- 2026-05-15 Listed $290,000 HABR
- 2025-01-05 Rental Removed $2,180 SHOWMOJO
- 2024-12-27 Listed for Rent $2,180 SHOWMOJO
Property tax history
+1.2%/yrLatest (2025): $1,992 · +3.6% YoY. Source: county tax records.
Cash-flow waterfall
monthlySold comps — $/sqft
last 12 mo · ≤1 miLoading sold comps…