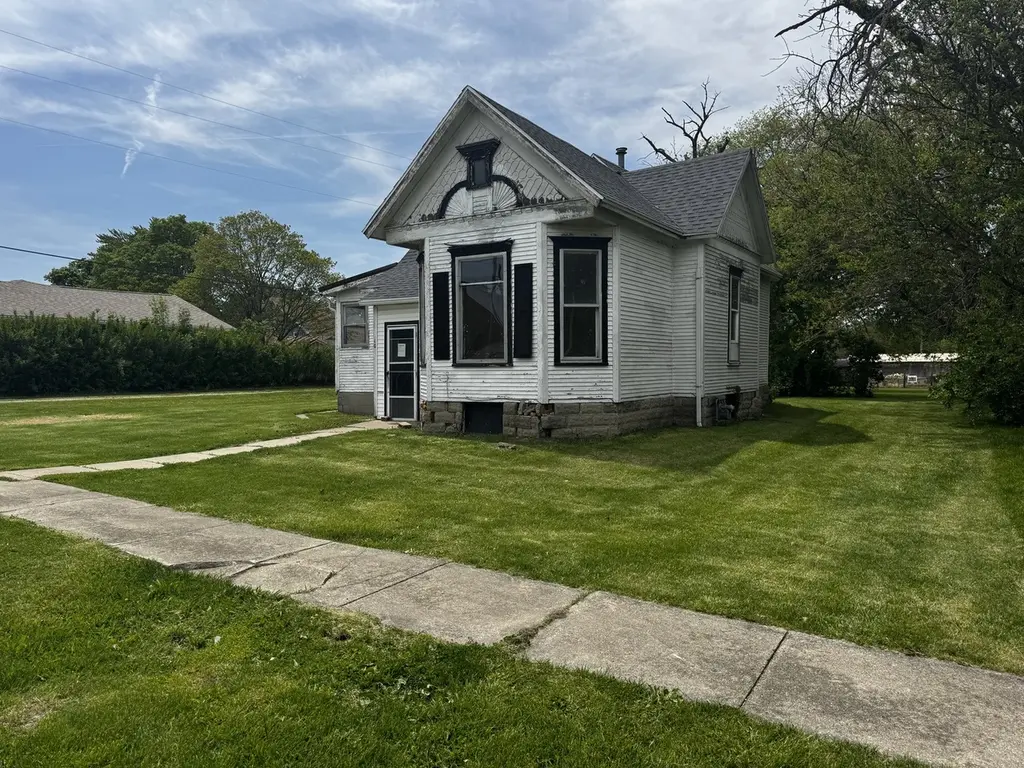
10 N 3rd St · Chatsworth, IL
Flood risk 1/10 · Minimal
- FEMA flood zone
- X (unshaded)
- Chance of flooding over 30 yrs
- 0.0%
- Est. flood insurance / yr
- $507 – $1,088
Fire risk 1/10 · Minimal
- Est. fire insurance / yr
- $804 – $1,492
Heat risk 3/10 · Minor
- Hot days now (above 104°F)
- 7 days/yr
- Hot days in 30 yrs
- 17 days/yr
Wind risk 2/10 · Minimal
- Chance of severe wind over 30 yrs
- 1.0%
Air-quality risk 2/10 · Minimal
- Unhealthy air days now
- 1 days/yr
- Unhealthy air days in 30 yrs
- 1 days/yr
Risk factors via First Street. Map © Google.
Why this score? — see what drove the B+ grade
The composite is a weighted blend of 9 inputs, each scored 0–100. Each bar is that input's sub-score; the figure is the points it added to the 100-point composite (weight × sub-score).
- Cash flow +30.0/30.0
- 1% rule +10.0/10.0
- DSCR +10.0/10.0
- Appreciation +10.0/10.0
- ARV discount +7.5/15.0
- Livability +3.2/5.0
- Schools +2.8/10.0
- Rent growth +2.5/5.0
- Condition / age +2.5/5.0
$19,000
🖨 Deal sheet 📄 Offer letter ✓ Due diligence
Listing remarks
Looking for a project house to tackle? Look no further than right here! Double lot with a 2 bedroom 1 bath property ready for rehab & innovation! No rent to own or owner financing available. Only cash buyers, will not qualify for any traditional financing.
Key facts
- Ready for rehab
- Project house
- Double lot
Tags
Property features AI
Finance
- Other: Parcel number 272703161007
- HOA & community: No master association fee required
Exterior
- Parking: Detached garage (garage owned); Gravel parking; Total parking for 1 vehicle; 1 garage space
- Utilities: Public water; Public sewer
- Home design: Detached single-family home; One-story; Fee simple ownership; Property over 100 years old; Built before 1978
- Construction: Wood siding; Asphalt roof; Approx. 1,149 total finished area
- Exterior features: 75 x 100 lot; Lot about 0.25–0.49 acre; County-recorded lot dimensions
Interior
- Kitchen: Kitchen (main level) — 12 x 15; Range; Refrigerator
- Bedrooms: Master bedroom (main level) — 15 x 15; Additional bedroom (main level) — 10 x 10; Two other bedrooms
- Bathrooms: 1 full bathroom
- Heating & cooling: Natural gas forced-air heating
- Interior features: Unfinished partial cellar basement; 5 total rooms
- Laundry & utility: Main-level laundry room — 8 x 8; Washer; Dryer
Neighborhood map
What this means for you Summary
Snapshot
- This is a 2-bed/1.0-bath single-family listed at $19k.
Deal economics
- At list price, monthly cash flow is $463 ($6k/yr) — positive.
- The deal already cash-flows at list — no discount required.
- Meets the 1% rule at list price ($752 rent vs $19k).
Location & tenants
- Location reads 63/100 on livability (#784 in IL) — a middle-class / working-renter tenant base. Strengths: crime A+, cost of living A+, housing A+; Watch: employment D+, amenities F, commute F.
- Prairie Central CUSD 8 (rural): math 32% / reading 32% proficiency, ranked #223 of 620 in IL (top 36%) — families likely to look elsewhere, expect single-tenant / working-renter base with shorter leases.
- Zoned schools: Prairie Central Jr High School (math 33% / reading 35%, grade F, #209 of 665 statewide, top 32%, 228 students, 0% FRL); Prairie Central High School (math 22% / reading 22%, grade F, #319 of 693 statewide, top 50%, 516 students, 0% FRL) — zoned schools average 0% FRL vs 36% district-wide (36 pts lower); this property's tenant base skews higher-income than the district average.
- Market conditions: 10 active listings in the ZIP; 3 comparable units currently listed for rent nearby; rentals at typical pace (median 21d on market — plan ~3-4 weeks tenant-placement turnaround); 35 units permitted in Livingston County in 2024 (0 in 5+ unit buildings).
Forward outlook
- In year one you build about $2k of equity ($131 loan paydown + $2k appreciation (10.0% local appreciation)).
- Livingston County population projected at -27% by 2050 — secular population decline; favor cash flow + early exit over multi-decade hold.
- At projected returns (10.0% appreciation + 3.0% rent growth), your $5k cash investment doubles in ~1 year — after that, you're playing with house money.
Negotiation context
- Only 2 days on market — expect competitive offers; lowballing is unlikely to land.
- Current owner paid $8k; list at $19k implies a 153% gain — meaningful room to come down on a strong offer.
Risks & watch-outs
- Watch-outs: built in 1890 — expect roof / HVAC / electrical / plumbing capex.
Questions for the listing agent
- Built in 1890 — when were the roof, HVAC, electrical panel, plumbing, and water heater last replaced?
- Is there a deadline driving the sale (1031 exchange, divorce, estate, relocation)? That informs how much negotiation room exists.
- Schools are F-rated, which usually means shorter tenancies and higher turnover. Who's the typical renter profile here, and what's been the actual vacancy rate?
- What's the average days-on-market for RENTAL listings here right now (not sales)? A rising rental-DOM trend means longer vacancies and softer asking-rent achievability than the comps imply.
- What's the recent tenant-quality profile in this submarket — average credit score on applications, eviction rate, late-payment / NSF rate, and stable-employment percentage? A property-management company in the area should have these aggregated.
- How much new for-sale + rental construction is in the pipeline within 1–3 miles? Heavy new supply typically softens prices + rents 12–24 months out; constrained supply supports both.
Investment metrics
- 1% rule
- 3.96% ✓
- Cap rate
- 35.51%
- Cash-on-cash
- 104.35%
- DSCR
- 5.64
- GRM
- 2.1
CMA / ARV
- ARV (on-the-fly)
- $84,788
- Comps found
- 2
Show comp detail 2 sales within ~0.75 mi
| Address | Dist | Beds/Ba | Sqft | Sold | Price | $/sf | Match |
|---|---|---|---|---|---|---|---|
| 206 E Oak St | 0.24mi | 2/1.0 | 832 (-8%) | 3mo | $77,900 | $94 | 74 |
| 104 N 7th St | 0.34mi | 2/2.0 | 994 (+10%) | 20mo | $80,000 | $80 | 46 |
Match score weights: distance 35% · size 25% · config 20% · recency 20%. Top-matched comps best support the ARV.
Projected returns pro-forma
10.0% appreciation · 3.0% rent growth · sell at horizon
- IRR
- —
- Equity multiple
- 8.49×
- Total profit
- $39,825
- Equity at exit
- $17,117
- IRR
- —
- Equity multiple
- 18.69×
- Total profit
- $94,128
- Equity at exit
- $36,913
Cash invested: $5,320 (down + closing). Projections, not guarantees.
Landlord ↔ Tenant lean methodology
- Overall (STATE)
- 43 Moderately Tenant-Leaning
- State Illinois
- 43 Moderately Tenant-Leaning · D+7
- County
- — inherits STATE
- City
- — inherits STATE
ZIP-level market 60921
- Home prices YoY
- 6.7%
- Active inventory
- 10
- Price-to-rent
- 2.1×
Monthly cashflow live
- Estimated rent
- $752 medium interval (Pro) →
- Mortgage (P&I)
- −$100
- Tax est. 1.5%
- −$24 /mo · $285/yr
- Insurance
- −$8
- HOA
- −$0
- Vacancy / Maint / Mgmt
- −$158
- Net cashflow
- $463
Break-even live
UW: 25.0% down · 7.5% · 30yr · 1.5% tax · 5.0% vac · 8.0% maint · 8.0% mgmt
Financing live
Cash to close
- Down payment
- $4,750
- Closing costs
- $570
- Reserves months
- —
- Total cash needed
- —
Loan-product check · same deal, 3 products live
Conventional
25% down · 7.5% · 30yr
- Down + closing
- —
- Monthly P&I
- —
- Monthly cashflow
- —
- DSCR
- —
- Eligible?
- —
Personal DTI + credit; lowest rate.
DSCR
20% down · 8.5% · 30yr
- Down + closing
- —
- Monthly P&I
- —
- Monthly cashflow
- —
- DSCR
- —
- Eligible?
- —
No personal income docs; deal must DSCR.
Hard money
10% down · 12.0% · 12mo
- Down + closing
- —
- Monthly P&I
- —
- Monthly cashflow
- —
- DSCR
- —
- Eligible?
- —
Short-term bridge; refi at stabilization.
Rent comps 3 comps
| Address | Beds | Baths | Sqft | Rent | $/sqft | DOM | Units | Dist |
|---|---|---|---|---|---|---|---|---|
| 404 E Maple St Apt 31 Chatsworth, IL | 1.0 | 1.0 | 572 | $700 | $1.22 | 20d | 1 | 0.14mi |
| 1 Reni Ct Unit 2 Chatsworth, IL | 2.0 | 1.0 | 800 | $800 | $1.00 | 43d | 1 | 0.37mi |
| 1 Reni Ct Unit 1 Chatsworth, IL | 2.0 | 1.0 | 800 | $800 | $1.00 | 13d | 1 | 0.37mi |
Listing history 3 events
-
2026-05-15status Pending
-
2026-05-12$19,000 Active
-
1987-09-17soldstatus $7,500
ⓘ Source: listings_history table (triggers on properties + properties_extension) + one-shot
backfill from property_details.listing_events for pre-trigger history.
Climate risk First Street
- Flood 1/10 Low FEMA zone X (unshaded) · 0% chance over 30 yrs
- Wildfire 1/10 Low
- Heat 3/10 Moderate 7 d/yr ≥104°F today · 17 d/yr by 30 yrs out
- Wind 2/10 Low 100% chance of damaging wind over 30 yrs
- Air quality 2/10 Low 1 unhealthy d/yr today · 1 by 30 yrs out
Nearby sold comps map
Loading sold comps map…
Walkable amenities ~0.75 mi
Loading nearby amenities…
Taxation est. · year 1
- Rental income
- $9,022
- − Mortgage interest
- −$1,064
- − Property taxes
- −$285
- − Insurance
- −$95
- − Repairs & maintenance
- −$722
- − Management
- −$722
- − Depreciation
- −$553
- Taxable income
- $5,581
- Est. tax owed @ 24.0%
- −$1,340
- After-tax cash flow
- $4,212/yr
For passive investors: Depreciation is non-cash, so a rental often shows a tax loss while cash-flowing — sheltering income. Rental losses are passive: they offset passive income freely, and up to $25,000/yr can offset ordinary (W-2) income if you actively participate and your MAGI is under $100k (phasing out to $0 by $150k); unused losses carry forward. On sale, claimed depreciation is recaptured at up to 25%, and gains may owe capital-gains tax (a 1031 exchange can defer both). Figures are a year-1 estimate at your 24.0% rate — not tax advice; consult a CPA.
Schools (NCES district)
- District
- Prairie Central CUSD 8
- NCES district ID
- 1700005
- Math proficiency
- 32% ▼ -6.00%
- Reading proficiency
- 32% ▼ -16.00%
- Median HH income
- $52,909
- Composite
- 28.15/100
- National rank
- #6814
- State rank
- #223 of 620 in IL
Livability — Chatsworth
- Score
- 63/100
- State rank
- #784
- US rank
- #15658
Category grades
Schools grade is shown separately in the Schools card above.
Census & demographics
- Census place
- Chatsworth, IL
- Population (ZIP)
- 1,394
Population outlook (Livingston County) Hauer SSP2
- Today (2025)
- 32,749 people
- By 2030
- 30,848 · -5.8%
- By 2040
- 27,357 · -16.5%
- By 2050
- 24,048 · -26.6%
- By 2075
- 17,574 · -46.3%
- By 2100
- 12,096 · -63.1%
Race, ethnicity, and origin ACS 2023
- Neighborhood character
- Predominantly White (84%)
- Race & ethnicity
- White 84% Hispanic / Latino 12% Two or more races 9% Asian 2%
- Hispanic origin (detail)
- Mexican 11%
- Common ancestry
- Lithuanian 3% Romanian 2% Iranian 2%
- Foreign-born
- 3% · Canada
- Languages at home
- 96% English-only · Spanish 2% Tagalog/Filipino 2%
Political lean MEDSL · Livingston
- 2024 margin
- Solid R (+46.3) · D 26.1% · R 72.4% · Other 1.6%
- 2008→2024 swing
- -27.1pp toward R · 2008: -19.2pp · 2024: -46.3pp
- All cycles
- 2024: R+46.3 2020: R+44.2 2016: R+41.0 2012: R+31.5 2008: R+19.2
Not yet ingested
- Civics
- —
Market trends
- HPI YoY
- ▲ 15.93%
- Current HPI
- 252.3354
- Rent YoY
- —
- Metro
- —
- State GDP YoY
- ▲ 1.59%
- F500 in state
- 60
Industry mix (Fortune 500 HQ in IL)
| Industry | F500 HQs | Revenue |
|---|---|---|
| Insurance | 4 | $201B |
|
||
| Consumer Goods | 4 | $87B |
|
||
| Industrial Machinery | 3 | $64B |
|
||
| Healthcare | 2 | $55B |
|
||
| Retail / Pharmacy | 1 | $148B |
|
||
| Agriculture / Food | 1 | $86B |
|
||
Price history
+153.3% since first listed3 events — show timeline
- 2026-05-15 Pending — MRED as Distributed by MLS Grid
- 2026-05-12 Listed $19,000 MRED as Distributed by MLS Grid
- 1987-09-17 Sold (Public Records) $7,500 Public Records
Property tax history
+5.3%/yrLatest (2024): $1,242 · +6.2% YoY. Source: county tax records.
Cash-flow waterfall
monthlySold comps — $/sqft
last 12 mo · ≤1 miLoading sold comps…