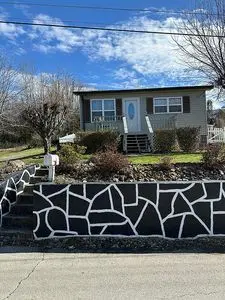
322 Leonard St · Greeneville, TN
Flood risk 1/10 · Minimal
- FEMA flood zone
- X (unshaded)
- Chance of flooding over 30 yrs
- 0.0%
- Est. flood insurance / yr
- $507 – $1,088
Fire risk 3/10 · Minor
- Est. fire insurance / yr
- $949 – $1,763
Heat risk 4/10 · Minor
- Hot days now (above 101°F)
- 7 days/yr
- Hot days in 30 yrs
- 19 days/yr
Wind risk 2/10 · Minimal
- Chance of severe wind over 30 yrs
- —
Air-quality risk 2/10 · Minimal
- Unhealthy air days now
- 1 days/yr
- Unhealthy air days in 30 yrs
- 1 days/yr
Risk factors via First Street. Map © Google.
Why this score? — see what drove the F grade
The composite is a weighted blend of 9 inputs, each scored 0–100. Each bar is that input's sub-score; the figure is the points it added to the 100-point composite (weight × sub-score).
- Cash flow +14.8/30.0
- DSCR +4.5/10.0
- Livability +3.3/5.0
- 1% rule +2.9/10.0
- Schools +2.7/10.0
- Rent growth +2.5/5.0
- Condition / age +2.5/5.0
- ARV discount +0.0/15.0
- Appreciation +0.0/10.0
$170,000
🖨 Deal sheet 📄 Offer letter ✓ Due diligence
Listing remarks
Welcome to this beautifully renovated home that offers comfort, space, and abundant natural light throughout. The exterior was completely refreshed in 2024, giving the property a clean, modern look and excellent curb appeal. Inside, you & acirc; & euro; & trade; ll find a bright and inviting open living area featuring large windows that fill the home with natural light, creating a warm and welcoming atmosphere. The spacious kitchen was remodeled in 2019 and offers ample cabinet storage, modern appliances, and plenty of room for cooking, dining, and entertaining. The home features a spacious primary suite designed for comfort and convenience. The primary bedroom includes a privat
Key facts
- Renovated home
- Spacious kitchen
- Primary suite
Tags
Neighborhood map
What this means for you Summary
Snapshot
- This is a 3-bed/2.0-bath single-family listed at $170k.
Deal economics
- At list price, monthly cash flow is $47 ($565/yr) — positive.
- The deal already cash-flows at list — no discount required.
- To meet the 1% rule (rent ≥ 1% of price), the offer needs to be $134k (21.0% below list).
- Recommended offer: $134k (21.0% below list) — sets the bar for 1% rule.
- Cap rate 6.6% vs local median 2.7% in Greeneville — top-decile yield for the area; either an underpriced asset or a hidden risk that comps aren't pricing in. Stress-test before assuming the spread holds.
Location & tenants
- Location reads 66/100 on livability (#125 in TN) — a middle-class / working-renter tenant base. Strengths: cost of living A+, housing A+, health & safety A+; Watch: schools D-, amenities F, commute F.
- Greeneville (town): math 31% / reading 34% proficiency, ranked #45 of 139 in TN (top 32%) — families likely to look elsewhere, expect single-tenant / working-renter base with shorter leases.
- Market conditions: 224 active listings in the ZIP; 333 units permitted in Greene County in 2024 (72 in 5+ unit buildings).
Forward outlook
- Local home prices are declining (-3.0%/yr); year-one equity from $1k of loan paydown is wiped out by about $5k of value loss. Plan a longer hold.
- Greene County population projected to shrink 8% by 2050 — rents likely to lag national; underwrite the cash flow, not the appreciation.
Negotiation context
- It's been on market 24 days — a 2% lower offer ($167k) is reasonable based on typical stale-listing flexibility.
- Current owner paid $22k; list at $170k implies a 673% gain — meaningful room to come down on a strong offer.
Questions for the listing agent
- Is there a deadline driving the sale (1031 exchange, divorce, estate, relocation)? That informs how much negotiation room exists.
- Schools are D-rated, which usually means shorter tenancies and higher turnover. Who's the typical renter profile here, and what's been the actual vacancy rate?
- The area grade is low — what's the realistic commute time and amenity access for the typical tenant pool here? Any planned neighborhood developments (good or bad) we should know about?
- What's the average days-on-market for RENTAL listings here right now (not sales)? A rising rental-DOM trend means longer vacancies and softer asking-rent achievability than the comps imply.
- What's the recent tenant-quality profile in this submarket — average credit score on applications, eviction rate, late-payment / NSF rate, and stable-employment percentage? A property-management company in the area should have these aggregated.
- How much new for-sale + rental construction is in the pipeline within 1–3 miles? Heavy new supply typically softens prices + rents 12–24 months out; constrained supply supports both.
Investment metrics
- 1% rule
- 0.79% ✗
- Cap rate
- 6.63%
- Cash-on-cash
- 1.19%
- DSCR
- 1.05
- GRM
- 10.5
CMA / ARV
- ARV (on-the-fly)
- $144,144
- Comps found
- 12
Show comp detail 12 sales within ~0.75 mi
| Address | Dist | Beds/Ba | Sqft | Sold | Price | $/sf | Match |
|---|---|---|---|---|---|---|---|
| 320 Highland Ave | 0.06mi | 3/1.0 | 903 (-4%) | 6mo | $55,000 | $61 | 82 |
| 304 Highland Ave | 0.09mi | 2/1.0 (-1) | 905 (-3%) | 2mo | $62,000 | $69 | 80 |
| 333 Loretta St | 0.12mi | 2/2.0 (-1) | 1,053 (+12%) | 2mo | $85,000 | $81 | 67 |
| 330 Church St | 0.68mi | 3/2.0 | 860 (-8%) | 3mo | $210,000 | $244 | 53 |
| 700 Church St | 0.34mi | 2/2.0 (-1) | 872 (-7%) | 21mo | $168,750 | $194 | 50 |
| 118 Curtis St | 0.65mi | 3/1.0 | 936 (0%) | 20mo | $100,000 | $107 | 49 |
| 408 Oak Grove Ave | 0.49mi | 2/1.0 (-1) | 1,045 (+12%) | 0mo | $260,000 | $249 | 48 |
| 718 Main St | 0.63mi | 2/1.0 (-1) | 988 (+6%) | 6mo | $165,000 | $167 | 48 |
| 327 Floral St | 0.67mi | 3/1.0 | 924 (-1%) | 20mo | $35,000 | $38 | 46 |
| 107 Cress Aly | 0.54mi | 3/2.0 | 1,000 (+7%) | 22mo | $154,000 | $154 | 46 |
| 512 N North Hill St St | 0.26mi | 2/1.0 (-1) | 846 (-10%) | 24mo | $60,000 | $71 | 43 |
| 122 Housley Ave | 0.74mi | 2/1.0 (-1) | 918 (-2%) | 17mo | $181,000 | $197 | 39 |
Match score weights: distance 35% · size 25% · config 20% · recency 20%. Top-matched comps best support the ARV.
Projected returns pro-forma
-3.0% appreciation · 3.0% rent growth · sell at horizon
- IRR
- -14.5%
- Equity multiple
- 0.48×
- Total profit
- $-24,629
- Equity at exit
- $25,348
- IRR
- -5.8%
- Equity multiple
- 0.62×
- Total profit
- $-17,907
- Equity at exit
- $14,698
Cash invested: $47,600 (down + closing). Projections, not guarantees.
Landlord ↔ Tenant lean methodology
- Overall (STATE)
- 87 Strongly Landlord-Friendly
- State Tennessee
- 87 Strongly Landlord-Friendly · R+13
- County
- — inherits STATE
- City
- — inherits STATE
ZIP-level market 37745
- Home prices YoY
- -6.0%
- Active inventory
- 224
- Price-to-rent
- 10.5×
Monthly cashflow live
- Estimated rent
- $1,343 medium interval (Pro) →
- Mortgage (P&I)
- −$891
- Tax from tax record
- −$52 /mo · $618/yr
- Insurance
- −$71
- HOA
- −$0
- Vacancy / Maint / Mgmt
- −$282
- Net cashflow
- $47
Break-even live
UW: 25.0% down · 7.5% · 30yr · 1.5% tax · 5.0% vac · 8.0% maint · 8.0% mgmt
Financing live
Cash to close
- Down payment
- $42,500
- Closing costs
- $5,100
- Reserves months
- —
- Total cash needed
- —
Loan-product check · same deal, 3 products live
Conventional
25% down · 7.5% · 30yr
- Down + closing
- —
- Monthly P&I
- —
- Monthly cashflow
- —
- DSCR
- —
- Eligible?
- —
Personal DTI + credit; lowest rate.
DSCR
20% down · 8.5% · 30yr
- Down + closing
- —
- Monthly P&I
- —
- Monthly cashflow
- —
- DSCR
- —
- Eligible?
- —
No personal income docs; deal must DSCR.
Hard money
10% down · 12.0% · 12mo
- Down + closing
- —
- Monthly P&I
- —
- Monthly cashflow
- —
- DSCR
- —
- Eligible?
- —
Short-term bridge; refi at stabilization.
Listing history 19 events
-
2026-06-19days on market $170,000 Active 24 DOM
-
2026-06-18days on market $170,000 Active 23 DOM
-
2026-06-17days on market $170,000 Active 22 DOM
-
2026-06-16days on market $170,000 Active 21 DOM
-
2026-06-15days on market $170,000 Active 20 DOM
-
2026-06-14days on market $170,000 Active 18 DOM
-
2026-06-12days on market $170,000 Active 17 DOM
-
2026-06-09days on market $170,000 Active 14 DOM
-
2026-06-08days on market $170,000 Active 13 DOM
-
2026-06-07days on market $170,000 Active 12 DOM
-
2026-06-03days on market $170,000 Active 8 DOM
-
2026-06-02days on market $170,000 Active 7 DOM
-
2026-06-01days on market $170,000 Active 6 DOM
-
2026-05-31days on market $170,000 Active 5 DOM
-
2026-05-30days on market $170,000 Active 4 DOM
-
2026-05-26$170,000 Active
-
2003-06-24soldstatus $22,000
-
2001-06-11soldstatus $19,000
-
1990-06-01soldstatus $9,500
ⓘ Source: listings_history table (triggers on properties + properties_extension) + one-shot
backfill from property_details.listing_events for pre-trigger history.
Tax reassessment forecast TN · Resets to sale price
- Current annual tax
- $618 · $52/mo
- Projected year-2 tax
- $1,207 · $101/mo
- Expected delta
- +$589/yr (+$49/mo · 95.3%)
ⓘ Screening estimate from a state-policy table — verify with the county assessor before closing.
Climate risk First Street
- Flood 1/10 Low FEMA zone X (unshaded) · 0% chance over 30 yrs
- Wildfire 3/10 Moderate
- Heat 4/10 Moderate 7 d/yr ≥101°F today · 19 d/yr by 30 yrs out
- Wind 2/10 Low
- Air quality 2/10 Low 1 unhealthy d/yr today · 1 by 30 yrs out
Nearby sold comps map
Loading sold comps map…
Walkable amenities ~0.75 mi
Loading nearby amenities…
Taxation est. · year 1
- Rental income
- $16,115
- − Mortgage interest
- −$9,523
- − Property taxes
- −$618
- − Insurance
- −$850
- − Repairs & maintenance
- −$1,289
- − Management
- −$1,289
- − Depreciation
- −$4,945
- Taxable loss
- −$2,400
- Est. tax savings @ 24.0%
- +$576
- After-tax cash flow
- $1,141/yr
For passive investors: Depreciation is non-cash, so a rental often shows a tax loss while cash-flowing — sheltering income. Rental losses are passive: they offset passive income freely, and up to $25,000/yr can offset ordinary (W-2) income if you actively participate and your MAGI is under $100k (phasing out to $0 by $150k); unused losses carry forward. On sale, claimed depreciation is recaptured at up to 25%, and gains may owe capital-gains tax (a 1031 exchange can defer both). Figures are a year-1 estimate at your 24.0% rate — not tax advice; consult a CPA.
Schools (NCES district)
- District
- Greeneville
- NCES district ID
- 4701500
- Math proficiency
- 31% ▼ -15.00%
- Reading proficiency
- 34% ▼ -7.00%
- Median HH income
- $32,683
- Composite
- 26.62/100
- National rank
- #7176
- State rank
- #45 of 139 in TN
Livability — Greeneville
- Score
- 66/100
- State rank
- #125
- US rank
- #11825
Category grades
Schools grade is shown separately in the Schools card above.
Census & demographics
- Census place
- Greeneville, TN
- County
- Greene County · 45,638 people
- City population
- 45,638
- Metro
- Greeneville, TN
- Population (ZIP)
- 21,090
- Household income
- $57,159
- Rent vs Own
- Severe rent burden
- 359.0
Population outlook (Greene County) Hauer SSP2
- Today (2025)
- 68,624 people
- By 2030
- 68,114 · -0.7%
- By 2040
- 66,167 · -3.6%
- By 2050
- 63,038 · -8.1%
- By 2075
- 55,274 · -19.5%
- By 2100
- 45,527 · -33.7%
Race, ethnicity, and origin ACS 2023
- Neighborhood character
- Predominantly White (86%)
- Race & ethnicity
- White 86% Hispanic / Latino 8% Two or more races 5% Black 4%
- Hispanic origin (detail)
- Mexican 6%
- Common ancestry
- Slovak 2% Serbian 2% Romanian 1%
- Foreign-born
- 2% · Canada
- Languages at home
- 94% English-only · Spanish 4% Chinese 1%
Political lean MEDSL · Greene
- 2024 margin
- Solid R (+65.7) · D 16.6% · R 82.3% · Other 1.2%
- 2008→2024 swing
- -25.0pp toward R · 2008: -40.7pp · 2024: -65.7pp
- All cycles
- 2024: R+65.7 2020: R+60.7 2016: R+61.0 2012: R+46.0 2008: R+40.7
Not yet ingested
- Civics
- —
Market trends
- HPI YoY
- ▼ -18.99%
- Current HPI
- 295.4621
- Rent YoY
- —
- Metro
- Greeneville, TN
- State GDP YoY
- ▲ 2.78%
- F500 in state
- 22
Industry mix (Fortune 500 HQ in TN)
| Industry | F500 HQs | Revenue |
|---|---|---|
| Healthcare | 3 | $91B |
|
||
| Retail | 3 | $72B |
|
||
| Transportation / Logistics | 1 | $88B |
|
||
| Paper / Packaging | 1 | $19B |
|
||
| Insurance | 1 | $13B |
|
||
| Energy | 1 | $12B |
|
||
Price history
+1689.5% since first listed4 events — show timeline
- 2026-05-26 Listed $170,000 FSBO.com
- 2003-06-24 Sold (Public Records) $22,000 Public Records
- 2001-06-11 Sold (Public Records) $19,000 Public Records
- 1990-06-01 Sold (Public Records) $9,500 Public Records
Property tax history
+3.1%/yrLatest (2025): $618 · +0.0% YoY. Source: county tax records.
Cash-flow waterfall
monthlySold comps — $/sqft
last 12 mo · ≤1 miLoading sold comps…