 🏷️ Likely Rental
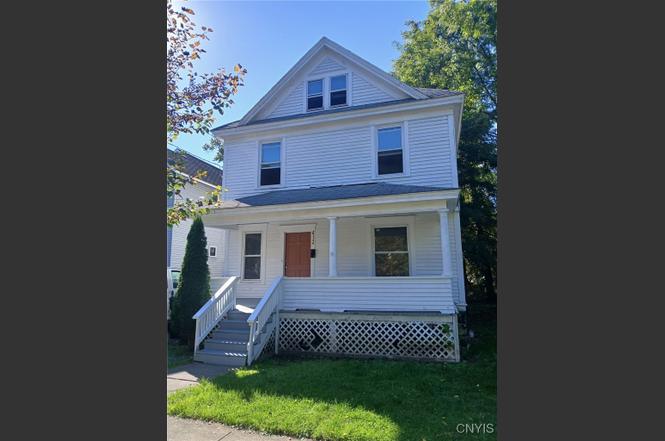
412 Rich St · Syracuse, NY
Flood risk 9/10 · Severe
- FEMA flood zone
- AE
- Chance of flooding over 30 yrs
- 0.99%
- Est. flood insurance / yr
- $2,026 – $9,024
Fire risk 1/10 · Minimal
- Est. fire insurance / yr
- $691 – $1,283
Heat risk 3/10 · Minor
- Hot days now (above 95°F)
- 7 days/yr
- Hot days in 30 yrs
- 16 days/yr
Wind risk 1/10 · Minimal
- Chance of severe wind over 30 yrs
- 1.0%
Air-quality risk 2/10 · Minimal
- Unhealthy air days now
- 0 days/yr
- Unhealthy air days in 30 yrs
- 1 days/yr
Risk factors via First Street. Map © Google.
Why this score? — see what drove the B+ grade
The composite is a weighted blend of 9 inputs, each scored 0–100. Each bar is that input's sub-score; the figure is the points it added to the 100-point composite (weight × sub-score).
- Cash flow +30.0/30.0
- ARV discount +15.0/15.0
- 1% rule +10.0/10.0
- DSCR +10.0/10.0
- Livability +3.9/5.0
- Rent growth +2.5/5.0
- Condition / age +2.5/5.0
- Schools +1.8/10.0
- Appreciation +0.0/10.0
$99,000
🖨 Deal sheet (PDF) 📄 Offer letter ✓ Due diligence
Listing remarks MLS
Well-maintained, spacious 3 bed, 1 1/2 bath house located on the cities Southside, that is currently rented to tenants who wish to stay and for $1,400/month. Priced to sell, this won’t be on the market long.
Key facts
- Front porch
- Back mud room
- 5,000 sq ft lot
Tags
Neighborhood map
What this means for you Summary
Snapshot
- This is a 3-bed/1.5-bath single-family listed at $99k.
Deal economics
- At list price, monthly cash flow is $424 ($5k/yr) — positive.
- The deal already cash-flows at list — no discount required.
- Meets the 1% rule at list price ($2k rent vs $99k).
- Recommended offer: $90k (9.0% below list) — sets the bar for market timing.
Location & tenants
- Location reads 77/100 on livability (#187 in NY, #2,869 nationally) — a middle-class / working-renter tenant base. Strengths: amenities A+, commute A+, cost of living A+; Watch: crime F, employment D-.
- Syracuse City School District (urban): math 18% / reading 26% proficiency, ranked #590 of 590 in NY (top 100%) — low school quality limits family demand, transient renter base, plan for 1-2y turnover; 74% free/reduced lunch — lower-income household profile, screen leases tightly.
- Zoned schools: Syracuse Latin School (math 31% / reading 62%, grade D-, #1,262 of 2,108 statewide, top 60%, 642 students, 42% FRL); Expeditionary Learning Middle School (math 17% / reading 32%, grade F, #611 of 729 statewide, top 88%, 170 students, 76% FRL); Institute of Technology At Syracuse Central (math 87% / reading 92%, grade A+, #265 of 1,100 statewide, top 26%, 581 students, 68% FRL).
- Zoned-school proficiency averages 54% at this address vs 22% district-wide (+32 pts) — the actual schools serving this property are materially stronger than the Syracuse City School District average implies; a family-tenant draw the district grade alone would hide.
- Market conditions: 63 active listings in the ZIP; 32 comparable units currently listed for rent nearby; rentals at typical pace (median 23d on market — plan ~3-4 weeks tenant-placement turnaround); 616 units permitted in Onondaga County in 2024 (256 in 5+ unit buildings).
Forward outlook
- Local home prices are declining (-3.0%/yr); year-one equity from $684 of loan paydown is wiped out by about $3k of value loss. Plan a longer hold.
- Onondaga County population projected to shrink 9% by 2050 — rents likely to lag national; underwrite the cash flow, not the appreciation.
- At projected returns (-3.0% appreciation + 3.0% rent growth), your $28k cash investment doubles in ~7 years — after that, you're playing with house money.
Negotiation context
- It's been on market 93 days — a 9% lower offer ($90k) is reasonable based on typical stale-listing flexibility.
- 11 sale attempts since 11y ago; this cycle's ask is 5251% above the opening price — seller raised mid-cycle; expect resistance to lowballs.
- Current owner paid $62k; list at $99k implies a 60% gain — meaningful room to come down on a strong offer.
Risks & watch-outs
- Watch-outs: flood insurance adds $460/mo; built in 1910 — expect roof / HVAC / electrical / plumbing capex.
- Climate carrying-cost: in FEMA flood zone AE (mandatory federal flood insurance) — expect insurance premiums to compound above CPI over the hold.
Questions for the listing agent
- It's been on market 93 days. Have you received any prior offers? Is the seller open to a 9% concession, seller financing, or rate buy-down credit?
- Built in 1910 — when were the roof, HVAC, electrical panel, plumbing, and water heater last replaced?
- What's the actual annual flood-insurance premium (NFIP or private), and is the property in a SFHA with mandatory coverage?
- Why hasn't it sold? Are there any deal-killer items the seller is aware of (foundation, flood, title, zoning, code violations)?
- Is there a deadline driving the sale (1031 exchange, divorce, estate, relocation)? That informs how much negotiation room exists.
- Schools are D-rated, which usually means shorter tenancies and higher turnover. Who's the typical renter profile here, and what's been the actual vacancy rate?
- Crime grade is F in this area — have there been break-ins, vandalism, or insurance claims at this property in the last 3 years? What carrier currently insures it and at what premium?
- What's the average days-on-market for RENTAL listings here right now (not sales)? A rising rental-DOM trend means longer vacancies and softer asking-rent achievability than the comps imply.
- What's the recent tenant-quality profile in this submarket — average credit score on applications, eviction rate, late-payment / NSF rate, and stable-employment percentage? A property-management company in the area should have these aggregated.
- How much new for-sale + rental construction is in the pipeline within 1–3 miles? Heavy new supply typically softens prices + rents 12–24 months out; constrained supply supports both.
Investment metrics
- 1% rule
- 1.94% ✓
- Cap rate
- 17.02%
- Cash-on-cash
- 38.31%
- DSCR
- 2.70
- GRM
- 4.3
CMA / ARV
- ARV (on-the-fly)
- $131,704
- Comps found
- 12
Show comp detail 12 sales within ~0.75 mi
| Address | Dist | Beds/Ba | Sqft | Sold | Price | $/sf | Match |
|---|---|---|---|---|---|---|---|
| 172 Parkway Dr | 0.47mi | 3/1.5 | 1,296 (-1%) | 2mo | $165,000 | $127 | 76 |
| 347 Palmer Ave | 0.08mi | 3/1.5 | 1,144 (-12%) | 4mo | $70,000 | $61 | 72 |
| 113 White St | 0.38mi | 3/1.5 | 1,194 (-8%) | 3mo | $160,000 | $134 | 66 |
| 119 Clyde Ave | 0.61mi | 3/1.0 | 1,296 (-1%) | 5mo | $78,000 | $60 | 64 |
| 1606 W Colvin St | 0.57mi | 3/1.0 | 1,344 (+3%) | 3mo | $57,000 | $42 | 64 |
| 122 Charmouth Dr | 0.69mi | 3/1.0 | 1,286 (-1%) | 1mo | $187,500 | $146 | 62 |
| 309 W Kennedy St | 0.44mi | 2/1.5 (-1) | 1,196 (-8%) | 2mo | $101,000 | $84 | 59 |
| 609 W Colvin St | 0.69mi | 3/1.5 | 1,236 (-5%) | 2mo | $100,000 | $81 | 58 |
| 141 Charmouth Dr | 0.72mi | 3/1.5 | 1,248 (-4%) | 4mo | $65,000 | $52 | 56 |
| 204 Davis St | 0.72mi | 2/1.0 (-1) | 1,208 (-7%) | 2mo | $122,300 | $101 | 46 |
| 118 Charmouth Dr | 0.69mi | 3/1.0 | 1,442 (+11%) | 6mo | $155,000 | $107 | 43 |
| 505 Stinard Ave | 0.64mi | 4/2.0 (+1) | 1,496 (+15%) | 7mo | $242,500 | $162 | 33 |
Match score weights: distance 35% · size 25% · config 20% · recency 20%. Top-matched comps best support the ARV.
Projected returns pro-forma
-3.0% appreciation · 3.0% rent growth · sell at horizon
- IRR
- 10.3%
- Equity multiple
- 1.41×
- Total profit
- $11,272
- Equity at exit
- $14,761
- IRR
- 19.5%
- Equity multiple
- 2.65×
- Total profit
- $45,759
- Equity at exit
- $8,560
Cash invested: $27,720 (down + closing). Projections, not guarantees.
Landlord ↔ Tenant lean methodology
- Overall (STATE)
- 15 Strongly Tenant-Friendly
- State New York
- 15 Strongly Tenant-Friendly · D+10
- County
- — inherits STATE
- City
- — inherits STATE
ZIP-level market 13207
- Home prices YoY
- -23.0%
- Active inventory
- 63
- Price-to-rent
- 4.3×
Monthly cashflow live
- Estimated rent
- $1,917 high interval (Pro) →
- Mortgage (P&I)
- −$519
- Tax from tax record
- −$69 /mo · $831/yr
- Insurance
- −$41
- Flood insurance flood zone
- −$460 /mo · $5,525/yr
- HOA
- −$0
- Vacancy / Maint / Mgmt
- −$403
- Net cashflow
- $424
Break-even live
Sensitivity live
| Price | -10% $481 | -5% $453 | +0% $424 | +5% $396 | +10% $368 |
|---|---|---|---|---|---|
| Rent | -10% $273 | -5% $349 | +0% $424 | +5% $500 | +10% $576 |
| Rate | -1.0pp $474 | -0.5pp $450 | base $424 | +0.5pp $399 | +1.0pp $373 |
UW: 25.0% down · 7.5% · 30yr · 1.5% tax · 5.0% vac · 8.0% maint · 8.0% mgmt
Financing live
Cash to close
- Down payment
- $24,750
- Closing costs
- $2,970
- Reserves months
- —
- Total cash needed
- —
Loan-product check · same deal, 3 products live
Conventional
25% down · 7.5% · 30yr
- Down + closing
- —
- Monthly P&I
- —
- Monthly cashflow
- —
- DSCR
- —
- Eligible?
- —
Personal DTI + credit; lowest rate.
DSCR
20% down · 8.5% · 30yr
- Down + closing
- —
- Monthly P&I
- —
- Monthly cashflow
- —
- DSCR
- —
- Eligible?
- —
No personal income docs; deal must DSCR.
Hard money
10% down · 12.0% · 12mo
- Down + closing
- —
- Monthly P&I
- —
- Monthly cashflow
- —
- DSCR
- —
- Eligible?
- —
Short-term bridge; refi at stabilization.
Rent comps 32 comps
| Address | Beds | Baths | Sqft | Rent | $/sqft | DOM | Units | Dist |
|---|---|---|---|---|---|---|---|---|
| 158 Parkway Dr Syracuse, NY | 4.0 | 3.0 | 1029 | $2,250 | $2.19 | 22d | 1 | 0.44mi |
| 122 Putnam St Syracuse, NY | 3.0 | 1.0 | 1064 | $2,050 | $1.93 | 22d | 1 | 0.48mi |
| 409 Stolp Ave Syracuse, NY | 1.0–3.0 | 1.0 | 849 | $1,575 | $1.86 | 15d | 5 | 0.51mi |
| 318 Kellogg St Unit 2 Syracuse, NY | 3.0 | 1.0 | 1523 | $1,675 | $1.10 | 45d | 1 | 0.51mi |
| 318 Kellogg St Unit 1 Syracuse, NY | 3.0 | 1.0 | 1523 | $1,650 | $1.08 | 45d | 1 | 0.51mi |
| 269 W Borden Ave Syracuse, NY | 4.0 | 1.5 | 1800 | $650 | $0.36 | 22d | 1 | 0.60mi |
| 1330 Midland Ave Syracuse, NY | 4.0 | 1.0 | 1870 | $2,000 | $1.07 | 22d | 1 | 0.60mi |
| 1110 Bellevue Ave Syracuse, NY | 3.0 | 1.0 | 1449 | $1,500 | $1.04 | 45d | 1 | 0.64mi |
| 315 Grant Ave #17 Syracuse, NY | 3.0 | 2.0 | 1477 | $1,275 | $0.86 | 15d | 1 | 0.76mi |
| 472 S Salina St Syracuse, NY | 1.0–2.0 | 1.0 | 1022 | $2,095 | $2.05 | 15d | 3 | 1.07mi |
| 111 E Onondaga St Syracuse, NY | 1.0–2.0 | 1.0–2.0 | 1150 | $3,000 | $2.61 | 22d | 5 | 1.08mi |
| 213 Fletcher Ave Unit 2 Syracuse, NY | 3.0 | 1.0 | 1200 | $1,700 | $1.42 | 15d | 1 | 1.10mi |
| 2331 Midland Ave Syracuse, NY | 4.0 | 1.5 | 1664 | $2,300 | $1.38 | 22d | 1 | 1.19mi |
| 1741 W Onondaga St Syracuse, NY | 1.0–2.0 | 1.0–2.0 | 800 | $1,250 | $1.56 | 15d | 3 | 1.21mi |
| 2859 S Salina St Unit 2 Syracuse, NY | 2.0 | 1.0 | 1000 | $1,200 | $1.20 | 45d | 1 | 1.22mi |
| 120 Walton St Syracuse, NY | 1.0–2.0 | 1.0–2.0 | 825 | $3,200 | $3.88 | 45d | 2 | 1.23mi |
| 110 Walton St Unit 201 Syracuse, NY | 2.0 | 2.0 | 1051 | $2,200 | $2.09 | 45d | 1 | 1.23mi |
| 110 Walton St Unit 301 Syracuse, NY | 2.0 | 2.0 | 1051 | $2,000 | $1.90 | 22d | 1 | 1.23mi |
| 205 E Jefferson St Unit 2B Syracuse, NY | 2.0 | 2.5 | 1100 | $2,200 | $2.00 | 22d | 1 | 1.24mi |
| 201 E Jefferson St Syracuse, NY | 2.0 | 1.0 | 662 | $1,626 | $2.45 | 15d | 9 | 1.24mi |
| 317 S Clinton St Unit 3A Syracuse, NY | 2.0 | 2.0 | 1500 | $2,100 | $1.40 | 45d | 1 | 1.25mi |
| 317 S Clinton St Unit 4A Syracuse, NY | 2.0 | 1.5 | 1500 | $2,100 | $1.40 | 15d | 1 | 1.25mi |
| 321 S Salina St Unit 501 Syracuse, NY | 2.0 | 1.0 | 1446 | $3,000 | $2.07 | 45d | 1 | 1.26mi |
| 321 S Salina St Unit 201 Syracuse, NY | 2.0 | 1.0 | 1446 | $2,450 | $1.69 | 45d | 1 | 1.26mi |
| 319 S Salina St Syracuse, NY | 2.0 | 2.0 | 1860 | $2,000 | $1.08 | 22d | 1 | 1.27mi |
| 129 W Fayette St Unit 217 Syracuse, NY | 2.0 | 2.0 | 1100 | $1,550 | $1.41 | 15d | 1 | 1.27mi |
| 538 Erie Blvd W Syracuse, NY | 2.0 | 2.0 | 1110 | $2,100 | $1.89 | 22d | 1 | 1.30mi |
| 324 W Water St Unit 106 Syracuse, NY | 2.0 | 1.0 | 1436 | $2,095 | $1.46 | 22d | 1 | 1.36mi |
| 324 W Water St Syracuse, NY | 2.0 | 1.0 | 1007 | $1,975 | $1.96 | 15d | 6 | 1.36mi |
| 60 Presidential Plz Syracuse, NY | 1.0–2.0 | 1.0–1.5 | 970 | $1,315 | $1.36 | 45d | 1 | 1.38mi |
| 121 Whittier Ave Syracuse, NY | 4.0 | 1.0 | 1400 | $600 | $0.43 | 45d | 1 | 1.38mi |
| 208 W Water St Syracuse, NY | 2.0 | 2.0 | 962 | $1,800 | $1.87 | 45d | 1 | 1.40mi |
Listing history 30 events
-
2026-05-10$1,850
-
2026-03-02status Pending
-
2026-02-19historical $1,600
-
2026-02-13$1,600
-
2026-02-09historical $1,600
-
2026-01-17$1,600
-
2025-12-19status Active
-
2025-10-22status Pending
-
2025-10-02$99,000 Active
-
2022-02-03soldstatus $62,000
-
2021-12-23soldstatus $62,000 Closed Sale or Rented 213-char remark
Show marketing remark (213 chars)
Well-maintained, spacious 3 bed, 1 1/2 bath house located on the cities Southside, that is currently rented to tenants who wish to stay and for $1,400/month. Priced to sell, this won’t be on the market long.
-
2021-11-08status Under Contract- Do Not Show 213-char remark
Show marketing remark (213 chars)
Well-maintained, spacious 3 bed, 1 1/2 bath house located on the cities Southside, that is currently rented to tenants who wish to stay and for $1,400/month. Priced to sell, this won’t be on the market long.
-
2021-10-27historical Continue to Show- Under Contract 213-char remark
Show marketing remark (213 chars)
Well-maintained, spacious 3 bed, 1 1/2 bath house located on the cities Southside, that is currently rented to tenants who wish to stay and for $1,400/month. Priced to sell, this won’t be on the market long.
-
2021-10-19$64,900 Active 213-char remark
Show marketing remark (213 chars)
Well-maintained, spacious 3 bed, 1 1/2 bath house located on the cities Southside, that is currently rented to tenants who wish to stay and for $1,400/month. Priced to sell, this won’t be on the market long.
-
2021-07-15historical
-
2021-05-03historical Continue to Show- Under Contract
-
2021-04-08status Active
-
2021-03-30historical Continue to Show- Under Contract
-
2021-03-26$59,900 Active
-
2021-01-28historical
-
2020-09-29$65,000 Active
-
2017-04-28soldstatus $56,100 Closed Sale or Rented
-
2017-02-22historical Continue to Show- Under Contract
-
2016-08-10price $54,900
-
2016-06-24price $59,900
-
2016-05-26$54,900 Active
-
2016-04-07soldstatus $5,000 Closed Sale or Rented
-
2016-02-16status Pending Sale
-
2016-01-05historical Under Contract- Do Not Show
-
2015-10-06$5,000 Active
ⓘ Source: listings_history table (triggers on properties + properties_extension) + one-shot
backfill from property_details.listing_events for pre-trigger history.
Tax reassessment forecast NY · Partial reset (capped growth)
- Current annual tax
- $831 · $69/mo
- Projected year-2 tax
- $1,252 · $104/mo
- Expected delta
- +$421/yr (+$35/mo · 50.6%)
ⓘ Screening estimate from a state-policy table — verify with the county assessor before closing.
Climate risk First Street
- Flood 9/10 Extreme FEMA zone AE · 99% chance over 30 yrs
- Wildfire 1/10 Low
- Heat 3/10 Moderate 7 d/yr ≥95°F today · 16 d/yr by 30 yrs out
- Wind 1/10 Low 100% chance of damaging wind over 30 yrs
- Air quality 2/10 Low 0 unhealthy d/yr today · 1 by 30 yrs out
Nearby sold comps map
Loading sold comps map…
Walkable amenities ~0.75 mi
Loading nearby amenities…
Taxation est. · year 1
- Rental income
- $23,006
- − Mortgage interest
- −$5,546
- − Property taxes
- −$831
- − Insurance
- −$6,020
- − Repairs & maintenance
- −$1,841
- − Management
- −$1,841
- − Depreciation
- −$2,880
- Taxable income
- $4,049
- Est. tax owed @ 24.0%
- −$972
- After-tax cash flow
- $4,122/yr
For passive investors: Depreciation is non-cash, so a rental often shows a tax loss while cash-flowing — sheltering income. Rental losses are passive: they offset passive income freely, and up to $25,000/yr can offset ordinary (W-2) income if you actively participate and your MAGI is under $100k (phasing out to $0 by $150k); unused losses carry forward. On sale, claimed depreciation is recaptured at up to 25%, and gains may owe capital-gains tax (a 1031 exchange can defer both). Figures are a year-1 estimate at your 24.0% rate — not tax advice; consult a CPA.
Schools (NCES district)
- District
- Syracuse City School District
- NCES district ID
- 3628590
- Math proficiency
- 18% ▼ -5.00%
- Reading proficiency
- 26% ▬ 0.00%
- Median HH income
- $32,097
- Composite
- 17.83/100
- National rank
- #9007
- State rank
- #590 of 590 in NY
Livability — Syracuse
- Score
- 77/100
- State rank
- #187
- US rank
- #2869
Category grades
Schools grade is shown separately in the Schools card above.
Census & demographics
- Census place
- Syracuse, NY
- City population
- 152,627
- Population (ZIP)
- 12,383
Population outlook (Onondaga County) Hauer SSP2
- Today (2025)
- 467,894 people
- By 2030
- 463,381 · -1.0%
- By 2040
- 447,697 · -4.3%
- By 2050
- 426,399 · -8.9%
- By 2075
- 373,661 · -20.1%
- By 2100
- 307,967 · -34.2%
Race, ethnicity, and origin ACS 2023
- Neighborhood character
- Diverse neighborhood (Simpson 0.68)
- Race & ethnicity
- White 43% Black 33% Hispanic / Latino 17% Two or more races 11% Native American 1% Asian 1%
- Hispanic origin (detail)
- Puerto Rican 13% Cuban 1%
- Common ancestry
- Romanian 3% Lithuanian 1% Slovak 1%
- Foreign-born
- 4% · Canada, South Korea
- Languages at home
- 89% English-only · Spanish 9% French/Haitian/Cajun 1%
Political lean MEDSL · Onondaga
- 2024 margin
- D (+17.3) · D 58.6% · R 41.4%
- 2008→2024 swing
- -3.0pp toward R · 2008: 20.3pp · 2024: 17.3pp
- All cycles
- 2024: D+17.3 2020: D+20.6 2016: D+12.8 2012: D+21.1 2008: D+20.3
Not yet ingested
- Civics
- —
Market trends
- HPI YoY
- ▼ -95.17%
- Current HPI
- 318.9257
- Rent YoY
- —
- Metro
- —
- State GDP YoY
- ▲ 2.60%
- F500 in state
- 92
Industry mix (Fortune 500 HQ in NY)
| Industry | F500 HQs | Revenue |
|---|---|---|
| Financial Services | 10 | $950B |
|
||
| Consumer Goods | 9 | $162B |
|
||
| Insurance | 4 | $225B |
|
||
| Telecommunications | 2 | $144B |
|
||
| Pharmaceuticals | 2 | $112B |
|
||
| Media / Entertainment | 2 | $69B |
|
||
Price history
-63.0% since first listed30 events — show timeline
- 2026-05-10 Listed for Rent $1,850 TURBOTENANT
- 2026-03-02 Pending — CNYIS
- 2026-02-19 Rental Removed $1,600 APPFOLIO
- 2026-02-13 Listed for Rent $1,600 APPFOLIO
- 2026-02-09 Rental Removed $1,600 APPFOLIO
- 2026-01-17 Listed for Rent $1,600 APPFOLIO
- 2025-12-19 Relisted — CNYIS
- 2025-10-22 Pending — CNYIS
- 2025-10-02 Listed $99,000 CNYIS
- 2022-02-03 Sold (Public Records) $62,000 Public Records
- 2021-12-23 Sold (MLS) $62,000 CNYIS
- 2021-11-08 Pending — CNYIS
- 2021-10-27 Contingent — CNYIS
- 2021-10-19 Listed $64,900 CNYIS
- 2021-07-15 Listing Removed — CNYIS
- 2021-05-03 Contingent — CNYIS
- 2021-04-08 Relisted — CNYIS
- 2021-03-30 Contingent — CNYIS
- 2021-03-26 Listed $59,900 CNYIS
- 2021-01-28 Listing Removed — CNYIS
- 2020-09-29 Listed $65,000 CNYIS
- 2017-04-28 Sold (MLS) $56,100 CNYIS
- 2017-02-22 Contingent — CNYIS
- 2016-08-10 Price Changed $54,900 CNYIS
- 2016-06-24 Price Changed $59,900 CNYIS
- 2016-05-26 Listed $54,900 CNYIS
- 2016-04-07 Sold (MLS) $5,000 CNYIS
- 2016-02-16 Pending — CNYIS
- 2016-01-05 Contingent — CNYIS
- 2015-10-06 Listed $5,000 CNYIS
Property tax history
+2.1%/yrLatest (2025): $831 · +0.0% YoY. Source: county tax records.
Cash-flow waterfall
monthlySold comps — $/sqft
last 12 mo · ≤1 miLoading sold comps…