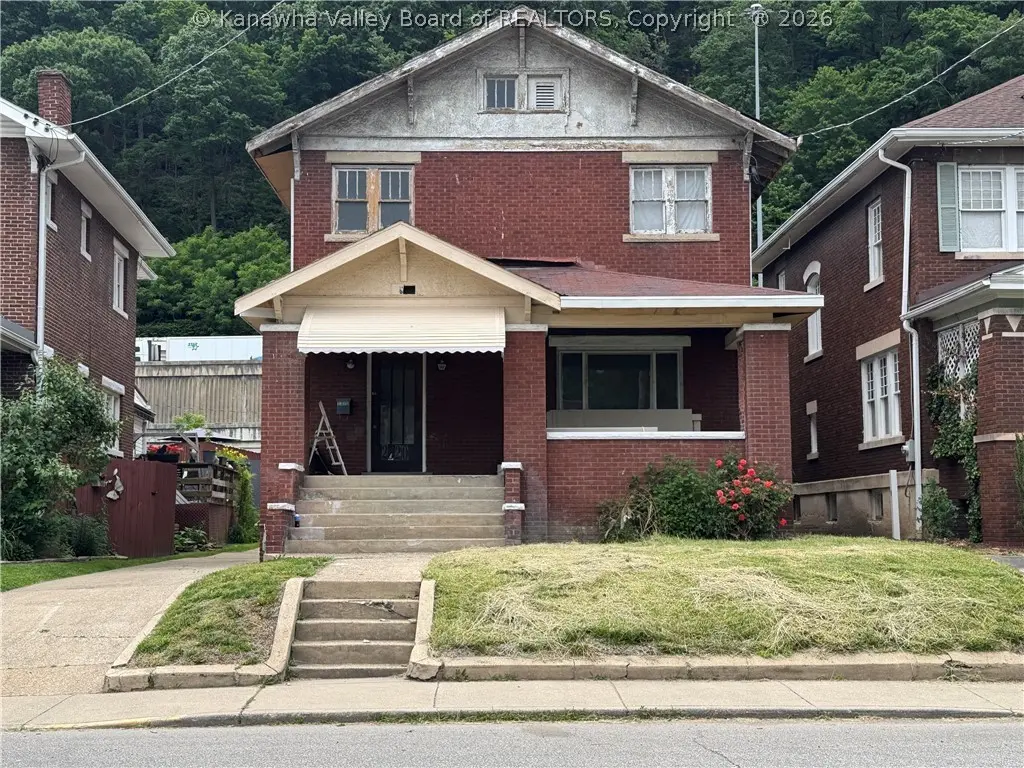
2320 Washington St E · Charleston, WV
Flood risk 9/10 · Severe
- FEMA flood zone
- X (shaded)
- Chance of flooding over 30 yrs
- 0.99%
- Est. flood insurance / yr
- $473 – $860
Fire risk 4/10 · Minor
- Est. fire insurance / yr
- $787 – $1,461
Heat risk 5/10 · Moderate
- Hot days now (above 100°F)
- 7 days/yr
- Hot days in 30 yrs
- 20 days/yr
Wind risk 2/10 · Minimal
- Chance of severe wind over 30 yrs
- 1.0%
Air-quality risk 1/10 · Minimal
- Unhealthy air days now
- 0 days/yr
- Unhealthy air days in 30 yrs
- 0 days/yr
Risk factors via First Street. Map © Google.
Why this score? — see what drove the B- grade
The composite is a weighted blend of 9 inputs, each scored 0–100. Each bar is that input's sub-score; the figure is the points it added to the 100-point composite (weight × sub-score).
- Cash flow +30.0/30.0
- 1% rule +10.0/10.0
- DSCR +10.0/10.0
- ARV discount +7.5/15.0
- Livability +4.2/5.0
- Schools +2.9/10.0
- Rent growth +2.5/5.0
- Condition / age +2.5/5.0
- Appreciation +0.0/10.0
$35,000
🖨 Deal sheet 📄 Offer letter ✓ Due diligence
Listing remarks
Investor Special! This property is being sold as-is and will require extensive renovation. Repairs and updates are needed throughout, including flooring, walls, electrical, plumbing, and other major components. Ideal opportunity for investors, contractors, or buyers looking for a complete rehab project. Cash offers only. Seller will make no repairs. Bring your vision and transform this property into its full potential.
Key facts
- 2 garage spots
- Built 1920
- Listed 3 days
Property features AI
Exterior
- Parking: Detached 2-car garage
- Utilities: Public water; Public sewer
- Home design: Two-story single-family home; Residential property
- Construction: Brick, block and plaster construction; Composition shingle roof
- Exterior features: Front porch
Interior
- Flooring: Hardwood
- Bathrooms: 2 full bathrooms
- Heating & cooling: Electric forced-air heating
- Interior features: Insulated windows with wood frames; Hardwood flooring; Full basement
Neighborhood map
What this means for you Summary
Snapshot
- This is a 4-bed/2.0-bath single-family listed at $35k.
Deal economics
- At list price, monthly cash flow is $765 ($9k/yr) — positive.
- The deal already cash-flows at list — no discount required.
- Meets the 1% rule at list price ($1k rent vs $35k).
- Cap rate 34.4% vs local median 3.8% in Charleston — top-decile yield for the area; either an underpriced asset or a hidden risk that comps aren't pricing in. Stress-test before assuming the spread holds.
Location & tenants
- Location reads 85/100 on livability (#3 in WV, #524 nationally) — a professional / high-income tenant draw. Strengths: amenities A+, commute A+, cost of living A+; Watch: crime F.
- Kanawha County Schools (suburban): math 29% / reading 40% proficiency, ranked #17 of 55 in WV (top 31%) — families likely to look elsewhere, expect single-tenant / working-renter base with shorter leases.
- Zoned schools: Piedmont Year-Round Education (math 17% / reading 22%, grade F, #350 of 377 statewide, top 95%, 258 students, 0% FRL); Horace Mann Middle School (math 35% / reading 42%, grade F, #23 of 109 statewide, top 21%, 399 students, 0% FRL); Capital High School (math 22% / reading 52%, grade F, #32 of 110 statewide, top 34%, 1,086 students, 0% FRL) — zoned schools average 0% FRL vs 46% district-wide (46 pts lower); this property's tenant base skews higher-income than the district average.
- Market conditions: 61 active listings in the ZIP; 103 units permitted in Kanawha County in 2024 (0 in 5+ unit buildings).
Forward outlook
- Local home prices are declining (-3.0%/yr); year-one equity from $242 of loan paydown is wiped out by about $1k of value loss. Plan a longer hold.
- Kanawha County population projected at -17% by 2050 — secular population decline; favor cash flow + early exit over multi-decade hold.
- At projected returns (-3.0% appreciation + 3.0% rent growth), your $10k cash investment doubles in ~2 years — after that, you're playing with house money.
Negotiation context
- Only 3 days on market — expect competitive offers; lowballing is unlikely to land.
Risks & watch-outs
- Watch-outs: flood insurance adds $56/mo; built in 1920 — expect roof / HVAC / electrical / plumbing capex.
- Climate carrying-cost: severe flood risk; extreme-heat days projected 7→20/yr by 2055 (HVAC capex compounding) — expect insurance premiums to compound above CPI over the hold.
Questions for the listing agent
- Built in 1920 — when were the roof, HVAC, electrical panel, plumbing, and water heater last replaced?
- What's the actual annual flood-insurance premium (NFIP or private), and is the property in a SFHA with mandatory coverage?
- Is there a deadline driving the sale (1031 exchange, divorce, estate, relocation)? That informs how much negotiation room exists.
- Schools are A-rated — typically a magnet for longer-tenancy family renters. What's the average tenant stay here, and is there a school-zone premium baked into asking?
- Crime grade is F in this area — have there been break-ins, vandalism, or insurance claims at this property in the last 3 years? What carrier currently insures it and at what premium?
- What's the average days-on-market for RENTAL listings here right now (not sales)? A rising rental-DOM trend means longer vacancies and softer asking-rent achievability than the comps imply.
- What's the recent tenant-quality profile in this submarket — average credit score on applications, eviction rate, late-payment / NSF rate, and stable-employment percentage? A property-management company in the area should have these aggregated.
- How much new for-sale + rental construction is in the pipeline within 1–3 miles? Heavy new supply typically softens prices + rents 12–24 months out; constrained supply supports both.
Investment metrics
- 1% rule
- 3.75% ✓
- Cap rate
- 34.44%
- Cash-on-cash
- 100.53%
- DSCR
- 5.47
- GRM
- 2.2
CMA / ARV
- ARV (on-the-fly)
- $164,008
- Comps found
- 7
Show comp detail 7 sales within ~0.75 mi
| Address | Dist | Beds/Ba | Sqft | Sold | Price | $/sf | Match |
|---|---|---|---|---|---|---|---|
| 2212 Washington St E | 0.14mi | 4/2.0 | 2,000 (+1%) | 17mo | $165,000 | $83 | 77 |
| 2326 Washington St E | 0.02mi | 3/2.0 (-1) | 2,128 (+8%) | 11mo | $205,000 | $96 | 72 |
| 2014 Quarrier St | 0.24mi | 3/2.0 (-1) | 1,953 (-1%) | 16mo | $200,000 | $102 | 69 |
| 909 Centers Rd | 0.38mi | 3/2.5 (-1) | 1,931 (-2%) | 18mo | $92,000 | $48 | 56 |
| 2431 Washington St | 0.17mi | 3/2.0 (-1) | 1,700 (-14%) | 10mo | $115,000 | $68 | 56 |
| 505 Elizabeth St | 0.71mi | 4/2.0 | 1,716 (-13%) | 4mo | $58,500 | $34 | 42 |
| 3719 Virginia Ave | 0.74mi | 3/2.0 (-1) | 2,250 (+14%) | 20mo | $295,000 | $131 | 20 |
Match score weights: distance 35% · size 25% · config 20% · recency 20%. Top-matched comps best support the ARV.
Projected returns pro-forma
-3.0% appreciation · 3.0% rent growth · sell at horizon
- IRR
- 94.6%
- Equity multiple
- 5.40×
- Total profit
- $43,117
- Equity at exit
- $5,219
- IRR
- 97.3%
- Equity multiple
- 11.25×
- Total profit
- $100,473
- Equity at exit
- $3,026
Cash invested: $9,800 (down + closing). Projections, not guarantees.
Landlord ↔ Tenant lean methodology
- Overall (STATE)
- 83 Strongly Landlord-Friendly
- State West Virginia
- 83 Strongly Landlord-Friendly · R+22
- County
- — inherits STATE
- City
- — inherits STATE
ZIP-level market 25311
- Home prices YoY
- -12.5%
- Active inventory
- 61
- Price-to-rent
- 2.2×
Monthly cashflow live
- Estimated rent
- $1,312 medium interval (Pro) →
- Mortgage (P&I)
- −$184
- Tax from tax record
- −$17 /mo · $209/yr
- Insurance
- −$15
- Flood insurance flood zone
- −$56 /mo · $666/yr
- HOA
- −$0
- Vacancy / Maint / Mgmt
- −$276
- Net cashflow
- $765
Break-even live
UW: 25.0% down · 7.5% · 30yr · 1.5% tax · 5.0% vac · 8.0% maint · 8.0% mgmt
Financing live
Cash to close
- Down payment
- $8,750
- Closing costs
- $1,050
- Reserves months
- —
- Total cash needed
- —
Loan-product check · same deal, 3 products live
Conventional
25% down · 7.5% · 30yr
- Down + closing
- —
- Monthly P&I
- —
- Monthly cashflow
- —
- DSCR
- —
- Eligible?
- —
Personal DTI + credit; lowest rate.
DSCR
20% down · 8.5% · 30yr
- Down + closing
- —
- Monthly P&I
- —
- Monthly cashflow
- —
- DSCR
- —
- Eligible?
- —
No personal income docs; deal must DSCR.
Hard money
10% down · 12.0% · 12mo
- Down + closing
- —
- Monthly P&I
- —
- Monthly cashflow
- —
- DSCR
- —
- Eligible?
- —
Short-term bridge; refi at stabilization.
Listing history 4 events
-
2026-06-09status $35,000 Pending 3 DOM
-
2026-06-08days on market $35,000 Active 3 DOM
-
2026-06-07remarks 422-char remark
-
2026-06-07$35,000 Active 2 DOM
ⓘ Source: listings_history table (triggers on properties + properties_extension) + one-shot
backfill from property_details.listing_events for pre-trigger history.
Tax reassessment forecast WV · Resets to sale price
- Current annual tax
- $209 · $17/mo
- Projected year-2 tax
- $209 · $17/mo
- Expected delta
- $0/yr ($0/mo · 0.0%)
ⓘ Screening estimate from a state-policy table — verify with the county assessor before closing.
Climate risk First Street
- Flood 9/10 Extreme FEMA zone X (shaded) · 99% chance over 30 yrs
- Wildfire 4/10 Moderate
- Heat 5/10 Major 7 d/yr ≥100°F today · 20 d/yr by 30 yrs out
- Wind 2/10 Low 100% chance of damaging wind over 30 yrs
- Air quality 1/10 Low 0 unhealthy d/yr today · 0 by 30 yrs out
Nearby sold comps map
Loading sold comps map…
Walkable amenities ~0.75 mi
Loading nearby amenities…
Taxation est. · year 1
- Rental income
- $15,745
- − Mortgage interest
- −$1,961
- − Property taxes
- −$209
- − Insurance
- −$842
- − Repairs & maintenance
- −$1,260
- − Management
- −$1,260
- − Depreciation
- −$1,018
- Taxable income
- $9,196
- Est. tax owed @ 24.0%
- −$2,207
- After-tax cash flow
- $6,978/yr
For passive investors: Depreciation is non-cash, so a rental often shows a tax loss while cash-flowing — sheltering income. Rental losses are passive: they offset passive income freely, and up to $25,000/yr can offset ordinary (W-2) income if you actively participate and your MAGI is under $100k (phasing out to $0 by $150k); unused losses carry forward. On sale, claimed depreciation is recaptured at up to 25%, and gains may owe capital-gains tax (a 1031 exchange can defer both). Figures are a year-1 estimate at your 24.0% rate — not tax advice; consult a CPA.
Schools (NCES district)
- District
- Kanawha County Schools
- NCES district ID
- 5400600
- Math proficiency
- 29% ▼ -13.00%
- Reading proficiency
- 40% ▼ -7.00%
- Median HH income
- $44,329
- Composite
- 29.35/100
- National rank
- #6540
- State rank
- #17 of 55 in WV
Livability — Charleston
- Score
- 85/100
- State rank
- #3
- US rank
- #524
Category grades
Schools grade is shown separately in the Schools card above.
Census & demographics
- Census place
- Charleston, WV
- City population
- 33,502
- Population (ZIP)
- 9,613
Population outlook (Kanawha County) Hauer SSP2
- Today (2025)
- 178,946 people
- By 2030
- 172,906 · -3.4%
- By 2040
- 159,874 · -10.7%
- By 2050
- 148,148 · -17.2%
- By 2075
- 123,257 · -31.1%
- By 2100
- 96,454 · -46.1%
Race, ethnicity, and origin ACS 2023
- Neighborhood character
- Predominantly White (82%)
- Race & ethnicity
- White 82% Black 10% Two or more races 6%
- Common ancestry
- Italian 3% Iranian 2% Slovak 2%
- Foreign-born
- 2% · Canada, China
- Languages at home
- 97% English-only · Spanish 1% German/W. Germanic 1%
Political lean MEDSL · Kanawha
- 2024 margin
- R (+17.4) · D 40.2% · R 57.6% · Other 2.2%
- 2008→2024 swing
- -17.0pp toward R · 2008: -0.4pp · 2024: -17.4pp
- All cycles
- 2024: R+17.4 2020: R+14.7 2016: R+20.6 2012: R+11.9 2008: R+0.4
Not yet ingested
- Civics
- —
Market trends
- HPI YoY
- ▼ -23.77%
- Current HPI
- 166.032
- Rent YoY
- —
- Metro
- —
- State GDP YoY
- —
- F500 in state
- 0
Price history
-26.3% since first listed2 events — show timeline
- 2026-06-05 Listed $35,000 KVBOR
- 1992-11-23 Sold (Public Records) $47,500 Public Records
Property tax history
-7.1%/yrLatest (2025): $209 · -79.6% YoY. Source: county tax records.
Cash-flow waterfall
monthlySold comps — $/sqft
last 12 mo · ≤1 miLoading sold comps…