825 Mallard Dr · Beaver Creek, TX
Flood risk 1/10 · Minimal
- FEMA flood zone
- X (unshaded)
- Chance of flooding over 30 yrs
- 0.0%
- Est. flood insurance / yr
- $507 – $1,088
Fire risk 5/10 · Moderate
- Est. fire insurance / yr
- $1,222 – $2,270
Heat risk 8/10 · Major
- Hot days now (above 110°F)
- 7 days/yr
- Hot days in 30 yrs
- 22 days/yr
Wind risk 8/10 · Major
- Chance of severe wind over 30 yrs
- 90.0%
Air-quality risk 1/10 · Minimal
- Unhealthy air days now
- 0 days/yr
- Unhealthy air days in 30 yrs
- 0 days/yr
Risk factors via First Street. Map © Google.
Why this score? — see what drove the B- grade
The composite is a weighted blend of 9 inputs, each scored 0–100. Each bar is that input's sub-score; the figure is the points it added to the 100-point composite (weight × sub-score).
- Cash flow +30.0/30.0
- DSCR +10.0/10.0
- 1% rule +9.7/10.0
- ARV discount +7.5/15.0
- Schools +3.6/10.0
- Rent growth +2.5/5.0
- Livability +2.5/5.0
- Condition / age +2.5/5.0
- Appreciation +0.0/10.0
$89,900
🖨 Deal sheet 📄 Offer letter ✓ Due diligence
Listing remarks
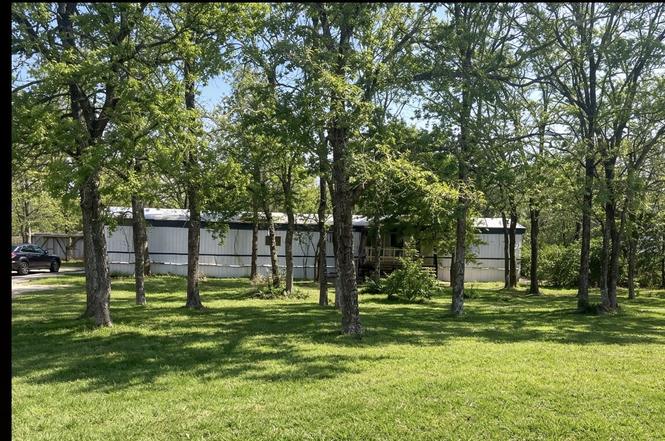
Nestled on a generous 1-acre wooded lot, this home offers endless possibilities. Featuring 3 bedrooms, 2 baths, a spacious living room with a ceiling fan and ample natural light, a master bath with double sinks, a shower, and a tub. The kitchen features an island, ample cabinet space, and a cozy breakfast area. Step outside and unwind on the porch, surrounded by the tranquility of your own private oasis. With a little love and attention, this could be the perfect place to call home. Sold "AS "IS".
Key facts
- 1 acre wooded lot
- Cozy breakfast area
- Private oasis
Tags
Property features AI
Finance
- HOA & community: Member of Beaver Creed Land Owners association; Annual association fee of $123
Exterior
- Parking: Detached carport; Additional parking; 2-space carport
- Utilities: Septic tank
- Home design: Residential property facing west; One-story (built in 1994)
- Construction: Aluminum siding; Metal roof; Built in 1994
- Exterior features: Covered patio; Porch; Patio; Deck; Private yard; Cleared and wooded lot; Subdivision setting; Has additional parcels
Interior
- Kitchen: Dishwasher; Electric oven; Electric range; Free-standing range; Microwave; Refrigerator
- Bedrooms: Primary bedroom on first floor (approx. 10 x 12); Two additional bedrooms on first floor (each approx. 10 x 10)
- Flooring: Carpet; Laminate
- Bathrooms: 2 full bathrooms
- Heating & cooling: Central electric heating
- Interior features: Window treatments; Ceiling fans
- Laundry & utility: Washer hookup; Electric dryer hookup; Dryer included
Neighborhood map
What this means for you Summary
Snapshot
- This is a 3-bed/2.0-bath manufactured listed at $90k.
Deal economics
- At list price, monthly cash flow is $485 ($6k/yr) — positive.
- The deal already cash-flows at list — no discount required.
- Meets the 1% rule at list price ($1k rent vs $90k).
- Recommended offer: $87k (3.0% below list) — sets the bar for market timing.
Location & tenants
- Location reads: area grade B — affects rentability + tenant quality, not the cash-flow math above.
- Snook ISD (rural): math 50% / reading 34% proficiency, ranked #334 of 826 in TX (top 40%) — families likely to look elsewhere, expect single-tenant / working-renter base with shorter leases; 60% free/reduced lunch — lower-income household profile, screen leases tightly.
- Zoned schools: Snook Secondary (math 47% / reading 27%, grade F, #897 of 1,632 statewide, top 57%, 295 students, 68% FRL).
- Market conditions: 315 active listings in the ZIP; 44 units permitted in Burleson County in 2024 (0 in 5+ unit buildings).
Forward outlook
- Local home prices are declining (-3.0%/yr); year-one equity from $622 of loan paydown is wiped out by about $3k of value loss. Plan a longer hold.
- At projected returns (-3.0% appreciation + 3.0% rent growth), your $25k cash investment doubles in ~6 years — after that, you're playing with house money.
Negotiation context
- It's been on market 58 days — a 3% lower offer ($87k) is reasonable based on typical stale-listing flexibility.
Risks & watch-outs
- Climate carrying-cost: severe wind risk, 90% chance of damaging wind over 30y; moderate wildfire risk; extreme-heat days projected 7→22/yr by 2055 (HVAC capex compounding) — expect insurance premiums to compound above CPI over the hold.
Questions for the listing agent
- It's been on market 58 days. Have you received any prior offers? Is the seller open to a 3% concession, seller financing, or rate buy-down credit?
- What does the HOA fee cover, when was the last increase, and are there any pending special assessments or reserve-fund shortfalls?
- Is there a deadline driving the sale (1031 exchange, divorce, estate, relocation)? That informs how much negotiation room exists.
- What's the average days-on-market for RENTAL listings here right now (not sales)? A rising rental-DOM trend means longer vacancies and softer asking-rent achievability than the comps imply.
- What's the recent tenant-quality profile in this submarket — average credit score on applications, eviction rate, late-payment / NSF rate, and stable-employment percentage? A property-management company in the area should have these aggregated.
- How much new for-sale + rental construction is in the pipeline within 1–3 miles? Heavy new supply typically softens prices + rents 12–24 months out; constrained supply supports both.
Investment metrics
- 1% rule
- 1.47% ✓
- Cap rate
- 12.77%
- Cash-on-cash
- 23.14%
- DSCR
- 2.03
- GRM
- 5.7
CMA / ARV
No comps found within radius.
Projected returns pro-forma
-3.0% appreciation · 3.0% rent growth · sell at horizon
- IRR
- 16.1%
- Equity multiple
- 1.65×
- Total profit
- $16,336
- Equity at exit
- $13,404
- IRR
- 24.7%
- Equity multiple
- 3.14×
- Total profit
- $53,971
- Equity at exit
- $7,773
Cash invested: $25,172 (down + closing). Projections, not guarantees.
Landlord ↔ Tenant lean methodology
- Overall (STATE)
- 87 Strongly Landlord-Friendly
- State Texas
- 87 Strongly Landlord-Friendly · R+5
- County
- — inherits STATE
- City
- — inherits STATE
ZIP-level market 77836
- Home prices YoY
- -26.0%
- Active inventory
- 315
- Price-to-rent
- 5.7×
Monthly cashflow live
- Estimated rent
- $1,325 medium interval (Pro) →
- Mortgage (P&I)
- −$471
- Tax from tax record
- −$42 /mo · $504/yr
- Insurance
- −$37
- HOA
- −$10
- Vacancy / Maint / Mgmt
- −$278
- Net cashflow
- $485
Break-even live
UW: 25.0% down · 7.5% · 30yr · 1.5% tax · 5.0% vac · 8.0% maint · 8.0% mgmt
Financing live
Cash to close
- Down payment
- $22,475
- Closing costs
- $2,697
- Reserves months
- —
- Total cash needed
- —
Loan-product check · same deal, 3 products live
Conventional
25% down · 7.5% · 30yr
- Down + closing
- —
- Monthly P&I
- —
- Monthly cashflow
- —
- DSCR
- —
- Eligible?
- —
Personal DTI + credit; lowest rate.
DSCR
20% down · 8.5% · 30yr
- Down + closing
- —
- Monthly P&I
- —
- Monthly cashflow
- —
- DSCR
- —
- Eligible?
- —
No personal income docs; deal must DSCR.
Hard money
10% down · 12.0% · 12mo
- Down + closing
- —
- Monthly P&I
- —
- Monthly cashflow
- —
- DSCR
- —
- Eligible?
- —
Short-term bridge; refi at stabilization.
HOA detail
- Monthly dues
- $10 · $120/yr
Listing history 8 events
-
2026-04-25status Pending
-
2026-04-25historical
-
2026-04-07price $89,900
-
2026-03-28price $94,900
-
2026-03-15price $104,900
-
2026-02-26$119,900 Active
-
2026-02-26soldstatus
-
1988-05-04soldstatus
ⓘ Source: listings_history table (triggers on properties + properties_extension) + one-shot
backfill from property_details.listing_events for pre-trigger history.
Tax reassessment forecast TX · Resets to sale price
- Current annual tax
- $504 · $42/mo
- Projected year-2 tax
- $1,645 · $137/mo
- Expected delta
- +$1,141/yr (+$95/mo · 226.1%)
ⓘ Screening estimate from a state-policy table — verify with the county assessor before closing.
Climate risk First Street
- Flood 1/10 Low FEMA zone X (unshaded) · 0% chance over 30 yrs
- Wildfire 5/10 Major
- Heat 8/10 Severe 7 d/yr ≥110°F today · 22 d/yr by 30 yrs out
- Wind 8/10 Severe 90% chance of damaging wind over 30 yrs
- Air quality 1/10 Low 0 unhealthy d/yr today · 0 by 30 yrs out
Nearby sold comps map
Loading sold comps map…
Walkable amenities ~0.75 mi
Loading nearby amenities…
Taxation est. · year 1
- Rental income
- $15,895
- − Mortgage interest
- −$5,036
- − Property taxes
- −$504
- − Insurance
- −$450
- − Repairs & maintenance
- −$1,272
- − Management
- −$1,272
- − HOA
- −$120
- − Depreciation
- −$2,615
- Taxable income
- $4,627
- Est. tax owed @ 24.0%
- −$1,110
- After-tax cash flow
- $4,715/yr
For passive investors: Depreciation is non-cash, so a rental often shows a tax loss while cash-flowing — sheltering income. Rental losses are passive: they offset passive income freely, and up to $25,000/yr can offset ordinary (W-2) income if you actively participate and your MAGI is under $100k (phasing out to $0 by $150k); unused losses carry forward. On sale, claimed depreciation is recaptured at up to 25%, and gains may owe capital-gains tax (a 1031 exchange can defer both). Figures are a year-1 estimate at your 24.0% rate — not tax advice; consult a CPA.
Schools (NCES district)
- District
- Snook ISD
- NCES district ID
- 4840620
- Math proficiency
- 50% ▲ 8.00%
- Reading proficiency
- 34% ▼ -1.00%
- Median HH income
- $47,667
- Composite
- 36.0/100
- National rank
- #4788
- State rank
- #334 of 826 in TX
Livability — Beaver Creek
No livability data for this city. (Only ~50 U.S. cities are tracked.)
Census & demographics
- Census place
- Beaver Creek, TX
- Population (ZIP)
- 12,469
Population outlook (Burleson County) Hauer SSP2
- Today (2025)
- 18,066 people
- By 2030
- 18,174 · +0.6%
- By 2040
- 18,198 · +0.7%
- By 2050
- 18,110 · +0.2%
- By 2075
- 18,166 · +0.6%
- By 2100
- 16,949 · -6.2%
Race, ethnicity, and origin ACS 2023
- Neighborhood character
- Predominantly White (66%)
- Race & ethnicity
- White 66% Hispanic / Latino 21% Black 10% Two or more races 9%
- Hispanic origin (detail)
- Mexican 17%
- Common ancestry
- Lithuanian 2% Romanian 1% Slovak 1%
- Foreign-born
- 5% · Canada, Guatemala
- Languages at home
- 86% English-only · Spanish 13%
Political lean MEDSL · Burleson
- 2024 margin
- Solid R (+62.8) · D 18.2% · R 81.0%
- 2008→2024 swing
- -25.4pp toward R · 2008: -37.4pp · 2024: -62.8pp
- All cycles
- 2024: R+62.8 2020: R+57.6 2016: R+55.1 2012: R+46.0 2008: R+37.4
Not yet ingested
- Civics
- —
Market trends
- HPI YoY
- ▼ -65.96%
- Current HPI
- 187.5385
- Rent YoY
- —
- Metro
- —
- State GDP YoY
- ▲ 3.95%
- F500 in state
- 110
Industry mix (Fortune 500 HQ in TX)
| Industry | F500 HQs | Revenue |
|---|---|---|
| Energy | 16 | $1,198B |
|
||
| Technology | 5 | $198B |
|
||
| Engineering / Construction | 4 | $72B |
|
||
| Energy Services | 3 | $60B |
|
||
| Utilities | 3 | $41B |
|
||
| Healthcare | 2 | $330B |
|
||
Price history
-25.0% since first listed8 events — show timeline
- 2026-04-25 Pending — HARMLS
- 2026-04-25 Listing Removed — HARMLS
- 2026-04-07 Price Changed $89,900 HARMLS
- 2026-03-28 Price Changed $94,900 HARMLS
- 2026-03-15 Price Changed $104,900 HARMLS
- 2026-02-26 Sold (Public Records) — Public Records
- 2026-02-26 Listed $119,900 HARMLS
- 1988-05-04 Sold (Public Records) — Public Records
Property tax history
+14.6%/yrLatest (2025): $504 · +7.9% YoY. Source: county tax records.
Cash-flow waterfall
monthlySold comps — $/sqft
last 12 mo · ≤1 miLoading sold comps…