 🏷️ Likely Rental
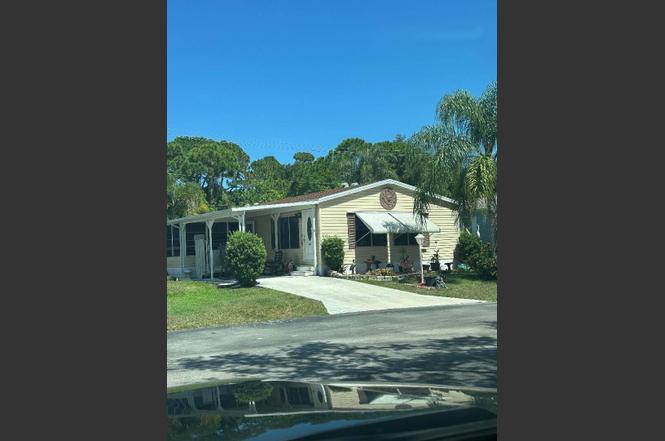
456 Tropical Isles Cir · Indian River Estates, FL
Flood risk 1/10 · Minimal
- FEMA flood zone
- X (unshaded)
- Chance of flooding over 30 yrs
- 0.0%
- Est. flood insurance / yr
- $507 – $1,088
Fire risk 4/10 · Minor
- Est. fire insurance / yr
- $947 – $1,759
Heat risk 10/10 · Severe
- Hot days now (above 106°F)
- 7 days/yr
- Hot days in 30 yrs
- 24 days/yr
Wind risk 10/10 · Severe
- Chance of severe wind over 30 yrs
- 99.0%
Air-quality risk 2/10 · Minimal
- Unhealthy air days now
- 1 days/yr
- Unhealthy air days in 30 yrs
- 1 days/yr
Risk factors via First Street. Map © Google.
Why this score? — see what drove the B+ grade
The composite is a weighted blend of 9 inputs, each scored 0–100. Each bar is that input's sub-score; the figure is the points it added to the 100-point composite (weight × sub-score).
- Cash flow +30.0/30.0
- ARV discount +15.0/15.0
- 1% rule +10.0/10.0
- DSCR +10.0/10.0
- Rent growth +4.4/5.0
- Schools +3.7/10.0
- Livability +3.2/5.0
- Condition / age +2.5/5.0
- Appreciation +0.0/10.0
$74,900
🖨 Deal sheet 📄 Offer letter ✓ Due diligence
Listing remarks MLS
PET FRIENDLY COMMUNITY! COME AND ENJOY THE MANY ACTIVITIES AT THIS ACTIVE COMMUNITY SELLER IS OPEN TO ALL REASONABLE OFFERS.
Key facts
- Shed
- Backing to trees
- Screened porch
Tags
Property features AI
Finance
- Financial info: Rented lot
- HOA & community: Association with amenities including clubhouse, pool, spa/hot tub, tennis courts, pickleball and shuffleboard courts, bocce ball, billiard and game rooms, community room, manager on site; Association covers trash and common real estate tax; Senior community; Pets allowed (restrictions and limits may apply)
Exterior
- Parking: Attached carport
- Utilities: Public water; Public sewer; Three-phase electric; Cable available
- Home design: Manufactured home; Single-story; West-facing
- Construction: Modular construction; Composition/shingle roof; Resale condition
- Exterior features: Non-waterfront; Entry level living area
Interior
- Kitchen: Dishwasher; Electric range; Microwave; Refrigerator
- Bedrooms: 2 bedrooms on the main level
- Flooring: Carpet; Ceramic tile; Laminate
- Bathrooms: 2 full bathrooms on the main level
- Heating & cooling: Central electric heating; Central electric cooling (central air)
- Interior features: Cathedral and vaulted ceilings; Walk-in closet(s); Split bedroom layout
- Laundry & utility: Indoor laundry with washer and dryer hookups
Neighborhood map
What this means for you Summary
Snapshot
- This is a 2-bed/2.0-bath manufactured listed at $75k.
Deal economics
- At list price, monthly cash flow is $1k ($14k/yr) — positive.
- The deal already cash-flows at list — no discount required.
- Meets the 1% rule at list price ($2k rent vs $75k).
- Recommended offer: $66k (12.0% below list) — sets the bar for market timing.
- Cap rate 25.1% vs local median 5.3% in Indian River Estates — top-decile yield for the area; either an underpriced asset or a hidden risk that comps aren't pricing in. Stress-test before assuming the spread holds.
Location & tenants
- Location reads 65/100 on livability (#653 in FL) — a middle-class / working-renter tenant base. Strengths: cost of living A+, housing A+, crime B+; Watch: employment D+, schools F, amenities F.
- St. Lucie (urban): math 40% / reading 48% proficiency, ranked #51 of 73 in FL (top 70%) — families likely to look elsewhere, expect single-tenant / working-renter base with shorter leases.
- Market conditions: Rents rising fast (+7.4%/yr); 336 active listings in the ZIP; 10 comparable units currently listed for rent nearby; rentals at typical pace (median 23d on market — plan ~3-4 weeks tenant-placement turnaround); 4,868 units permitted in St. Lucie County in 2024 (268 in 5+ unit buildings).
- At $2,138/mo this rent would consume 47% of the median local household income ($54k/yr) (locally 1086% of renters already pay >50% of income on rent) — very limited rent-growth headroom before tenants either downsize or default.
Forward outlook
- Local home prices are declining (-3.0%/yr); year-one equity from $518 of loan paydown is wiped out by about $2k of value loss. Plan a longer hold.
- St. Lucie County population projected at +20% by 2050 — long-run rental-demand tailwind backs the buy-and-hold thesis.
- At projected returns (-3.0% appreciation + 7.4% rent growth), your $21k cash investment doubles in ~2 years — after that, you're playing with house money.
Negotiation context
- It's been on market 185 days — a 12% lower offer ($66k) is reasonable based on typical stale-listing flexibility.
- 4 sale attempts since 19y ago with the ask held roughly flat each time — persistent listings suggest the price (not the market) is what's stuck; bring a comps-based counter.
- Current owner paid $20k; list at $75k implies a 281% gain — meaningful room to come down on a strong offer.
Risks & watch-outs
- Climate carrying-cost: severe wind risk, 99% chance of damaging wind over 30y; extreme-heat days projected 7→24/yr by 2055 (HVAC capex compounding) — expect insurance premiums to compound above CPI over the hold.
Questions for the listing agent
- It's been on market 185 days. Have you received any prior offers? Is the seller open to a 12% concession, seller financing, or rate buy-down credit?
- Why hasn't it sold? Are there any deal-killer items the seller is aware of (foundation, flood, title, zoning, code violations)?
- Is there a deadline driving the sale (1031 exchange, divorce, estate, relocation)? That informs how much negotiation room exists.
- Schools are F-rated, which usually means shorter tenancies and higher turnover. Who's the typical renter profile here, and what's been the actual vacancy rate?
- What's the average days-on-market for RENTAL listings here right now (not sales)? A rising rental-DOM trend means longer vacancies and softer asking-rent achievability than the comps imply.
- What's the recent tenant-quality profile in this submarket — average credit score on applications, eviction rate, late-payment / NSF rate, and stable-employment percentage? A property-management company in the area should have these aggregated.
- How much new for-sale + rental construction is in the pipeline within 1–3 miles? Heavy new supply typically softens prices + rents 12–24 months out; constrained supply supports both.
Investment metrics
- 1% rule
- 2.86% ✓
- Cap rate
- 25.07%
- Cash-on-cash
- 67.05%
- DSCR
- 3.98
- GRM
- 2.9
CMA / ARV
- ARV (on-the-fly)
- $132,288
- Comps found
- 2
Show comp detail 2 sales within ~0.75 mi
| Address | Dist | Beds/Ba | Sqft | Sold | Price | $/sf | Match |
|---|---|---|---|---|---|---|---|
| 5683 Hemingway Ct | 0.26mi | 2/2.0 | 1,144 (-8%) | 1mo | $76,800 | $67 | 74 |
| 243 Sea Conch | 0.27mi | 2/2.0 | 1,411 (+13%) | 6mo | $150,000 | $106 | 60 |
Match score weights: distance 35% · size 25% · config 20% · recency 20%. Top-matched comps best support the ARV.
Projected returns pro-forma
-3.0% appreciation · 7.42% rent growth · sell at horizon
- IRR
- 71.3%
- Equity multiple
- 4.45×
- Total profit
- $72,458
- Equity at exit
- $11,168
- IRR
- 76.6%
- Equity multiple
- 10.73×
- Total profit
- $203,984
- Equity at exit
- $6,476
Cash invested: $20,972 (down + closing). Projections, not guarantees.
Landlord ↔ Tenant lean methodology
- Overall (STATE)
- 87 Strongly Landlord-Friendly
- State Florida
- 87 Strongly Landlord-Friendly · R+3
- County
- — inherits STATE
- City
- — inherits STATE
ZIP-level market 34982
- Home prices YoY
- -33.4%
- Rents YoY
- 7.4%
- Active inventory
- 336
- Price-to-rent
- 2.9×
Monthly cashflow live
- Estimated rent
- $2,138 high interval (Pro) →
- Mortgage (P&I)
- −$393
- Tax est. 1.5%
- −$94 /mo · $1,124/yr
- Insurance
- −$31
- HOA
- −$0
- Vacancy / Maint / Mgmt
- −$449
- Net cashflow
- $1,172
Break-even live
UW: 25.0% down · 7.5% · 30yr · 1.5% tax · 5.0% vac · 8.0% maint · 8.0% mgmt
Financing live
Cash to close
- Down payment
- $18,725
- Closing costs
- $2,247
- Reserves months
- —
- Total cash needed
- —
Loan-product check · same deal, 3 products live
Conventional
25% down · 7.5% · 30yr
- Down + closing
- —
- Monthly P&I
- —
- Monthly cashflow
- —
- DSCR
- —
- Eligible?
- —
Personal DTI + credit; lowest rate.
DSCR
20% down · 8.5% · 30yr
- Down + closing
- —
- Monthly P&I
- —
- Monthly cashflow
- —
- DSCR
- —
- Eligible?
- —
No personal income docs; deal must DSCR.
Hard money
10% down · 12.0% · 12mo
- Down + closing
- —
- Monthly P&I
- —
- Monthly cashflow
- —
- DSCR
- —
- Eligible?
- —
Short-term bridge; refi at stabilization.
Rent comps 10 comps
| Address | Beds | Baths | Sqft | Rent | $/sqft | DOM | Units | Dist |
|---|---|---|---|---|---|---|---|---|
| 203 Melton Dr Unit B Fort Pierce, FL | 2.0 | 1.0 | 1200 | $1,800 | $1.50 | 23d | 1 | 0.45mi |
| 341 Ashley St Fort Pierce, FL | 3.0 | 2.0 | 1128 | $2,460 | $2.18 | 23d | 1 | 0.54mi |
| 355 Johnston St Fort Pierce, FL | 3.0 | 1.5 | 1118 | $2,500 | $2.24 | 23d | 1 | 0.61mi |
| 352 Johnston St Fort Pierce, FL | 3.0 | 2.0 | 936 | $2,100 | $2.24 | 23d | 1 | 0.62mi |
| 5300 Seagrape Dr Fort Pierce, FL | 3.0 | 2.0 | 1300 | $2,450 | $1.88 | 23d | 1 | 0.65mi |
| 330 Borraclough St Fort Pierce, FL | 3.0 | 2.0 | 1404 | $2,175 | $1.55 | 13d | 1 | 0.66mi |
| 5315 Hickory Dr Fort Pierce, FL | 3.0 | 2.0 | 1400 | $2,045 | $1.46 | 23d | 1 | 0.80mi |
| 492 Salisbury Cir Fort Pierce, FL | 3.0 | 2.5 | 1486 | $2,395 | $1.61 | 23d | 1 | 0.89mi |
| 526 Salisbury Cir Fort Pierce, FL | 3.0 | 2.5 | 1486 | $2,399 | $1.61 | 13d | 1 | 0.91mi |
| 699 W Weatherbee Rd Fort Pierce, FL | 2.0 | 1.5 | 1100 | $1,875 | $1.70 | 23d | 1 | 1.39mi |
Listing history 25 events
-
2026-06-18days on market $74,900 Active 185 DOM
-
2026-06-17days on market $74,900 Active 184 DOM
-
2026-06-16days on market $74,900 Active 183 DOM
-
2026-06-15days on market $74,900 Active 182 DOM
-
2026-06-14days on market $74,900 Active 180 DOM
-
2026-06-13days on market $74,900 Active 179 DOM
-
2026-06-10days on market $74,900 Active 177 DOM
-
2026-06-09days on market $74,900 Active 176 DOM
-
2026-06-08days on market $74,900 Active 175 DOM
-
2026-06-07days on market $74,900 Active 174 DOM
-
2026-06-05days on market $74,900 Active 171 DOM
-
2026-06-03days on market $74,900 Active 170 DOM
-
2026-06-02days on market $74,900 Active 169 DOM
-
2026-06-01days on market $74,900 Active 168 DOM
-
2026-05-31days on market $74,900 Active 167 DOM
-
2026-05-30days on market $74,900 Active 166 DOM
-
2025-12-12$74,900 Active
-
2013-09-21historical
-
2012-01-27soldstatus $19,650 124-char remark
Show marketing remark (124 chars)
PET FRIENDLY COMMUNITY! COME AND ENJOY THE MANY ACTIVITIES AT THIS ACTIVE COMMUNITY SELLER IS OPEN TO ALL REASONABLE OFFERS.
-
2011-12-13historical 124-char remark
Show marketing remark (124 chars)
PET FRIENDLY COMMUNITY! COME AND ENJOY THE MANY ACTIVITIES AT THIS ACTIVE COMMUNITY SELLER IS OPEN TO ALL REASONABLE OFFERS.
-
2011-07-25$22,900 124-char remark
Show marketing remark (124 chars)
PET FRIENDLY COMMUNITY! COME AND ENJOY THE MANY ACTIVITIES AT THIS ACTIVE COMMUNITY SELLER IS OPEN TO ALL REASONABLE OFFERS.
-
2009-08-06soldstatus $22,500
-
2009-06-29historical
-
2009-06-03$25,000
-
2007-02-23$59,900
ⓘ Source: listings_history table (triggers on properties + properties_extension) + one-shot
backfill from property_details.listing_events for pre-trigger history.
Climate risk First Street
- Flood 1/10 Low FEMA zone X (unshaded) · 0% chance over 30 yrs
- Wildfire 4/10 Moderate
- Heat 10/10 Extreme 7 d/yr ≥106°F today · 24 d/yr by 30 yrs out
- Wind 10/10 Extreme 99% chance of damaging wind over 30 yrs
- Air quality 2/10 Low 1 unhealthy d/yr today · 1 by 30 yrs out
Nearby sold comps map
Loading sold comps map…
Walkable amenities ~0.75 mi
Loading nearby amenities…
Taxation est. · year 1
- Rental income
- $25,661
- − Mortgage interest
- −$4,196
- − Property taxes
- −$1,124
- − Insurance
- −$374
- − Repairs & maintenance
- −$2,053
- − Management
- −$2,053
- − Depreciation
- −$2,179
- Taxable income
- $13,683
- Est. tax owed @ 24.0%
- −$3,284
- After-tax cash flow
- $10,777/yr
For passive investors: Depreciation is non-cash, so a rental often shows a tax loss while cash-flowing — sheltering income. Rental losses are passive: they offset passive income freely, and up to $25,000/yr can offset ordinary (W-2) income if you actively participate and your MAGI is under $100k (phasing out to $0 by $150k); unused losses carry forward. On sale, claimed depreciation is recaptured at up to 25%, and gains may owe capital-gains tax (a 1031 exchange can defer both). Figures are a year-1 estimate at your 24.0% rate — not tax advice; consult a CPA.
Schools (NCES district)
- District
- St. Lucie
- NCES district ID
- 1201770
- Math proficiency
- 40% ▼ -11.00%
- Reading proficiency
- 48% ▼ -4.00%
- Median HH income
- $44,737
- Composite
- 37.28/100
- National rank
- #4449
- State rank
- #51 of 73 in FL
Livability — Indian River Estates
- Score
- 65/100
- State rank
- #653
- US rank
- #12946
Category grades
Schools grade is shown separately in the Schools card above.
Census & demographics
- Census place
- Indian River Estates, FL
- County
- Saint Lucie County · 337,150 people
- City population
- 27,447
- Metro
- Port St. Lucie, FL
- Population (ZIP)
- 31,143
- Household income
- $54,082
- Rent vs Own
- Severe rent burden
- 1086.0
Population outlook (St. Lucie County) Hauer SSP2
- Today (2025)
- 338,016 people
- By 2030
- 355,687 · +5.2%
- By 2040
- 385,521 · +14.1%
- By 2050
- 406,106 · +20.1%
- By 2075
- 441,054 · +30.5%
- By 2100
- 436,885 · +29.2%
Race, ethnicity, and origin ACS 2023
- Neighborhood character
- Majority White (62%)
- Race & ethnicity
- White 62% Hispanic / Latino 22% Two or more races 12% Black 12%
- Hispanic origin (detail)
- Mexican 10% Puerto Rican 3% Cuban 3%
- Common ancestry
- Italian 7% Hispanic 2% Lithuanian 1%
- Foreign-born
- 12% · Canada
- Languages at home
- 80% English-only · Spanish 16% French/Haitian/Cajun 3%
Political lean MEDSL · St. Lucie
- 2024 margin
- Lean R (+9.1) · D 45.1% · R 54.2%
- 2008→2024 swing
- -21.2pp toward R · 2008: 12.1pp · 2024: -9.1pp
- All cycles
- 2024: R+9.1 2020: R+1.6 2016: R+2.5 2012: D+7.9 2008: D+12.1
Not yet ingested
- Civics
- —
Market trends
- HPI YoY
- ▼ -199.47%
- Current HPI
- 397.2649
- Rent YoY
- ▲ 7.42%
- Metro
- Port St. Lucie, FL
- State GDP YoY
- ▲ 3.28%
- F500 in state
- 36
Industry mix (Fortune 500 HQ in FL)
| Industry | F500 HQs | Revenue |
|---|---|---|
| Industrial Technology | 2 | $29B |
|
||
| Insurance | 2 | $17B |
|
||
| Retail | 1 | $60B |
|
||
| Technology Distribution | 1 | $58B |
|
||
| Homebuilding | 1 | $35B |
|
||
| Technology Manufacturing | 1 | $35B |
|
||
Price history
+25.0% since first listed9 events — show timeline
- 2025-12-12 Listed $74,900 Beaches MLS
- 2013-09-21 Listing Removed — Beaches MLS
- 2012-01-27 Sold (MLS) $19,650 Beaches MLS
- 2011-12-13 Listing Removed — Beaches MLS
- 2011-07-25 Listed $22,900 Beaches MLS
- 2009-08-06 Sold (MLS) $22,500 Beaches MLS
- 2009-06-29 Listing Removed — Beaches MLS
- 2009-06-03 Listed $25,000 Beaches MLS
- 2007-02-23 Listed $59,900 Beaches MLS
Cash-flow waterfall
monthlySold comps — $/sqft
last 12 mo · ≤1 miLoading sold comps…