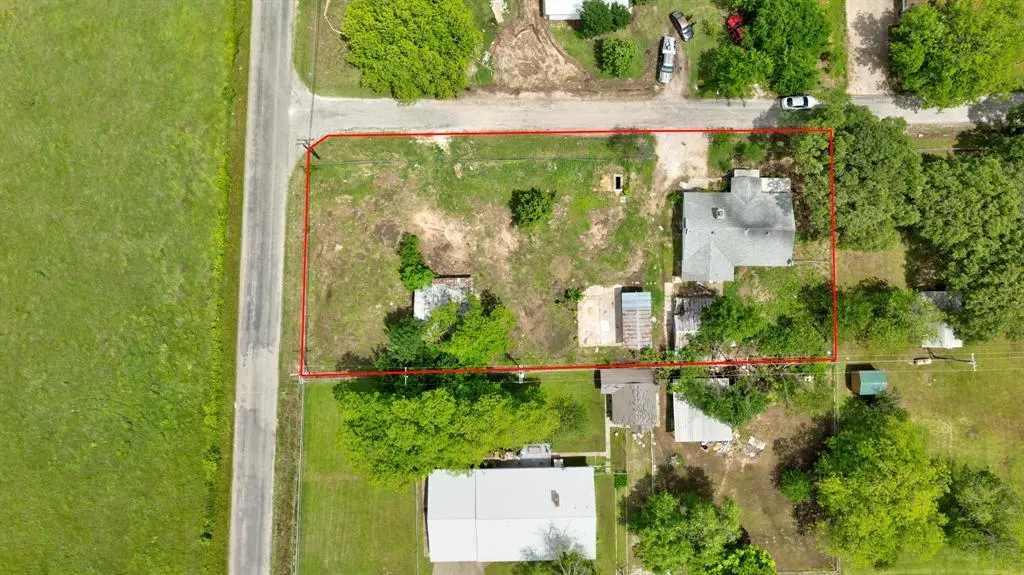
43 Pueblo · Sherwood Shores, TX
Flood risk 1/10 · Minimal
- FEMA flood zone
- X (unshaded)
- Chance of flooding over 30 yrs
- 0.0%
- Est. flood insurance / yr
- $507 – $1,088
Fire risk 6/10 · Moderate
- Est. fire insurance / yr
- $1,222 – $2,270
Heat risk 6/10 · Moderate
- Hot days now (above 109°F)
- 7 days/yr
- Hot days in 30 yrs
- 20 days/yr
Wind risk 4/10 · Minor
- Chance of severe wind over 30 yrs
- 18.0%
Air-quality risk 3/10 · Minor
- Unhealthy air days now
- 3 days/yr
- Unhealthy air days in 30 yrs
- 3 days/yr
Risk factors via First Street. Map © Google.
Why this score? — see what drove the C- grade
The composite is a weighted blend of 9 inputs, each scored 0–100. Each bar is that input's sub-score; the figure is the points it added to the 100-point composite (weight × sub-score).
- ARV discount +15.0/15.0
- Cash flow +13.1/30.0
- Appreciation +5.0/10.0
- DSCR +3.9/10.0
- Schools +3.8/10.0
- 1% rule +3.5/10.0
- Rent growth +2.5/5.0
- Livability +2.5/5.0
- Condition / age +2.5/5.0
$135,999
🖨 Deal sheet 📄 Offer letter ✓ Due diligence
Listing remarks
Investor Special! Spacious Lot in Prime Location – Minutes from Lake Texoma & Casinos! Don’t miss this opportunity! This large lot offers endless potential and is perfect for investors or anyone ready to make a property truly shine. Just a short drive to Lake Texoma and popular casinos, this location is ideal for both relaxation and entertainment. Plenty of space for RVs, outdoor additions, or future development. Put your personal touch on this property and turn it into something special!
Key facts
- Future development
- Outdoor additions
- Spacious lot
Tags
Property features AI
Finance
- Financial info: Treat as clear loan type; No second mortgage
- HOA & community: No association
Exterior
- Parking: 4-car garage; 2-car carport; Covered parking for 6 vehicles; Oversized parking; RV access/parking
- Utilities: Co-op electric; Co-op water; Not in a municipal utility district
- Home design: Single-family residence; Residential property; One story; Attached; Subdivision: SHERWOOD SHORES; Water access: Texoma
- Construction: Built in 1978; Composition roof
- Exterior features: Chain link fencing; Corner lot; Outbuilding, shed(s), workshop; RV/boat storage
Interior
- Kitchen: Includes appliances (unspecified)
- Bedrooms: 3 bedrooms (all on main level)
- Bathrooms: 2 full bathrooms
- Heating & cooling: Ceiling fans; Other heating; Other cooling
- Interior features: Eat-in kitchen; One living area; One dining area; 3 total rooms
- Laundry & utility: Utility features unspecified
Neighborhood map
What this means for you Summary
Snapshot
- This is a 3-bed/2.0-bath single-family listed at $136k.
Deal economics
- At list price, monthly cash flow is $-5 ($-55/yr) — negative.
- To cash-flow at today's rent, offer at most $135k (0.6% below list).
- To meet the 1% rule (rent ≥ 1% of price), the offer needs to be $115k (15.3% below list).
- Recommended offer: $115k (15.3% below list) — sets the bar for 1% rule.
- Cap rate 6.3% vs local median 2.8% in Sherwood Shores — top-decile yield for the area; either an underpriced asset or a hidden risk that comps aren't pricing in. Stress-test before assuming the spread holds.
Location & tenants
- Location reads 49/100 on livability (#1,519 in TX) — a working-class tenant base; expect higher turnover. Strengths: cost of living A+, housing A+; Watch: crime F, amenities F, commute F.
- Whitesboro ISD (town): math 43% / reading 46% proficiency, ranked #272 of 826 in TX (top 33%) — families likely to look elsewhere, expect single-tenant / working-renter base with shorter leases.
- Zoned schools: Whitesboro Int (math 39% / reading 46%, grade F, #1,313 of 4,322 statewide, top 31%, 386 students, 58% FRL).
- Market conditions: 354 active listings in the ZIP; 2,272 units permitted in Grayson County in 2024 (750 in 5+ unit buildings).
Forward outlook
- In year one you build about $850 of equity ($940 loan paydown + $-90 appreciation (-0.1% local appreciation)).
- Grayson County population projected at +12% by 2050 — modest demand growth; plan on rents tracking national, not racing it.
Negotiation context
- It's been on market 46 days — a 3% lower offer ($132k) is reasonable based on typical stale-listing flexibility.
- 2 sale attempts with the ask held roughly flat each time — persistent listings suggest the price (not the market) is what's stuck; bring a comps-based counter.
Risks & watch-outs
- Climate carrying-cost: major wildfire risk; extreme-heat days projected 7→20/yr by 2055 (HVAC capex compounding) — expect insurance premiums to compound above CPI over the hold.
Questions for the listing agent
- What do current leases actually rent for vs. the listed asking? Can we see a recent rent roll and the last 12 months of T-12 income?
- It's been on market 46 days. Have you received any prior offers? Is the seller open to a 15% concession, seller financing, or rate buy-down credit?
- Built in 1978 — when were the roof, HVAC, electrical panel, plumbing, and water heater last replaced?
- Is there a deadline driving the sale (1031 exchange, divorce, estate, relocation)? That informs how much negotiation room exists.
- Schools are F-rated, which usually means shorter tenancies and higher turnover. Who's the typical renter profile here, and what's been the actual vacancy rate?
- Crime grade is F in this area — have there been break-ins, vandalism, or insurance claims at this property in the last 3 years? What carrier currently insures it and at what premium?
- What's the average days-on-market for RENTAL listings here right now (not sales)? A rising rental-DOM trend means longer vacancies and softer asking-rent achievability than the comps imply.
- What's the recent tenant-quality profile in this submarket — average credit score on applications, eviction rate, late-payment / NSF rate, and stable-employment percentage? A property-management company in the area should have these aggregated.
- How much new for-sale + rental construction is in the pipeline within 1–3 miles? Heavy new supply typically softens prices + rents 12–24 months out; constrained supply supports both.
Investment metrics
- 1% rule
- 0.85% ✗
- Cap rate
- 6.25%
- Cash-on-cash
- -0.14%
- DSCR
- 0.99
- GRM
- 9.8
CMA / ARV
- ARV (median comp)
- $182,016
- List price
- $135,999
- Delta
- -25.28%
- Verdict
- UNDERPRICED
- Comps
- 20 within 1.0 mi
Show comp detail 9 sales within ~0.75 mi
| Address | Dist | Beds/Ba | Sqft | Sold | Price | $/sf | Match |
|---|---|---|---|---|---|---|---|
| 1068 Hillcrest Cir | 0.21mi | 2/1.0 (-1) | 1,008 (+5%) | 6mo | $125,000 | $124 | 68 |
| 359 Pawnee Dr | 0.42mi | 2/2.0 (-1) | 1,008 (+5%) | 7mo | $110,000 | $109 | 62 |
| 2225 Hillcrest Cir | 0.47mi | 3/1.0 | 1,000 (+4%) | 10mo | $153,500 | $154 | 59 |
| 350 Pawnee Dr | 0.44mi | 2/1.0 (-1) | 1,064 (+11%) | 10mo | $17,500 | $16 | 44 |
| 266 Yorkshire Dr | 0.51mi | 2/1.0 (-1) | 840 (-12%) | 9mo | $115,000 | $137 | 39 |
| 72 Meadow Ln | 0.58mi | 2/1.0 (-1) | 907 (-6%) | 22mo | $169,000 | $186 | 36 |
| 234 Allen A Dale Dr | 0.53mi | 2/1.0 (-1) | 1,092 (+14%) | 15mo | $142,000 | $130 | 31 |
| 1939 Hillcrest Cir | 0.65mi | 2/1.0 (-1) | 1,096 (+14%) | 11mo | $163,500 | $149 | 28 |
| 1504 Lake Rd | 0.73mi | 2/1.0 (-1) | 1,053 (+10%) | 22mo | $225,000 | $214 | 23 |
Match score weights: distance 35% · size 25% · config 20% · recency 20%. Top-matched comps best support the ARV.
Projected returns pro-forma
-0.07% appreciation · 3.0% rent growth · sell at horizon
- IRR
- -2.6%
- Equity multiple
- 0.88×
- Total profit
- $-4,690
- Equity at exit
- $39,040
- IRR
- 3.2%
- Equity multiple
- 1.34×
- Total profit
- $12,915
- Equity at exit
- $46,571
Cash invested: $38,080 (down + closing). Projections, not guarantees.
Landlord ↔ Tenant lean methodology
- Overall (STATE)
- 87 Strongly Landlord-Friendly
- State Texas
- 87 Strongly Landlord-Friendly · R+5
- County
- — inherits STATE
- City
- — inherits STATE
ZIP-level market 76245
- Home prices YoY
- -0.1%
- Active inventory
- 354
- Price-to-rent
- 9.8×
Monthly cashflow live
- Estimated rent
- $1,152 medium interval (Pro) →
- Mortgage (P&I)
- −$713
- Tax from tax record
- −$145 /mo · $1,741/yr
- Insurance
- −$57
- HOA
- −$0
- Vacancy / Maint / Mgmt
- −$242
- Net cashflow
- $-5
Break-even live
UW: 25.0% down · 7.5% · 30yr · 1.5% tax · 5.0% vac · 8.0% maint · 8.0% mgmt
Financing live
Cash to close
- Down payment
- $34,000
- Closing costs
- $4,080
- Reserves months
- —
- Total cash needed
- —
Loan-product check · same deal, 3 products live
Conventional
25% down · 7.5% · 30yr
- Down + closing
- —
- Monthly P&I
- —
- Monthly cashflow
- —
- DSCR
- —
- Eligible?
- —
Personal DTI + credit; lowest rate.
DSCR
20% down · 8.5% · 30yr
- Down + closing
- —
- Monthly P&I
- —
- Monthly cashflow
- —
- DSCR
- —
- Eligible?
- —
No personal income docs; deal must DSCR.
Hard money
10% down · 12.0% · 12mo
- Down + closing
- —
- Monthly P&I
- —
- Monthly cashflow
- —
- DSCR
- —
- Eligible?
- —
Short-term bridge; refi at stabilization.
Listing history 20 events
-
2026-06-19days on market $135,999 Active 46 DOM
-
2026-06-18days on market $135,999 Active 45 DOM
-
2026-06-17days on market $135,999 Active 44 DOM
-
2026-06-16days on market $135,999 Active 43 DOM
-
2026-06-15days on market $135,999 Active 42 DOM
-
2026-06-14days on market $135,999 Active 40 DOM
-
2026-06-12days on market $135,999 Active 39 DOM
-
2026-06-09days on market $135,999 Active 36 DOM
-
2026-06-08days on market $135,999 Active 35 DOM
-
2026-06-03days on market $135,999 Active 30 DOM
-
2026-06-02days on market $135,999 Active 29 DOM
-
2026-06-01days on market $135,999 Active 28 DOM
-
2026-05-31days on market $135,999 Active 27 DOM
-
2026-05-30days on market $135,999 Active 26 DOM
-
2026-05-04$143,000 Active 515-char remark
-
2026-01-26historical
-
2025-07-26price $140,000
-
2025-05-09$145,000 Active
-
2025-03-18soldstatus
-
1993-06-30soldstatus
ⓘ Source: listings_history table (triggers on properties + properties_extension) + one-shot
backfill from property_details.listing_events for pre-trigger history.
Tax reassessment forecast TX · Resets to sale price
- Current annual tax
- $1,741 · $145/mo
- Projected year-2 tax
- $2,489 · $207/mo
- Expected delta
- +$748/yr (+$62/mo · 43.0%)
ⓘ Screening estimate from a state-policy table — verify with the county assessor before closing.
Climate risk First Street
- Flood 1/10 Low FEMA zone X (unshaded) · 0% chance over 30 yrs
- Wildfire 6/10 Major
- Heat 6/10 Major 7 d/yr ≥109°F today · 20 d/yr by 30 yrs out
- Wind 4/10 Moderate 18% chance of damaging wind over 30 yrs
- Air quality 3/10 Moderate 3 unhealthy d/yr today · 3 by 30 yrs out
Nearby sold comps map
Loading sold comps map…
Walkable amenities ~0.75 mi
Loading nearby amenities…
Taxation est. · year 1
- Rental income
- $13,828
- − Mortgage interest
- −$7,618
- − Property taxes
- −$1,741
- − Insurance
- −$680
- − Repairs & maintenance
- −$1,106
- − Management
- −$1,106
- − Depreciation
- −$3,956
- Taxable loss
- −$2,380
- Est. tax savings @ 24.0%
- +$571
- After-tax cash flow
- $516/yr
For passive investors: Depreciation is non-cash, so a rental often shows a tax loss while cash-flowing — sheltering income. Rental losses are passive: they offset passive income freely, and up to $25,000/yr can offset ordinary (W-2) income if you actively participate and your MAGI is under $100k (phasing out to $0 by $150k); unused losses carry forward. On sale, claimed depreciation is recaptured at up to 25%, and gains may owe capital-gains tax (a 1031 exchange can defer both). Figures are a year-1 estimate at your 24.0% rate — not tax advice; consult a CPA.
Schools (NCES district)
- District
- Whitesboro ISD
- NCES district ID
- 4845630
- Math proficiency
- 43% ▼ -14.00%
- Reading proficiency
- 46% ▼ -4.00%
- Median HH income
- $49,672
- Composite
- 38.19/100
- National rank
- #4260
- State rank
- #272 of 826 in TX
Livability — Sherwood Shores
- Score
- 49/100
- State rank
- #1519
- US rank
- #25941
Category grades
Schools grade is shown separately in the Schools card above.
Census & demographics
- Census place
- Sherwood Shores, TX
- Population (ZIP)
- 1,778
Population outlook (Grayson County) Hauer SSP2
- Today (2025)
- 134,540 people
- By 2030
- 138,653 · +3.1%
- By 2040
- 145,958 · +8.5%
- By 2050
- 151,218 · +12.4%
- By 2075
- 161,802 · +20.3%
- By 2100
- 159,036 · +18.2%
Race, ethnicity, and origin ACS 2023
- Neighborhood character
- Predominantly White (88%)
- Race & ethnicity
- White 88% Two or more races 6% Hispanic / Latino 5% Asian 3% Native American 1%
- Common ancestry
- Portuguese 3% Romanian 3% Slovak 2%
- Foreign-born
- 3% · Vietnam
- Languages at home
- 92% English-only · Spanish 5% Vietnamese 3%
Political lean MEDSL · Grayson
- 2024 margin
- Solid R (+54.3) · D 22.5% · R 76.7%
- 2008→2024 swing
- -16.4pp toward R · 2008: -37.9pp · 2024: -54.3pp
- All cycles
- 2024: R+54.3 2020: R+49.9 2016: R+53.1 2012: R+48.0 2008: R+37.9
Not yet ingested
- Civics
- —
Market trends
- HPI YoY
- ▼ -0.07%
- Current HPI
- 130.9903
- Rent YoY
- —
- Metro
- —
- State GDP YoY
- ▲ 3.95%
- F500 in state
- 110
Industry mix (Fortune 500 HQ in TX)
| Industry | F500 HQs | Revenue |
|---|---|---|
| Energy | 16 | $1,198B |
|
||
| Technology | 5 | $198B |
|
||
| Engineering / Construction | 4 | $72B |
|
||
| Energy Services | 3 | $60B |
|
||
| Utilities | 3 | $41B |
|
||
| Healthcare | 2 | $330B |
|
||
Price history
-6.2% since first listed7 events — show timeline
- 2026-05-21 Price Changed $135,999 NTREIS
- 2026-05-04 Listed $143,000 NTREIS
- 2026-01-26 Listing Removed — NTREIS
- 2025-07-26 Price Changed $140,000 NTREIS
- 2025-05-09 Listed $145,000 NTREIS
- 2025-03-18 Sold (Public Records) — Public Records
- 1993-06-30 Sold (Public Records) — Public Records
Property tax history
+0.6%/yrLatest (2025): $1,741 · -15.1% YoY. Source: county tax records.
Cash-flow waterfall
monthlySold comps — $/sqft
last 12 mo · ≤1 miLoading sold comps…