204 Kingsley Dr · Blythewood, SC
Flood risk No data
- FEMA flood zone
- —
- Chance of flooding over 30 yrs
- —
- Est. flood insurance / yr
- —
Fire risk No data
- Est. fire insurance / yr
- —
Heat risk No data
- Hot days now (above threshold)
- —
- Hot days in 30 yrs
- —
Wind risk No data
- Chance of severe wind over 30 yrs
- —
Air-quality risk No data
- Unhealthy air days now
- —
- Unhealthy air days in 30 yrs
- —
Risk factors via First Street. Map © Google.
Why this score? — see what drove the C grade
The composite is a weighted blend of 9 inputs, each scored 0–100. Each bar is that input's sub-score; the figure is the points it added to the 100-point composite (weight × sub-score).
- Cash flow +19.6/30.0
- ARV discount +12.1/15.0
- DSCR +6.2/10.0
- 1% rule +5.2/10.0
- Condition / age +4.0/5.0
- Schools +3.6/10.0
- Livability +3.5/5.0
- Rent growth +2.5/5.0
- Appreciation +0.0/10.0
$313,767
🖨 Deal sheet 📄 Offer letter ✓ Due diligence
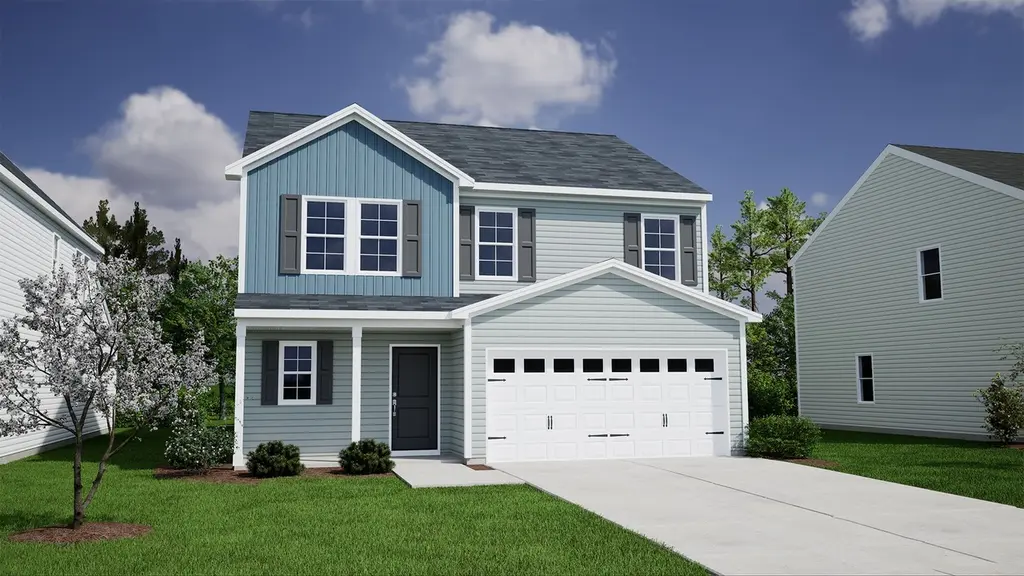
Listing remarks
The Rutherford on a great homesite that backs up to protected trees, offers the perfect balance of comfort and flexibility with spacious bedrooms and ample baths. A charming front porch welcomes you inside, where the open layout begins with a bright eat-in area that flows into the kitchen and spacious great room. Super-sized great room with natural gas fireplace, white mantle and Italian slate hearth surround. The first-floor primary suite includes dual-sink vanity, garden tub and separate tiled shower, with a generous walk-in closet, with the laundry room conveniently nearby. Kitchen includes Elkins Purestyle Stone Gray cabinets with crown on top, cabinet hardware, soft close doors, upgrad
Key facts
- Charming front porch
- Open layout
- Italian slate hearth
Tags
Property features AI
Finance
- Financial info: List price $313,767
Exterior
- Parking: 2-car garage (2 total parking spaces)
- Home design: Single-family property (Rutherford plan)
- Exterior features: Living area approximately 2,631
Interior
- Bedrooms: 5 bedrooms
- Bathrooms: 3 full bathrooms and 1 half bathroom (3.5 total)
- Interior features: Spec home (Rutherford plan)
Neighborhood map
What this means for you Summary
Snapshot
- This is a 5-bed/3.5-bath single-family listed at $314k. Condition is rated good.
Deal economics
- At list price, monthly cash flow is $359 ($4k/yr) — positive.
- The deal already cash-flows at list — no discount required.
- Meets the 1% rule at list price ($3k rent vs $314k).
Location & tenants
- Location reads 70/100 on livability (#58 in SC) — a middle-class / working-renter tenant base. Strengths: crime A+, employment A+, housing A+; Watch: amenities F, commute F, health & safety F.
- Richland 02 (suburban): math 35% / reading 47% proficiency, ranked #29 of 80 in SC (top 36%) — families likely to look elsewhere, expect single-tenant / working-renter base with shorter leases.
- Market conditions: 650 active listings in the ZIP; 2 comparable units currently listed for rent nearby; solid renter incomes; 3,472 units permitted in Richland County in 2024 (1,096 in 5+ unit buildings).
- This rent runs 40% of the median local income ($95k/yr) — at the standard rent-burdened threshold; future hikes will face affordability resistance.
Forward outlook
- Local home prices are declining (-3.0%/yr); year-one equity from $2k of loan paydown is wiped out by about $9k of value loss. Plan a longer hold.
- Richland County population projected at +30% by 2050 — long-run rental-demand tailwind backs the buy-and-hold thesis.
Negotiation context
- Only 9 days on market — expect competitive offers; lowballing is unlikely to land.
Questions for the listing agent
- Is there a deadline driving the sale (1031 exchange, divorce, estate, relocation)? That informs how much negotiation room exists.
- Schools are B-rated — typically a magnet for longer-tenancy family renters. What's the average tenant stay here, and is there a school-zone premium baked into asking?
- What's the average days-on-market for RENTAL listings here right now (not sales)? A rising rental-DOM trend means longer vacancies and softer asking-rent achievability than the comps imply.
- What's the recent tenant-quality profile in this submarket — average credit score on applications, eviction rate, late-payment / NSF rate, and stable-employment percentage? A property-management company in the area should have these aggregated.
- How much new for-sale + rental construction is in the pipeline within 1–3 miles? Heavy new supply typically softens prices + rents 12–24 months out; constrained supply supports both.
Investment metrics
- 1% rule
- 1.02% ✓
- Cap rate
- 7.67%
- Cash-on-cash
- 4.91%
- DSCR
- 1.22
- GRM
- 8.2
CMA / ARV
- ARV (on-the-fly)
- $349,923
- Comps found
- 1
Show comp detail 1 sale within ~0.75 mi
| Address | Dist | Beds/Ba | Sqft | Sold | Price | $/sf | Match |
|---|---|---|---|---|---|---|---|
| 1029 Heart Pine Dr | 0.67mi | 5/3.0 | 2,720 (+3%) | 14mo | $362,900 | $133 | 49 |
Match score weights: distance 35% · size 25% · config 20% · recency 20%. Top-matched comps best support the ARV.
Projected returns pro-forma
-3.0% appreciation · 3.0% rent growth · sell at horizon
- IRR
- -8.6%
- Equity multiple
- 0.68×
- Total profit
- $-27,901
- Equity at exit
- $46,784
- IRR
- 0.9%
- Equity multiple
- 1.06×
- Total profit
- $5,380
- Equity at exit
- $27,129
Cash invested: $87,855 (down + closing). Projections, not guarantees.
Landlord ↔ Tenant lean methodology
- Overall (STATE)
- 90 Strongly Landlord-Friendly
- State South Carolina
- 90 Strongly Landlord-Friendly · R+6
- County
- — inherits STATE
- City
- — inherits STATE
ZIP-level market 29016
- Home prices YoY
- -26.3%
- Active inventory
- 650
- Price-to-rent
- 8.2×
Monthly cashflow live
- Estimated rent
- $3,200 medium interval (Pro) →
- Mortgage (P&I)
- −$1,645
- Tax est. 1.5%
- −$392 /mo · $4,707/yr
- Insurance
- −$131
- HOA
- −$0
- Vacancy / Maint / Mgmt
- −$672
- Net cashflow
- $359
Break-even live
UW: 25.0% down · 7.5% · 30yr · 1.5% tax · 5.0% vac · 8.0% maint · 8.0% mgmt
Financing live
Cash to close
- Down payment
- $78,442
- Closing costs
- $9,413
- Reserves months
- —
- Total cash needed
- —
Loan-product check · same deal, 3 products live
Conventional
25% down · 7.5% · 30yr
- Down + closing
- —
- Monthly P&I
- —
- Monthly cashflow
- —
- DSCR
- —
- Eligible?
- —
Personal DTI + credit; lowest rate.
DSCR
20% down · 8.5% · 30yr
- Down + closing
- —
- Monthly P&I
- —
- Monthly cashflow
- —
- DSCR
- —
- Eligible?
- —
No personal income docs; deal must DSCR.
Hard money
10% down · 12.0% · 12mo
- Down + closing
- —
- Monthly P&I
- —
- Monthly cashflow
- —
- DSCR
- —
- Eligible?
- —
Short-term bridge; refi at stabilization.
Rent comps 2 comps
| Address | Beds | Baths | Sqft | Rent | $/sqft | DOM | Units | Dist |
|---|---|---|---|---|---|---|---|---|
| 830 Wing Stripe Ct Columbia, SC | 5.0 | 3.5 | 3044 | $2,395 | $0.79 | 3d | 1 | 1.02mi |
| 621 Heron Glen Dr Columbia, SC | 4.0 | 2.5 | 2195 | $2,095 | $0.95 | 3d | 1 | 1.43mi |
Listing history 8 events
-
2026-06-18days on market $313,767 Active 9 DOM
-
2026-06-17days on market $313,767 Active 8 DOM
-
2026-06-16days on market $313,767 Active 7 DOM
-
2026-06-15days on market $313,767 Active 6 DOM
-
2026-06-14days on market $313,767 Active 4 DOM
-
2026-06-13days on market $313,767 Active 3 DOM
-
2026-06-10remarks 699-char remark
-
2026-06-10$313,767 Active 1 DOM
ⓘ Source: listings_history table (triggers on properties + properties_extension) + one-shot
backfill from property_details.listing_events for pre-trigger history.
Nearby sold comps map
Loading sold comps map…
Walkable amenities ~0.75 mi
Loading nearby amenities…
Taxation est. · year 1
- Rental income
- $38,397
- − Mortgage interest
- −$17,576
- − Property taxes
- −$4,707
- − Insurance
- −$1,569
- − Repairs & maintenance
- −$3,072
- − Management
- −$3,072
- − Depreciation
- −$9,128
- Taxable loss
- −$725
- Est. tax savings @ 24.0%
- +$174
- After-tax cash flow
- $4,488/yr
For passive investors: Depreciation is non-cash, so a rental often shows a tax loss while cash-flowing — sheltering income. Rental losses are passive: they offset passive income freely, and up to $25,000/yr can offset ordinary (W-2) income if you actively participate and your MAGI is under $100k (phasing out to $0 by $150k); unused losses carry forward. On sale, claimed depreciation is recaptured at up to 25%, and gains may owe capital-gains tax (a 1031 exchange can defer both). Figures are a year-1 estimate at your 24.0% rate — not tax advice; consult a CPA.
Condition & rehab AI · 4 photos
This home is in good condition with a good condition score of 80. It is move-in ready with a cosmetic rehab level and minimal repairs needed. The highest-ROI updates include painting, kitchen countertop replacement, new bathroom flooring, and smart home features.
Value-add opportunities
- Both Painting exterior and interior — Enhances curb appeal and interior aesthetics
- Both Replace kitchen countertops — Upgrades the kitchen and adds value
- Both Install new flooring in bathrooms — Improves aesthetics and functionality
- Both Add smart home features — Enhances comfort and marketability
Renovation cost estimate screening
Value-add ROI direction
- Both Painting exterior and interior — Enhances curb appeal and interior aesthetics ↑
- Both Replace kitchen countertops — Upgrades the kitchen and adds value ↑
- Both Install new flooring in bathrooms — Improves aesthetics and functionality ↑
- Both Add smart home features — Enhances comfort and marketability ↑
ⓘ Cost ranges are severity-bucket heuristics (US national rule-of-thumb). Get contractor quotes + a written scope before underwriting a rehab budget.
Schools (NCES district)
- District
- Richland 02
- NCES district ID
- 4503390
- Math proficiency
- 35% ▼ -15.00%
- Reading proficiency
- 47% ▼ -5.00%
- Median HH income
- $59,684
- Composite
- 36.2/100
- National rank
- #4730
- State rank
- #29 of 80 in SC
Livability — Blythewood
- Score
- 70/100
- State rank
- #58
- US rank
- #7406
Category grades
Schools grade is shown separately in the Schools card above.
Census & demographics
- County
- Richland County · 389,530 people
- City population
- 30,454
- Metro
- Columbia, SC
- Population (ZIP)
- 30,454
- Household income
- $95,082
- Rent vs Own
- Severe rent burden
- 559.0
Population outlook (Richland County) Hauer SSP2
- Today (2025)
- 459,667 people
- By 2030
- 487,524 · +6.1%
- By 2040
- 542,035 · +17.9%
- By 2050
- 595,371 · +29.5%
- By 2075
- 732,998 · +59.5%
- By 2100
- 820,415 · +78.5%
Race, ethnicity, and origin ACS 2023
- Neighborhood character
- Diverse neighborhood (Simpson 0.64)
- Race & ethnicity
- Black 43% White 42% Two or more races 7% Hispanic / Latino 7% Asian 3%
- Hispanic origin (detail)
- Mexican 1% Puerto Rican 2%
- Common ancestry
- Lithuanian 2% Romanian 2% Slovak 2%
- Foreign-born
- 5% · Canada, China
- Languages at home
- 90% English-only · Spanish 5% Other Indo-European 1% German/W. Germanic 1%
Political lean MEDSL · Richland
- 2024 margin
- Solid D (+34.6) · D 66.4% · R 31.8% · Other 1.8%
- 2008→2024 swing
- +5.7pp toward D · 2008: 28.9pp · 2024: 34.6pp
- All cycles
- 2024: D+34.6 2020: D+38.3 2016: D+32.9 2012: D+33.3 2008: D+28.9
Not yet ingested
- Civics
- —
Market trends
- HPI YoY
- ▼ -65.48%
- Current HPI
- 183.5933
- Rent YoY
- —
- Metro
- Columbia, SC
- State GDP YoY
- ▲ 4.51%
- F500 in state
- 2
Industry mix (Fortune 500 HQ in SC)
| Industry | F500 HQs | Revenue |
|---|---|---|
| Packaging | 1 | $7B |
|
||
Cash-flow waterfall
monthlySold comps — $/sqft
last 12 mo · ≤1 miLoading sold comps…