 6-Plex
106 E Bayview Ave · Homer, AK
Flood risk 1/10 · Minimal
- FEMA flood zone
- D
- Chance of flooding over 30 yrs
- 0.0%
- Est. flood insurance / yr
- $544 – $1,084
Fire risk No data
- Est. fire insurance / yr
- —
Heat risk No data
- Hot days now (above threshold)
- —
- Hot days in 30 yrs
- —
Wind risk No data
- Chance of severe wind over 30 yrs
- —
Air-quality risk 1/10 · Minimal
- Unhealthy air days now
- —
- Unhealthy air days in 30 yrs
- —
Risk factors via First Street. Map © Google.
Why this score? — see what drove the B- grade
The composite is a weighted blend of 9 inputs, each scored 0–100. Each bar is that input's sub-score; the figure is the points it added to the 100-point composite (weight × sub-score).
- Cash flow +30.0/30.0
- 1% rule +10.0/10.0
- DSCR +10.0/10.0
- ARV discount +6.6/15.0
- Livability +3.9/5.0
- Schools +3.7/10.0
- Rent growth +2.5/5.0
- Condition / age +2.5/5.0
- Appreciation +0.0/10.0
$687,000
🖨 Deal sheet (PDF) 📄 Offer letter ✓ Due diligence
Multi-family units
County records classify this as Multi-Family (5+ Unit). Listing-text estimate: 6 units. confirmed
5+ unit building — per-unit beds/baths from public records are typically unavailable; the breakdown below (if shown) is an estimate from the listing text.
Listing remarks
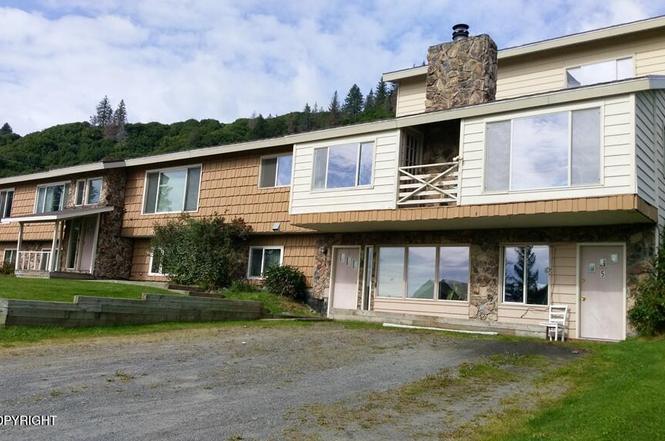
Investment Opportunity! 6,512 SQFT Multifamily Gem on Spacious Lot! Ideal Location near South Peninsula Hospital and Karen Hornaday Park. Well-Maintained 6-unit Property is Fully Occupied with Reliable Long-Term Tenants, Coin-Operated Laundry & Individual Metered Natural Gas! Priced to Sell, this is a Rare Chance to Secure a Lucrative Property in a Prime Location. Call Now to Schedule Viewing New Roof 2022 Natural Gas All Units 106 Bay View Rents Unit 1 $1039.25 Unit 2 $1000 Unit 3 $1039.25 Unit 4 $1039.25 Unit 5 $939.25 Unit 6 $1439.25
Key facts
- Long term tenants
- Six unit multifamily
- Convenient location
Tags
Property features AI
Exterior
- Parking: 6 open parking spaces; No attached garage or carport
- Utilities: Public sewer
- Home design: Multi-family property; Built in 1976; Single entry facing information not provided
- Construction: Wood frame construction; Composition/asphalt shingle roof
- Exterior features: Paved road access
Interior
- Bedrooms: 12 total bedrooms
- Bathrooms: 7 total bathrooms (4 full, 2 three-quarter, 1 half)
- Interior features: Multiple bathrooms across the building
Neighborhood map
What this means for you Summary
Snapshot
- This is a 6 × 2-bed/1.1-bath units multifamily listed at $687k.
Deal economics
- At list price, monthly cash flow is $5k ($60k/yr) — positive. Per door: $833/mo.
- The deal already cash-flows at list — no discount required.
- Meets the 1% rule at list price ($12k rent vs $687k).
- Recommended offer: $605k (12.0% below list) — sets the bar for market timing.
- Cap rate 15.0% vs local median 1.8% in Homer — top-decile yield for the area; either an underpriced asset or a hidden risk that comps aren't pricing in. Stress-test before assuming the spread holds.
Location & tenants
- Location reads 77/100 on livability (#9 in AK, #2,900 nationally) — a middle-class / working-renter tenant base. Strengths: health & safety A+, housing A-, crime B+; Watch: commute F, cost of living D-.
- Kenai Peninsula Borough School District (rural): math 35% / reading 48% proficiency, ranked #8 of 21 in AK (top 38%) — families likely to look elsewhere, expect single-tenant / working-renter base with shorter leases.
- Zoned schools: Homer Middle School (math 47% / reading 62%, grade B-, #1 of 36 statewide, top 3%, 178 students, 33% FRL); Homer Flex School (math 24% / reading 75%, grade D+, #10 of 61 statewide, top 15%, 36 students, 58% FRL).
- Market conditions: 244 active listings in the ZIP; 152 units permitted in Kenai Peninsula Borough in 2024 (20 in 5+ unit buildings).
Forward outlook
- Local home prices are declining (-3.0%/yr); year-one equity from $5k of loan paydown is wiped out by about $21k of value loss. Plan a longer hold.
- Kenai Peninsula County population projected at +17% by 2050 — long-run rental-demand tailwind backs the buy-and-hold thesis.
- At projected returns (-3.0% appreciation + 3.0% rent growth), your $192k cash investment doubles in ~4 years — after that, you're playing with house money.
Negotiation context
- It's been on market 656 days — a 12% lower offer ($605k) is reasonable based on typical stale-listing flexibility.
- 4 sale attempts since 28y ago; this cycle's ask has dropped $63k (8%) from the opening price — seller is motivated, your offer sets the floor, not the list.
Questions for the listing agent
- It's been on market 656 days. Have you received any prior offers? Is the seller open to a 12% concession, seller financing, or rate buy-down credit?
- Can we see the unit-by-unit rent roll, current vacancy, and any below-market leases? What's the average tenancy length?
- What capital expenditures (roof, boiler, parking lot, exteriors) have been made in the last 5 years, and what's planned in the next 2?
- Built in 1976 — when were the roof, HVAC, electrical panel, plumbing, and water heater last replaced?
- Why hasn't it sold? Are there any deal-killer items the seller is aware of (foundation, flood, title, zoning, code violations)?
- Is there a deadline driving the sale (1031 exchange, divorce, estate, relocation)? That informs how much negotiation room exists.
- Schools are B-rated — typically a magnet for longer-tenancy family renters. What's the average tenant stay here, and is there a school-zone premium baked into asking?
- What's the average days-on-market for RENTAL listings here right now (not sales)? A rising rental-DOM trend means longer vacancies and softer asking-rent achievability than the comps imply.
- What's the recent tenant-quality profile in this submarket — average credit score on applications, eviction rate, late-payment / NSF rate, and stable-employment percentage? A property-management company in the area should have these aggregated.
- How much new apartment / multifamily construction is in the pipeline within 1–3 miles? Heavy new supply (>2% of stock underway) typically softens rents 12–24 months out; light construction supports rent growth.
Investment metrics
- 1% rule
- 1.68% ✓
- Cap rate
- 15.02%
- Cash-on-cash
- 31.18%
- DSCR
- 2.39
- GRM
- 5.0
CMA / ARV
- ARV (on-the-fly)
- $674,100
- Comps found
- 1
Show comp detail 1 sale within ~0.75 mi
| Address | Dist | Beds/Ba | Sqft | Sold | Price | $/sf | Match |
|---|---|---|---|---|---|---|---|
| 106 E Bayview Ave | 0.00mi | 12/6.5 | 6,512 (+1%) | 1mo | $687,000 | $105 | 97 |
Match score weights: distance 35% · size 25% · config 20% · recency 20%. Top-matched comps best support the ARV.
Projected returns pro-forma
-3.0% appreciation · 3.0% rent growth · sell at horizon
- IRR
- 26.0%
- Equity multiple
- 2.08×
- Total profit
- $206,820
- Equity at exit
- $102,434
- IRR
- 33.6%
- Equity multiple
- 4.06×
- Total profit
- $589,178
- Equity at exit
- $59,399
Cash invested: $192,360 (down + closing). Projections, not guarantees.
Landlord ↔ Tenant lean methodology
- Overall (STATE)
- 80 Strongly Landlord-Friendly
- State Alaska
- 80 Strongly Landlord-Friendly · R+8
- County
- — inherits STATE
- City
- — inherits STATE
ZIP-level market 99603
- Home prices YoY
- -24.2%
- Active inventory
- 244
- Price-to-rent
- 29.7×
Monthly cashflow live
- Estimated rent
- $11,549 medium interval (Pro) →
- Mortgage (P&I)
- −$3,603
- Tax from tax record
- −$236 /mo · $2,836/yr
- Insurance
- −$286
- HOA
- −$0
- Vacancy / Maint / Mgmt
- −$2,425
- Net cashflow
- $4,998
Break-even live
Sensitivity live
| Price | -10% $5,387 | -5% $5,193 | +0% $4,998 | +5% $4,804 | +10% $4,610 |
|---|---|---|---|---|---|
| Rent | -10% $4,086 | -5% $4,542 | +0% $4,998 | +5% $5,455 | +10% $5,911 |
| Rate | -1.0pp $5,344 | -0.5pp $5,173 | base $4,998 | +0.5pp $4,820 | +1.0pp $4,639 |
6-unit breakdown (identical units grouped — click to expand)
| Units | Beds | Baths | Est. rent |
|---|---|---|---|
| 6× units | 2 | 1.1 | $11,550 |
| #1 | 2 | 1.1 | $1,925 |
| #2 | 2 | 1.1 | $1,925 |
| #3 | 2 | 1.1 | $1,925 |
| #4 | 2 | 1.1 | $1,925 |
| #5 | 2 | 1.1 | $1,925 |
| #6 | 2 | 1.1 | $1,925 |
| Total (6 units) | $11,549 | ||
UW: 25.0% down · 7.5% · 30yr · 1.5% tax · 5.0% vac · 8.0% maint · 8.0% mgmt
Financing live
Cash to close
- Down payment
- $171,750
- Closing costs
- $20,610
- Reserves months
- —
- Total cash needed
- —
Loan-product check · same deal, 3 products live
Conventional
25% down · 7.5% · 30yr
- Down + closing
- —
- Monthly P&I
- —
- Monthly cashflow
- —
- DSCR
- —
- Eligible?
- —
Personal DTI + credit; lowest rate.
DSCR
20% down · 8.5% · 30yr
- Down + closing
- —
- Monthly P&I
- —
- Monthly cashflow
- —
- DSCR
- —
- Eligible?
- —
No personal income docs; deal must DSCR.
Hard money
10% down · 12.0% · 12mo
- Down + closing
- —
- Monthly P&I
- —
- Monthly cashflow
- —
- DSCR
- —
- Eligible?
- —
Short-term bridge; refi at stabilization.
Listing history 7 events
-
2026-04-13status Pending
-
2024-12-06status Active
-
2024-11-20status Pending
-
2024-08-01price $687,000
-
2024-06-10$750,000 Active
-
2018-11-05$479,900
-
1998-05-19$199,000
ⓘ Source: listings_history table (triggers on properties + properties_extension) + one-shot
backfill from property_details.listing_events for pre-trigger history.
Tax reassessment forecast AK · Partial reset (capped growth)
- Current annual tax
- $2,836 · $236/mo
- Projected year-2 tax
- $5,506 · $459/mo
- Expected delta
- +$2,670/yr (+$222/mo · 94.1%)
ⓘ Screening estimate from a state-policy table — verify with the county assessor before closing.
Climate risk First Street
- Flood 1/10 Low FEMA zone D · 0% chance over 30 yrs
- Air quality 1/10 Low
Nearby sold comps map
Loading sold comps map…
Walkable amenities ~0.75 mi
Loading nearby amenities…
Taxation est. · year 1
- Rental income
- $138,588
- − Mortgage interest
- −$38,483
- − Property taxes
- −$2,836
- − Insurance
- −$3,435
- − Repairs & maintenance
- −$11,087
- − Management
- −$11,087
- − Depreciation
- −$19,985
- Taxable income
- $51,675
- Est. tax owed @ 24.0%
- −$12,402
- After-tax cash flow
- $47,579/yr
For passive investors: Depreciation is non-cash, so a rental often shows a tax loss while cash-flowing — sheltering income. Rental losses are passive: they offset passive income freely, and up to $25,000/yr can offset ordinary (W-2) income if you actively participate and your MAGI is under $100k (phasing out to $0 by $150k); unused losses carry forward. On sale, claimed depreciation is recaptured at up to 25%, and gains may owe capital-gains tax (a 1031 exchange can defer both). Figures are a year-1 estimate at your 24.0% rate — not tax advice; consult a CPA.
Schools (NCES district)
- District
- Kenai Peninsula Borough School District
- NCES district ID
- 0200390
- Math proficiency
- 35% ▼ -6.00%
- Reading proficiency
- 48% ▲ 1.00%
- Median HH income
- $60,704
- Composite
- 36.71/100
- National rank
- #4594
- State rank
- #8 of 21 in AK
Livability — Homer
- Score
- 77/100
- State rank
- #9
- US rank
- #2900
Category grades
Schools grade is shown separately in the Schools card above.
Census & demographics
- Census place
- Homer, AK
- Population (ZIP)
- 11,557
Population outlook (Kenai Peninsula County) Hauer SSP2
- Today (2025)
- 63,736 people
- By 2030
- 66,260 · +4.0%
- By 2040
- 70,449 · +10.5%
- By 2050
- 74,414 · +16.8%
- By 2075
- 87,508 · +37.3%
- By 2100
- 95,360 · +49.6%
Race, ethnicity, and origin ACS 2023
- Neighborhood character
- Predominantly White (78%)
- Race & ethnicity
- White 78% Two or more races 10% Native American 6% Hispanic / Latino 4% Asian 2%
- Common ancestry
- Scotch-Irish 5% Italian 4% Slovak 4%
- Foreign-born
- 4% · Canada, Vietnam, China
- Languages at home
- 89% English-only · Russian/Polish/Slavic 4% Spanish 2% Other Asian/Pacific 1%
Political lean MEDSL · Kenai Peninsula
- 2016 margin
- R (+15.2) · D 37.7% · R 52.9% · Other 9.4%
- All cycles
- 2016: R+15.2
Not yet ingested
- Civics
- —
Market trends
- HPI YoY
- ▼ -65.25%
- Current HPI
- 204.3313
- Rent YoY
- —
- Metro
- —
- State GDP YoY
- —
- F500 in state
- 0
Price history
+245.2% since first listed7 events — show timeline
- 2026-04-13 Pending — AKMLS
- 2024-12-06 Relisted — AKMLS
- 2024-11-20 Pending — AKMLS
- 2024-08-01 Price Changed $687,000 AKMLS
- 2024-06-10 Listed $750,000 AKMLS
- 2018-11-05 Listed $479,900 AKMLS
- 1998-05-19 Listed $199,000 AKMLS
Property tax history
-3.2%/yrLatest (2025): $2,836 · +1.4% YoY. Source: county tax records.
Cash-flow waterfall
monthlySold comps — $/sqft
last 12 mo · ≤1 miLoading sold comps…