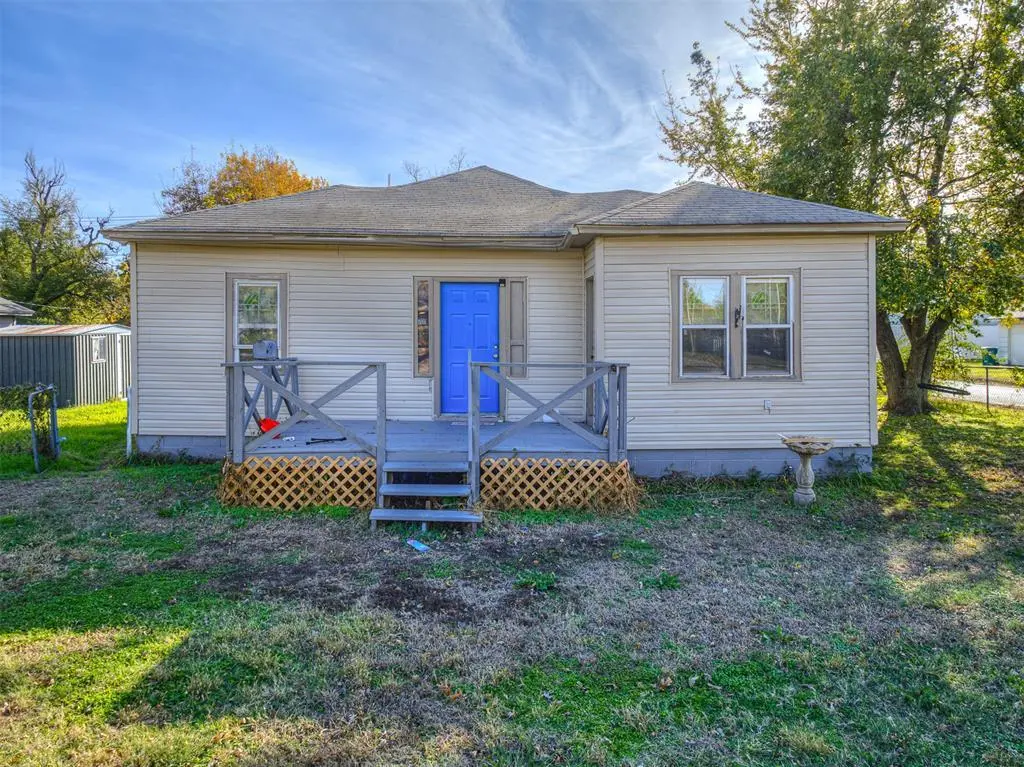
700 SE 49th St · Oklahoma City, OK
Flood risk 1/10 · Minimal
- FEMA flood zone
- X (unshaded)
- Chance of flooding over 30 yrs
- 0.0%
- Est. flood insurance / yr
- $507 – $1,088
Fire risk 1/10 · Minimal
- Est. fire insurance / yr
- $2,463 – $4,575
Heat risk 5/10 · Moderate
- Hot days now (above 107°F)
- 7 days/yr
- Hot days in 30 yrs
- 19 days/yr
Wind risk 2/10 · Minimal
- Chance of severe wind over 30 yrs
- 4.0%
Air-quality risk 1/10 · Minimal
- Unhealthy air days now
- 0 days/yr
- Unhealthy air days in 30 yrs
- 0 days/yr
Risk factors via First Street. Map © Google.
Why this score? — see what drove the F grade
The composite is a weighted blend of 9 inputs, each scored 0–100. Each bar is that input's sub-score; the figure is the points it added to the 100-point composite (weight × sub-score).
- ARV discount +8.6/15.0
- Cash flow +6.7/30.0
- Appreciation +5.9/10.0
- Livability +4.0/5.0
- Rent growth +2.5/5.0
- Condition / age +2.5/5.0
- DSCR +1.0/10.0
- 1% rule +0.9/10.0
- Schools +0.7/10.0
$172,000
🖨 Deal sheet (PDF) 📄 Offer letter ✓ Due diligence
Listing remarks MLS
TWO investment properties- Discover the potential of this unique property featuring two updated homes on a single lot. The first home has 3 bedrooms and 2 baths. The second home is a cozy 2-bedroom, 1-bath residence, ideal for additional income or extended family. Recent renovations enhance the appeal of both homes, making them move-in ready. Sold as-is, this property is perfect for investors looking for a versatile asset with incredible income potential. Don’t miss out—schedule a showing today!
Key facts
- Move-in ready
- Recent renovations
- Two updated homes
Tags
Neighborhood map
What this means for you Summary
Snapshot
- This is a 2-bed/1.0-bath single-family listed at $172k.
Deal economics
- At list price, monthly cash flow is $-273 ($-3k/yr) — negative.
- To cash-flow at today's rent, offer at most $124k (28.1% below list).
- To meet the 1% rule (rent ≥ 1% of price), the offer needs to be $101k (41.2% below list).
- Recommended offer: $101k (41.2% below list) — sets the bar for 1% rule.
Location & tenants
- Location reads 80/100 on livability (#3 in OK, #1,635 nationally) — a professional / high-income tenant draw. Strengths: amenities A+, commute A+, cost of living A+; Watch: crime F.
- Oklahoma City (urban): math 7% / reading 10% proficiency, ranked #254 of 270 in OK (top 94%) — low school quality limits family demand, transient renter base, plan for 1-2y turnover; 82% free/reduced lunch — lower-income household profile, screen leases tightly.
- Zoned schools: Cesar Chavez Es (math 4% / reading 3%, grade F, #797 of 845 statewide, top 95%, 630 students, 0% FRL); Classen Ms of Advanced Studies (math 35% / reading 46%, grade F, #6 of 345 statewide, top 1%, 855 students, 0% FRL); Capitol Hill Hs (math 2% / reading 4%, grade F, #444 of 447 statewide, top 99%, 1,455 students, 0% FRL) — zoned schools average 0% FRL vs 82% district-wide (82 pts lower); this property's tenant base skews higher-income than the district average.
- Market conditions: 84 active listings in the ZIP; 27 comparable units currently listed for rent nearby; rentals at typical pace (median 25d on market — plan ~3-4 weeks tenant-placement turnaround); 44% of comp listings sitting > 30 days — soft ceiling on asking rent; 5,365 units permitted in Oklahoma County in 2024 (569 in 5+ unit buildings).
Forward outlook
- In year one you build about $4k of equity ($1k loan paydown + $3k appreciation (1.8% local appreciation)).
- Oklahoma County population projected at +41% by 2050 — long-run rental-demand tailwind backs the buy-and-hold thesis.
- By year 8, paydown + projected appreciation supports a ~$32k cash-out refi (75% LTV) — recoverable capital for the next deal without selling this one.
Negotiation context
- It's been on market 136 days — a 12% lower offer ($151k) is reasonable based on typical stale-listing flexibility.
- 5 sale attempts since 2y ago with the ask held roughly flat each time — persistent listings suggest the price (not the market) is what's stuck; bring a comps-based counter.
- Current owner paid $73k; list at $172k implies a 136% gain — meaningful room to come down on a strong offer.
Risks & watch-outs
- Watch-outs: built in 1948 — expect roof / HVAC / electrical / plumbing capex.
- Climate carrying-cost: extreme-heat days projected 7→19/yr by 2055 (HVAC capex compounding) — expect insurance premiums to compound above CPI over the hold.
Questions for the listing agent
- What do current leases actually rent for vs. the listed asking? Can we see a recent rent roll and the last 12 months of T-12 income?
- It's been on market 136 days. Have you received any prior offers? Is the seller open to a 41% concession, seller financing, or rate buy-down credit?
- Built in 1948 — when were the roof, HVAC, electrical panel, plumbing, and water heater last replaced?
- Why hasn't it sold? Are there any deal-killer items the seller is aware of (foundation, flood, title, zoning, code violations)?
- Is there a deadline driving the sale (1031 exchange, divorce, estate, relocation)? That informs how much negotiation room exists.
- Schools are F-rated, which usually means shorter tenancies and higher turnover. Who's the typical renter profile here, and what's been the actual vacancy rate?
- Crime grade is F in this area — have there been break-ins, vandalism, or insurance claims at this property in the last 3 years? What carrier currently insures it and at what premium?
- The area grade is low — what's the realistic commute time and amenity access for the typical tenant pool here? Any planned neighborhood developments (good or bad) we should know about?
- What's the average days-on-market for RENTAL listings here right now (not sales)? A rising rental-DOM trend means longer vacancies and softer asking-rent achievability than the comps imply.
- What's the recent tenant-quality profile in this submarket — average credit score on applications, eviction rate, late-payment / NSF rate, and stable-employment percentage? A property-management company in the area should have these aggregated.
- How much new for-sale + rental construction is in the pipeline within 1–3 miles? Heavy new supply typically softens prices + rents 12–24 months out; constrained supply supports both.
Investment metrics
- 1% rule
- 0.59% ✗
- Cap rate
- 4.39%
- Cash-on-cash
- -6.81%
- DSCR
- 0.70
- GRM
- 14.2
CMA / ARV
- ARV (median comp)
- $176,137
- List price
- $172,000
- Delta
- -2.35%
- Verdict
- FAIR
- Comps
- 12 within 2.0 mi
Show comp detail 11 sales within ~0.75 mi
| Address | Dist | Beds/Ba | Sqft | Sold | Price | $/sf | Match |
|---|---|---|---|---|---|---|---|
| 500 SE 47th St | 0.18mi | 2/1.0 | 902 (-0%) | 7mo | $80,000 | $89 | 85 |
| 333 SE 55th St | 0.46mi | 3/1.0 (+1) | 857 (-5%) | 2mo | $150,000 | $175 | 63 |
| 809 SE 43rd St | 0.45mi | 3/1.0 (+1) | 910 (+1%) | 15mo | $145,000 | $159 | 60 |
| 312 SE 40th St | 0.68mi | 2/1.0 | 843 (-7%) | 3mo | $160,000 | $190 | 55 |
| 633 SE 39th St | 0.70mi | 3/1.0 (+1) | 885 (-2%) | 5mo | $156,000 | $176 | 54 |
| 504 SE 47th St | 0.18mi | 3/1.0 (+1) | 984 (+9%) | 23mo | $90,000 | $91 | 53 |
| 220 SE 53rd St | 0.51mi | 3/1.0 (+1) | 1,005 (+11%) | 0mo | $145,000 | $144 | 52 |
| 313 SE 40th St | 0.70mi | 2/1.0 | 836 (-8%) | 12mo | $155,900 | $186 | 44 |
| 340 SE 54th St | 0.43mi | 1/1.0 (-1) | 812 (-10%) | 18mo | $29,000 | $36 | 43 |
| 1224 SE 51st St | 0.63mi | 2/1.0 | 844 (-7%) | 22mo | $38,000 | $45 | 41 |
| 216 SE 40th St | 0.74mi | 3/2.0 (+1) | 1,036 (+15%) | 0mo | $130,000 | $125 | 32 |
Match score weights: distance 35% · size 25% · config 20% · recency 20%. Top-matched comps best support the ARV.
Projected returns pro-forma
1.75% appreciation · 3.0% rent growth · sell at horizon
- IRR
- -3.1%
- Equity multiple
- 0.84×
- Total profit
- $-7,865
- Equity at exit
- $65,499
- IRR
- 1.7%
- Equity multiple
- 1.23×
- Total profit
- $10,916
- Equity at exit
- $92,553
Cash invested: $48,160 (down + closing). Projections, not guarantees.
Landlord ↔ Tenant lean methodology
- Overall (STATE)
- 83 Strongly Landlord-Friendly
- State Oklahoma
- 83 Strongly Landlord-Friendly · R+20
- County
- — inherits STATE
- City
- — inherits STATE
ZIP-level market 73129
- Home prices YoY
- 0.7%
- Active inventory
- 84
- Price-to-rent
- 14.2×
Monthly cashflow live
- Estimated rent
- $1,012 high interval (Pro) →
- Mortgage (P&I)
- −$902
- Tax from tax record
- −$99 /mo · $1,186/yr
- Insurance
- −$72
- HOA
- −$0
- Vacancy / Maint / Mgmt
- −$212
- Net cashflow
- $-273
Break-even live
Sensitivity live
| Price | -10% $-176 | -5% $-225 | +0% $-273 | +5% $-322 | +10% $-371 |
|---|---|---|---|---|---|
| Rent | -10% $-353 | -5% $-313 | +0% $-273 | +5% $-233 | +10% $-193 |
| Rate | -1.0pp $-187 | -0.5pp $-229 | base $-273 | +0.5pp $-318 | +1.0pp $-363 |
UW: 25.0% down · 7.5% · 30yr · 1.5% tax · 5.0% vac · 8.0% maint · 8.0% mgmt
Financing live
Cash to close
- Down payment
- $43,000
- Closing costs
- $5,160
- Reserves months
- —
- Total cash needed
- —
Loan-product check · same deal, 3 products live
Conventional
25% down · 7.5% · 30yr
- Down + closing
- —
- Monthly P&I
- —
- Monthly cashflow
- —
- DSCR
- —
- Eligible?
- —
Personal DTI + credit; lowest rate.
DSCR
20% down · 8.5% · 30yr
- Down + closing
- —
- Monthly P&I
- —
- Monthly cashflow
- —
- DSCR
- —
- Eligible?
- —
No personal income docs; deal must DSCR.
Hard money
10% down · 12.0% · 12mo
- Down + closing
- —
- Monthly P&I
- —
- Monthly cashflow
- —
- DSCR
- —
- Eligible?
- —
Short-term bridge; refi at stabilization.
Rent comps 27 comps
| Address | Beds | Baths | Sqft | Rent | $/sqft | DOM | Units | Dist |
|---|---|---|---|---|---|---|---|---|
| 4908 S Stiles Ave Oklahoma City, OK | 2.0 | 1.0 | 600 | $1,000 | $1.67 | 45d | 1 | 0.37mi |
| 109 SE 42nd St Apt A Oklahoma City, OK | 2.0 | 1.0 | 800 | $799 | $1.00 | 18d | 1 | 0.76mi |
| 1501 SE 52nd St Oklahoma City, OK | 3.0 | 2.0 | 1012 | $1,200 | $1.19 | 25d | 1 | 0.77mi |
| 4101 S Shields Blvd Unit Shields 3B Oklahoma City, OK | 3.0 | 2.0 | 957 | $1,050 | $1.10 | 25d | 1 | 0.77mi |
| 4101 S Shields Blvd Apt 3B Oklahoma City, OK | 3.0 | 2.0 | 957 | $1,025 | $1.07 | 5d | 1 | 0.77mi |
| 101 SE 42nd St Unit B Oklahoma City, OK | 2.0 | 1.0 | 740 | $645 | $0.87 | 45d | 1 | 0.78mi |
| 1528 SE 49th Ter Oklahoma City, OK | 3.0 | 1.0 | 912 | $1,100 | $1.21 | 25d | 1 | 0.82mi |
| 1528 SE 47th Pl Oklahoma City, OK | 3.0 | 1.0 | 1092 | $1,300 | $1.19 | 5d | 1 | 0.84mi |
| 808 SE 61st St Oklahoma City, OK | 3.0 | 1.0 | 736 | $940 | $1.28 | 45d | 1 | 0.88mi |
| 1413 SE 39th St Oklahoma City, OK | 3.0 | 1.0 | 1004 | $1,125 | $1.12 | 45d | 1 | 0.93mi |
| 6321 Johnnie Ter Oklahoma City, OK | 3.0 | 1.0 | 850 | $1,150 | $1.35 | 45d | 1 | 0.99mi |
| 5113 S Sage Ave Oklahoma City, OK | 3.0 | 1.5 | 996 | $1,025 | $1.03 | 3d | 1 | 1.04mi |
| 6513 Ashby Ter Oklahoma City, OK | 3.0 | 2.0 | 1049 | $1,095 | $1.04 | 25d | 1 | 1.09mi |
| 5804 S Harvey Ave Oklahoma City, OK | 1.0 | 1.0 | 780 | $675 | $0.87 | 23d | 1 | 1.19mi |
| 6612 S Stiles Ave Oklahoma City, OK | 2.0 | 1.0 | 870 | $800 | $0.92 | 45d | 1 | 1.20mi |
| 311 SE 66th St Oklahoma City, OK | 1.0 | 1.0 | 750 | $700 | $0.93 | 45d | 1 | 1.21mi |
| 311 SE 66th St Unit 6620-301 Oklahoma City, OK | 2.0 | 1.0 | 870 | $850 | $0.98 | 45d | 1 | 1.21mi |
| 311 SE 66th St Oklahoma City, OK | 1.0 | 1.0 | 750 | $700 | $0.93 | 4d | 1 | 1.21mi |
| 6050 S Harvey Ave Apt 103 Oklahoma City, OK | 2.0 | 1.0 | 780 | $929 | $1.19 | 25d | 1 | 1.23mi |
| 6050 S Harvey Ave Oklahoma City, OK | 2.0 | 1.0 | 780 | $929 | $1.19 | 45d | 1 | 1.23mi |
| 5542 S Walker Ave Oklahoma City, OK | 2.0 | 1.0 | 681 | $920 | $1.35 | 4d | 1 | 1.29mi |
| 3913 S Harvey Ave Unit 2 Oklahoma City, OK | 1.0 | 1.0 | 568 | $900 | $1.58 | 45d | 1 | 1.30mi |
| 904 SE 69th St Oklahoma City, OK | 3.0 | 1.5 | 911 | $1,150 | $1.26 | 25d | 1 | 1.34mi |
| 3906 S Hudson Ave Oklahoma City, OK | 1.0 | 1.0 | 700 | $750 | $1.07 | 25d | 1 | 1.37mi |
| 220 SW 34th St Oklahoma City, OK | 1.0 | 1.0 | 625 | $725 | $1.16 | 45d | 1 | 1.41mi |
| 620 SW 50th St Oklahoma City, OK | 2.0 | 1.0 | 977 | $1,100 | $1.13 | 4d | 1 | 1.45mi |
| 6516 Anderson Dr Oklahoma City, OK | 3.0 | 1.0 | 720 | $825 | $1.15 | 45d | 1 | 1.48mi |
Listing history 36 events
-
2026-06-21days on market $172,000 Active 136 DOM
-
2026-06-18days on market $172,000 Active 133 DOM
-
2026-06-17days on market $172,000 Active 132 DOM
-
2026-06-16days on market $172,000 Active 131 DOM
-
2026-06-15days on market $172,000 Active 130 DOM
-
2026-06-13days on market $172,000 Active 128 DOM
-
2026-06-09days on market $172,000 Active 124 DOM
-
2026-06-08days on market $172,000 Active 123 DOM
-
2026-06-07days on market $172,000 Active 122 DOM
-
2026-06-05days on market $172,000 Active 119 DOM
-
2026-06-03days on market $172,000 Active 118 DOM
-
2026-06-02days on market $172,000 Active 117 DOM
-
2026-06-01days on market $172,000 Active 116 DOM
-
2026-05-31days on market $172,000 Active 115 DOM
-
2026-03-26price $172,000 512-char remark
Show marketing remark (512 chars)
TWO investment properties- Discover the potential of this unique property featuring two updated homes on a single lot. The first home has 3 bedrooms and 2 baths. The second home is a cozy 2-bedroom, 1-bath residence, ideal for additional income or extended family. Recent renovations enhance the appeal of both homes, making them move-in ready. Sold as-is, this property is perfect for investors looking for a versatile asset with incredible income potential. Don’t miss out—schedule a showing today!
-
2026-02-03$175,000 Active 512-char remark
Show marketing remark (512 chars)
TWO investment properties- Discover the potential of this unique property featuring two updated homes on a single lot. The first home has 3 bedrooms and 2 baths. The second home is a cozy 2-bedroom, 1-bath residence, ideal for additional income or extended family. Recent renovations enhance the appeal of both homes, making them move-in ready. Sold as-is, this property is perfect for investors looking for a versatile asset with incredible income potential. Don’t miss out—schedule a showing today!
-
2025-12-22historical
-
2025-10-22price $179,000
-
2025-09-24status Active
-
2025-09-24price $180,000
-
2025-09-10status Pending
-
2025-08-12price $195,000
-
2025-07-22$205,000 Active
-
2025-04-18historical
-
2025-03-24historical $1,180
-
2025-03-06price $220,000
-
2025-02-25price $1,180
-
2025-02-22$1,275
-
2025-02-20price $189,900
-
2025-02-10price $199,900
-
2025-02-03price $200,000
-
2025-01-13price $214,900
-
2024-12-16price $219,500
-
2024-12-03$230,000 Active
-
2023-10-16soldstatus $73,000
-
1978-12-01soldstatus $20,000
ⓘ Source: listings_history table (triggers on properties + properties_extension) + one-shot
backfill from property_details.listing_events for pre-trigger history.
Tax reassessment forecast OK · Resets to sale price
- Current annual tax
- $1,186 · $99/mo
- Projected year-2 tax
- $1,548 · $129/mo
- Expected delta
- +$362/yr (+$30/mo · 30.5%)
ⓘ Screening estimate from a state-policy table — verify with the county assessor before closing.
Climate risk First Street
- Flood 1/10 Low FEMA zone X (unshaded) · 0% chance over 30 yrs
- Wildfire 1/10 Low
- Heat 5/10 Major 7 d/yr ≥107°F today · 19 d/yr by 30 yrs out
- Wind 2/10 Low 4% chance of damaging wind over 30 yrs
- Air quality 1/10 Low 0 unhealthy d/yr today · 0 by 30 yrs out
Nearby sold comps map
Loading sold comps map…
Walkable amenities ~0.75 mi
Loading nearby amenities…
Taxation est. · year 1
- Rental income
- $12,141
- − Mortgage interest
- −$9,635
- − Property taxes
- −$1,186
- − Insurance
- −$860
- − Repairs & maintenance
- −$971
- − Management
- −$971
- − Depreciation
- −$5,004
- Taxable loss
- −$6,486
- Est. tax savings @ 24.0%
- +$1,557
- After-tax cash flow
- $-1,722/yr
For passive investors: Depreciation is non-cash, so a rental often shows a tax loss while cash-flowing — sheltering income. Rental losses are passive: they offset passive income freely, and up to $25,000/yr can offset ordinary (W-2) income if you actively participate and your MAGI is under $100k (phasing out to $0 by $150k); unused losses carry forward. On sale, claimed depreciation is recaptured at up to 25%, and gains may owe capital-gains tax (a 1031 exchange can defer both). Figures are a year-1 estimate at your 24.0% rate — not tax advice; consult a CPA.
Schools (NCES district)
- District
- Oklahoma City
- NCES district ID
- 4022770
- Math proficiency
- 7% ▼ -5.00%
- Reading proficiency
- 10% ▼ -6.00%
- Median HH income
- $35,606
- Composite
- 7.0/100
- National rank
- #9970
- State rank
- #254 of 270 in OK
Livability — Oklahoma City
- Score
- 80/100
- State rank
- #3
- US rank
- #1635
Category grades
Schools grade is shown separately in the Schools card above.
Census & demographics
- Census place
- Oklahoma City, OK
- County
- Oklahoma County · 771,644 people
- City population
- 498,656
- Metro
- Oklahoma City, OK
- Population (ZIP)
- 20,014
- Household income
- $46,670
- Rent vs Own
- Severe rent burden
- 611.0
Population outlook (Oklahoma County) Hauer SSP2
- Today (2025)
- 911,875 people
- By 2030
- 982,413 · +7.7%
- By 2040
- 1,130,468 · +24.0%
- By 2050
- 1,288,422 · +41.3%
- By 2075
- 1,711,482 · +87.7%
- By 2100
- 2,088,448 · +129.0%
Race, ethnicity, and origin ACS 2023
- Neighborhood character
- Diverse neighborhood (Simpson 0.61)
- Race & ethnicity
- Hispanic / Latino 57% Two or more races 26% White 26% Black 9% Native American 7% Asian 1%
- Hispanic origin (detail)
- Mexican 53%
- Common ancestry
- Italian 1% Lithuanian 1% Slovak 1%
- Foreign-born
- 24% · Canada, Dominican Republic
- Languages at home
- 54% English-only · Spanish 44% Other Asian/Pacific 1% Vietnamese 1%
Political lean MEDSL · Oklahoma
- 2024 margin
- Toss-up / Even · D 48.0% · R 49.7% · Other 2.3%
- 2008→2024 swing
- +15.1pp toward D · 2008: -16.8pp · 2024: -1.7pp
- All cycles
- 2024: R+1.7 2020: R+1.1 2016: R+10.5 2012: R+16.7 2008: R+16.8
Not yet ingested
- Civics
- —
Market trends
- HPI YoY
- ▲ 1.75%
- Current HPI
- 250.8581
- Rent YoY
- —
- Metro
- Oklahoma City, OK
- State GDP YoY
- ▲ 1.55%
- F500 in state
- 6
Industry mix (Fortune 500 HQ in OK)
| Industry | F500 HQs | Revenue |
|---|---|---|
| Energy | 3 | $48B |
|
||
Price history
+760.0% since first listed22 events — show timeline
- 2026-03-26 Price Changed $172,000 MLSOK
- 2026-02-03 Listed $175,000 MLSOK
- 2025-12-22 Listing Removed — MLSOK
- 2025-10-22 Price Changed $179,000 MLSOK
- 2025-09-24 Relisted — MLSOK
- 2025-09-24 Price Changed $180,000 MLSOK
- 2025-09-10 Pending — MLSOK
- 2025-08-12 Price Changed $195,000 MLSOK
- 2025-07-22 Listed $205,000 MLSOK
- 2025-04-18 Listing Removed — MLSOK
- 2025-03-24 Rental Removed $1,180 PROPERTYWARE
- 2025-03-06 Price Changed $220,000 MLSOK
- 2025-02-25 Price Changed $1,180 PROPERTYWARE
- 2025-02-22 Listed for Rent $1,275 PROPERTYWARE
- 2025-02-20 Price Changed $189,900 MLSOK
- 2025-02-10 Price Changed $199,900 MLSOK
- 2025-02-03 Price Changed $200,000 MLSOK
- 2025-01-13 Price Changed $214,900 MLSOK
- 2024-12-16 Price Changed $219,500 MLSOK
- 2024-12-03 Listed $230,000 MLSOK
- 2023-10-16 Sold (Public Records) $73,000 Public Records
- 1978-12-01 Sold (Public Records) $20,000 Public Records
Property tax history
+12.1%/yrLatest (2025): $1,186 · +4.4% YoY. Source: county tax records.
Cash-flow waterfall
monthlySold comps — $/sqft
last 12 mo · ≤1 miLoading sold comps…