119 Post Oak Rd · La Vernia, TX
Flood risk 1/10 · Minimal
- FEMA flood zone
- X (unshaded)
- Chance of flooding over 30 yrs
- 0.0%
- Est. flood insurance / yr
- $507 – $1,088
Fire risk 4/10 · Minor
- Est. fire insurance / yr
- $1,222 – $2,270
Heat risk 8/10 · Major
- Hot days now (above 109°F)
- 7 days/yr
- Hot days in 30 yrs
- 21 days/yr
Wind risk 8/10 · Major
- Chance of severe wind over 30 yrs
- 80.0%
Air-quality risk 1/10 · Minimal
- Unhealthy air days now
- 0 days/yr
- Unhealthy air days in 30 yrs
- 0 days/yr
Risk factors via First Street. Map © Google.
Why this score? — see what drove the C- grade
The composite is a weighted blend of 9 inputs, each scored 0–100. Each bar is that input's sub-score; the figure is the points it added to the 100-point composite (weight × sub-score).
- ARV discount +15.0/15.0
- Cash flow +14.8/30.0
- Schools +5.2/10.0
- DSCR +4.5/10.0
- 1% rule +4.1/10.0
- Livability +3.1/5.0
- Rent growth +2.5/5.0
- Condition / age +2.5/5.0
- Appreciation +0.0/10.0
$439,900
🖨 Deal sheet 📄 Offer letter ✓ Due diligence
Listing remarks MLS
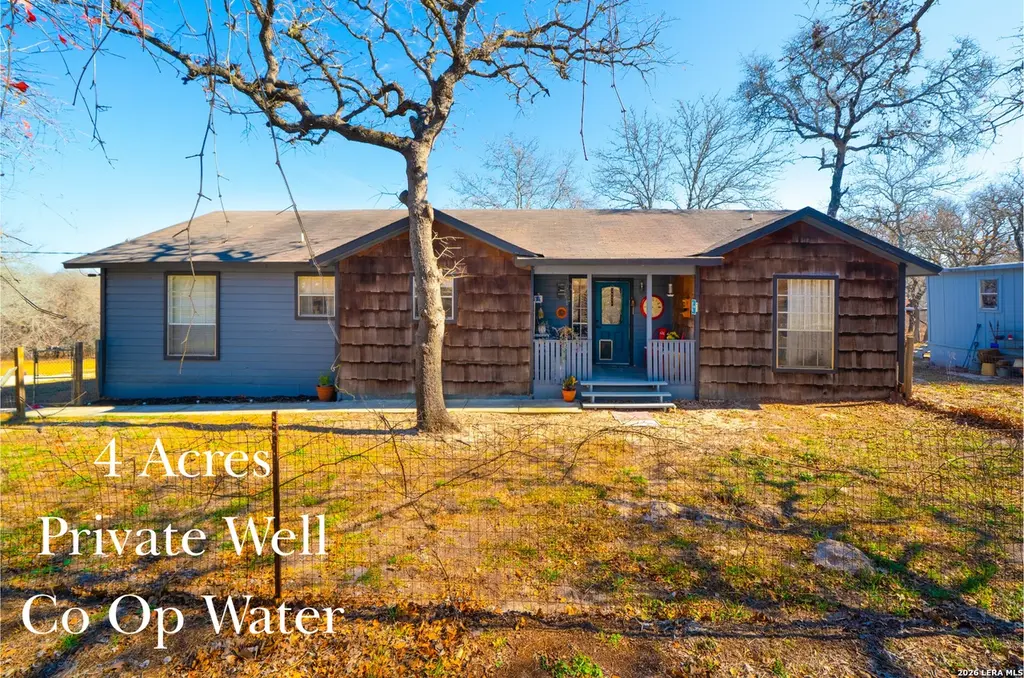
Experience serene country living in this beautifully maintained 4 bedroom, 3 bathroom home situated on 4+- acres in the highly sought-after La Vernia area. Offering a peaceful setting with mature trees and wide open space, this property provides both privacy and comfort. A welcoming covered front patio leads you into an inviting open living and dining area, filled with abundant natural light ideal for everyday living or entertaining and engineered wood flooring throughout the home. The well designed layout includes a spacious primary suite featuring two closets, a double-vanity sink bathroom, and a spacious standing shower. The home also offers a unique guest setup with the fourth bedroom and bathroom that has a convenient kitchenette, separate entrance, perfect for extended stays, multigenerational living, or added flexibility. Outside, a detached garage and separate storage adds functionality, and the property is serviced by a private well, while the expansive acreage offers endless possibilities for outdoor enjoyment, recreation, or future improvements. This exceptional property blends comfort, space, and rural charm, an opportunity you won't want to miss.
Key facts
- Open space
- Covered front patio
- Mature trees
Tags
Neighborhood map
What this means for you Summary
Snapshot
- This is a 4-bed/3.0-bath single-family listed at $440k.
Deal economics
- At list price, monthly cash flow is $120 ($1k/yr) — positive.
- The deal already cash-flows at list — no discount required.
- To meet the 1% rule (rent ≥ 1% of price), the offer needs to be $400k (9.1% below list).
- Recommended offer: $387k (12.0% below list) — sets the bar for market timing.
- Cap rate 6.6% vs local median 1.4% in La Vernia — top-decile yield for the area; either an underpriced asset or a hidden risk that comps aren't pricing in. Stress-test before assuming the spread holds.
Location & tenants
- Location reads 61/100 on livability (#994 in TX) — a middle-class / working-renter tenant base. Strengths: crime A+, cost of living A+, housing A+; Watch: amenities F, commute F, health & safety F.
- La Vernia ISD (rural): math 61% / reading 53% proficiency, ranked #62 of 826 in TX (top 8%) — acceptable for families but not a draw, mixed tenant base, ~2y average lease.
- Market conditions: 232 active listings in the ZIP; 1 comparable units currently listed for rent nearby; 135 units permitted in Wilson County in 2024 (0 in 5+ unit buildings).
Forward outlook
- Local home prices are declining (-3.0%/yr); year-one equity from $3k of loan paydown is wiped out by about $13k of value loss. Plan a longer hold.
- Wilson County population projected at +46% by 2050 — long-run rental-demand tailwind backs the buy-and-hold thesis.
Negotiation context
- It's been on market 161 days — a 12% lower offer ($387k) is reasonable based on typical stale-listing flexibility.
Risks & watch-outs
- Climate carrying-cost: severe wind risk, 80% chance of damaging wind over 30y; extreme-heat days projected 7→21/yr by 2055 (HVAC capex compounding) — expect insurance premiums to compound above CPI over the hold.
Questions for the listing agent
- It's been on market 161 days. Have you received any prior offers? Is the seller open to a 12% concession, seller financing, or rate buy-down credit?
- Why hasn't it sold? Are there any deal-killer items the seller is aware of (foundation, flood, title, zoning, code violations)?
- Is there a deadline driving the sale (1031 exchange, divorce, estate, relocation)? That informs how much negotiation room exists.
- Schools are B-rated — typically a magnet for longer-tenancy family renters. What's the average tenant stay here, and is there a school-zone premium baked into asking?
- What's the average days-on-market for RENTAL listings here right now (not sales)? A rising rental-DOM trend means longer vacancies and softer asking-rent achievability than the comps imply.
- What's the recent tenant-quality profile in this submarket — average credit score on applications, eviction rate, late-payment / NSF rate, and stable-employment percentage? A property-management company in the area should have these aggregated.
- How much new for-sale + rental construction is in the pipeline within 1–3 miles? Heavy new supply typically softens prices + rents 12–24 months out; constrained supply supports both.
Investment metrics
- 1% rule
- 0.91% ✗
- Cap rate
- 6.62%
- Cash-on-cash
- 1.17%
- DSCR
- 1.05
- GRM
- 9.2
CMA / ARV
- ARV (median comp)
- $559,668
- List price
- $439,900
- Delta
- -21.40%
- Verdict
- UNDERPRICED
- Comps
- 20 within 1.0 mi
Show comp detail 1 sale within ~0.75 mi
| Address | Dist | Beds/Ba | Sqft | Sold | Price | $/sf | Match |
|---|---|---|---|---|---|---|---|
| 313 Lost Trail Cir | 0.44mi | 4/2.0 | 2,112 (-10%) | 19mo | $295,000 | $140 | 42 |
Match score weights: distance 35% · size 25% · config 20% · recency 20%. Top-matched comps best support the ARV.
Projected returns pro-forma
-3.0% appreciation · 3.0% rent growth · sell at horizon
- IRR
- -14.4%
- Equity multiple
- 0.48×
- Total profit
- $-63,585
- Equity at exit
- $65,591
- IRR
- -5.7%
- Equity multiple
- 0.63×
- Total profit
- $-45,289
- Equity at exit
- $38,035
Cash invested: $123,172 (down + closing). Projections, not guarantees.
Landlord ↔ Tenant lean methodology
- Overall (STATE)
- 87 Strongly Landlord-Friendly
- State Texas
- 87 Strongly Landlord-Friendly · R+5
- County
- — inherits STATE
- City
- — inherits STATE
ZIP-level market 78121
- Home prices YoY
- -20.1%
- Active inventory
- 232
- Price-to-rent
- 9.2×
Monthly cashflow live
- Estimated rent
- $4,000 medium interval (Pro) →
- Mortgage (P&I)
- −$2,307
- Tax from tax record
- −$550 /mo · $6,599/yr
- Insurance
- −$183
- HOA
- −$0
- Vacancy / Maint / Mgmt
- −$840
- Net cashflow
- $120
Break-even live
UW: 25.0% down · 7.5% · 30yr · 1.5% tax · 5.0% vac · 8.0% maint · 8.0% mgmt
Financing live
Cash to close
- Down payment
- $109,975
- Closing costs
- $13,197
- Reserves months
- —
- Total cash needed
- —
Loan-product check · same deal, 3 products live
Conventional
25% down · 7.5% · 30yr
- Down + closing
- —
- Monthly P&I
- —
- Monthly cashflow
- —
- DSCR
- —
- Eligible?
- —
Personal DTI + credit; lowest rate.
DSCR
20% down · 8.5% · 30yr
- Down + closing
- —
- Monthly P&I
- —
- Monthly cashflow
- —
- DSCR
- —
- Eligible?
- —
No personal income docs; deal must DSCR.
Hard money
10% down · 12.0% · 12mo
- Down + closing
- —
- Monthly P&I
- —
- Monthly cashflow
- —
- DSCR
- —
- Eligible?
- —
Short-term bridge; refi at stabilization.
Rent comps 1 comps
| Address | Beds | Baths | Sqft | Rent | $/sqft | DOM | Units | Dist |
|---|---|---|---|---|---|---|---|---|
| 112 Scenic Hills Dr La Vernia, TX | 4.0 | 2.5 | 2382 | $4,000 | $1.68 | 2d | 1 | 1.42mi |
Listing history 15 events
-
2026-06-18days on market $439,900 Active 161 DOM
-
2026-06-17days on market $439,900 Active 160 DOM
-
2026-06-16days on market $439,900 Active 159 DOM
-
2026-06-15days on market $439,900 Active 158 DOM
-
2026-06-13days on market $439,900 Active 156 DOM
-
2026-06-09days on market $439,900 Active 152 DOM
-
2026-06-08days on market $439,900 Active 151 DOM
-
2026-06-07days on market $439,900 Active 150 DOM
-
2026-06-04days on market $439,900 Active 147 DOM
-
2026-06-03days on market $439,900 Active 146 DOM
-
2026-06-02days on market $439,900 Active 145 DOM
-
2026-06-01days on market $439,900 Active 144 DOM
-
2026-05-31days on market $439,900 Active 143 DOM
-
2026-04-25price $439,900 1177-char remark
Show marketing remark (1177 chars)
Experience serene country living in this beautifully maintained 4 bedroom, 3 bathroom home situated on 4+- acres in the highly sought-after La Vernia area. Offering a peaceful setting with mature trees and wide open space, this property provides both privacy and comfort. A welcoming covered front patio leads you into an inviting open living and dining area, filled with abundant natural light ideal for everyday living or entertaining and engineered wood flooring throughout the home. The well designed layout includes a spacious primary suite featuring two closets, a double-vanity sink bathroom, and a spacious standing shower. The home also offers a unique guest setup with the fourth bedroom and bathroom that has a convenient kitchenette, separate entrance, perfect for extended stays, multigenerational living, or added flexibility. Outside, a detached garage and separate storage adds functionality, and the property is serviced by a private well, while the expansive acreage offers endless possibilities for outdoor enjoyment, recreation, or future improvements. This exceptional property blends comfort, space, and rural charm, an opportunity you won't want to miss.
-
2026-01-08$450,000 New 1177-char remark
Show marketing remark (1177 chars)
Experience serene country living in this beautifully maintained 4 bedroom, 3 bathroom home situated on 4+- acres in the highly sought-after La Vernia area. Offering a peaceful setting with mature trees and wide open space, this property provides both privacy and comfort. A welcoming covered front patio leads you into an inviting open living and dining area, filled with abundant natural light ideal for everyday living or entertaining and engineered wood flooring throughout the home. The well designed layout includes a spacious primary suite featuring two closets, a double-vanity sink bathroom, and a spacious standing shower. The home also offers a unique guest setup with the fourth bedroom and bathroom that has a convenient kitchenette, separate entrance, perfect for extended stays, multigenerational living, or added flexibility. Outside, a detached garage and separate storage adds functionality, and the property is serviced by a private well, while the expansive acreage offers endless possibilities for outdoor enjoyment, recreation, or future improvements. This exceptional property blends comfort, space, and rural charm, an opportunity you won't want to miss.
ⓘ Source: listings_history table (triggers on properties + properties_extension) + one-shot
backfill from property_details.listing_events for pre-trigger history.
Tax reassessment forecast TX · Resets to sale price
- Current annual tax
- $6,599 · $550/mo
- Projected year-2 tax
- $8,050 · $671/mo
- Expected delta
- +$1,451/yr (+$121/mo · 22.0%)
ⓘ Screening estimate from a state-policy table — verify with the county assessor before closing.
Climate risk First Street
- Flood 1/10 Low FEMA zone X (unshaded) · 0% chance over 30 yrs
- Wildfire 4/10 Moderate
- Heat 8/10 Severe 7 d/yr ≥109°F today · 21 d/yr by 30 yrs out
- Wind 8/10 Severe 80% chance of damaging wind over 30 yrs
- Air quality 1/10 Low 0 unhealthy d/yr today · 0 by 30 yrs out
Nearby sold comps map
Loading sold comps map…
Walkable amenities ~0.75 mi
Loading nearby amenities…
Taxation est. · year 1
- Rental income
- $48,000
- − Mortgage interest
- −$24,641
- − Property taxes
- −$6,599
- − Insurance
- −$2,200
- − Repairs & maintenance
- −$3,840
- − Management
- −$3,840
- − Depreciation
- −$12,797
- Taxable loss
- −$5,917
- Est. tax savings @ 24.0%
- +$1,420
- After-tax cash flow
- $2,859/yr
For passive investors: Depreciation is non-cash, so a rental often shows a tax loss while cash-flowing — sheltering income. Rental losses are passive: they offset passive income freely, and up to $25,000/yr can offset ordinary (W-2) income if you actively participate and your MAGI is under $100k (phasing out to $0 by $150k); unused losses carry forward. On sale, claimed depreciation is recaptured at up to 25%, and gains may owe capital-gains tax (a 1031 exchange can defer both). Figures are a year-1 estimate at your 24.0% rate — not tax advice; consult a CPA.
Schools (NCES district)
- District
- La Vernia ISD
- NCES district ID
- 4826310
- Math proficiency
- 61% ▼ -8.00%
- Reading proficiency
- 53% ▼ -3.00%
- Median HH income
- $81,317
- Composite
- 51.63/100
- National rank
- #1704
- State rank
- #62 of 826 in TX
Livability — La Vernia
- Score
- 61/100
- State rank
- #994
- US rank
- #17682
Category grades
Schools grade is shown separately in the Schools card above.
Census & demographics
- Population (ZIP)
- 15,001
Population outlook (Wilson County) Hauer SSP2
- Today (2025)
- 58,434 people
- By 2030
- 63,912 · +9.4%
- By 2040
- 74,704 · +27.8%
- By 2050
- 85,024 · +45.5%
- By 2075
- 111,025 · +90.0%
- By 2100
- 126,692 · +116.8%
Race, ethnicity, and origin ACS 2023
- Neighborhood character
- Predominantly White (70%)
- Race & ethnicity
- White 70% Hispanic / Latino 23% Two or more races 14% Black 2%
- Hispanic origin (detail)
- Mexican 21%
- Common ancestry
- Romanian 5% Italian 3% Czech 1%
- Foreign-born
- 6% · Canada
- Languages at home
- 86% English-only · Spanish 12% Russian/Polish/Slavic 1%
Political lean MEDSL · Wilson
- 2024 margin
- Solid R (+53.7) · D 22.9% · R 76.6%
- 2008→2024 swing
- -19.8pp toward R · 2008: -33.9pp · 2024: -53.7pp
- All cycles
- 2024: R+53.7 2020: R+48.4 2016: R+47.8 2012: R+43.0 2008: R+33.9
Not yet ingested
- Civics
- —
Market trends
- HPI YoY
- ▼ -56.30%
- Current HPI
- 223.1249
- Rent YoY
- —
- Metro
- —
- State GDP YoY
- ▲ 3.95%
- F500 in state
- 110
Industry mix (Fortune 500 HQ in TX)
| Industry | F500 HQs | Revenue |
|---|---|---|
| Energy | 16 | $1,198B |
|
||
| Technology | 5 | $198B |
|
||
| Engineering / Construction | 4 | $72B |
|
||
| Energy Services | 3 | $60B |
|
||
| Utilities | 3 | $41B |
|
||
| Healthcare | 2 | $330B |
|
||
Price history
-2.2% since first listed2 events — show timeline
- 2026-04-25 Price Changed $439,900 LERA
- 2026-01-08 Listed $450,000 LERA
Property tax history
+5.0%/yrLatest (2025): $6,599 · +9.2% YoY. Source: county tax records.
Cash-flow waterfall
monthlySold comps — $/sqft
last 12 mo · ≤1 miLoading sold comps…