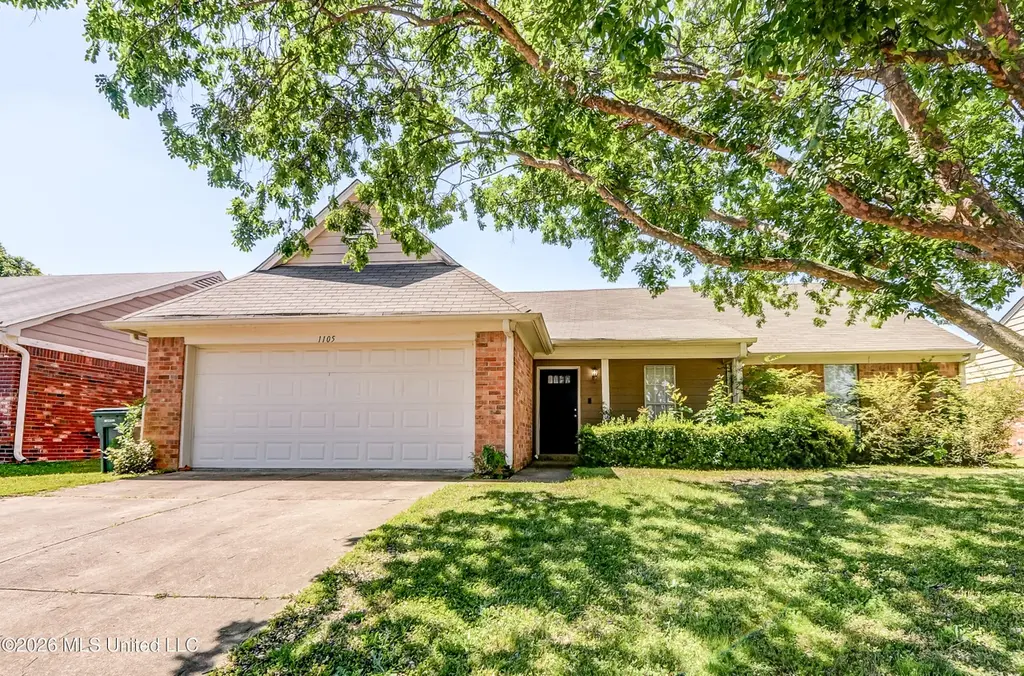
1105 S Parkview Cir Unit S · Southaven, MS
Flood risk 1/10 · Minimal
- FEMA flood zone
- X (unshaded)
- Chance of flooding over 30 yrs
- 0.0%
- Est. flood insurance / yr
- $507 – $1,088
Fire risk 3/10 · Minor
- Est. fire insurance / yr
- $1,241 – $2,305
Heat risk 7/10 · Major
- Hot days now (above 109°F)
- 7 days/yr
- Hot days in 30 yrs
- 21 days/yr
Wind risk 4/10 · Minor
- Chance of severe wind over 30 yrs
- 19.0%
Air-quality risk 2/10 · Minimal
- Unhealthy air days now
- 2 days/yr
- Unhealthy air days in 30 yrs
- 2 days/yr
Risk factors via First Street. Map © Google.
Why this score? — see what drove the D+ grade
The composite is a weighted blend of 9 inputs, each scored 0–100. Each bar is that input's sub-score; the figure is the points it added to the 100-point composite (weight × sub-score).
- ARV discount +15.0/15.0
- Cash flow +14.4/30.0
- DSCR +4.4/10.0
- Schools +4.0/10.0
- Rent growth +3.3/5.0
- Livability +3.2/5.0
- 1% rule +3.0/10.0
- Condition / age +2.5/5.0
- Appreciation +0.0/10.0
$215,000
🖨 Deal sheet 📄 Offer letter ✓ Due diligence
Listing remarks
This 3bedroom, 2bath home is located in a sought after neighborhood in Central Park area. A must see.
Key facts
- 7,405 sq ft lot
- 2 garage spots
- Built 2001
Property features AI
Finance
- HOA & community: Hiking/walking trails in the community
Exterior
- Parking: 2-car garage with garage door opener; Concrete driveway
- Security: Deadbolt locks
- Utilities: Public water; Public sewer; Electricity connected; Natural gas connected; Cable available
- Home design: Single-family house; One level
- Construction: Brick and wood siding exterior; Asphalt shingle roof; Brick/mortar and slab foundation; Built (year source: assessor)
- Exterior features: Patio; Rain gutters; Privacy wood fencing (full); Landscaped yard; Fenced lot
Interior
- Kitchen: Dishwasher; Disposal; Electric range
- Flooring: Carpet; Linoleum; Tile
- Bathrooms: 2 full bathrooms
- Heating & cooling: Central heating (forced air, natural gas); Central air conditioning; Ceiling fans
- Interior features: Ceiling fans; Eat-in kitchen; Pantry; Double vanity; Laundry room; Blinds and window treatments; Insulated windows; Deadbolt locks; Hinged insulated patio door
- Laundry & utility: Laundry room
Neighborhood map
What this means for you Summary
Snapshot
- This is a 3-bed/2.0-bath single-family listed at $215k.
Deal economics
- At list price, monthly cash flow is $45 ($541/yr) — positive.
- The deal already cash-flows at list — no discount required.
- To meet the 1% rule (rent ≥ 1% of price), the offer needs to be $173k (19.5% below list).
- Recommended offer: $173k (19.5% below list) — sets the bar for 1% rule.
- Cap rate 6.5% vs local median 5.2% in Southaven — meaningfully above typical; check what's discounted (condition, days-on-market, listing class) to confirm the premium yield is real.
Location & tenants
- Location reads 65/100 on livability (#107 in MS) — a middle-class / working-renter tenant base. Strengths: cost of living A+, housing A+; Watch: amenities F, commute F, health & safety F.
- Desoto County School District (suburban): math 48% / reading 42% proficiency, ranked #20 of 130 in MS (top 15%) — families likely to look elsewhere, expect single-tenant / working-renter base with shorter leases.
- Zoned schools: Greenbrook Elementary School (502 students, 99% FRL); Southaven Middle School (math 33% / reading 25%, grade F, #90 of 179 statewide, top 52%, 1,456 students, 100% FRL); Southaven High School (math 26% / reading 35%, grade F, #88 of 197 statewide, top 45%, 1,850 students, 100% FRL) — zoned schools average 100% FRL vs 43% district-wide (56 pts higher); higher-poverty schools than district average — tighter screening recommended.
- Zoned-school proficiency averages 30% at this address vs 45% district-wide (-15 pts) — the specific schools serving this property underperform the Desoto County School District average; the district grade overstates school quality for this exact location.
- Market conditions: Rents rising (+3.2%/yr); 193 active listings in the ZIP; 37 comparable units currently listed for rent nearby; rentals at typical pace (median 17d on market — plan ~3-4 weeks tenant-placement turnaround); 1,155 units permitted in DeSoto County in 2024 (0 in 5+ unit buildings).
- This rent runs 34% of the median local income ($62k/yr) — at the standard rent-burdened threshold; future hikes will face affordability resistance.
Forward outlook
- Local home prices are declining (-3.0%/yr); year-one equity from $1k of loan paydown is wiped out by about $6k of value loss. Plan a longer hold.
- DeSoto County population projected at +33% by 2050 — long-run rental-demand tailwind backs the buy-and-hold thesis.
Negotiation context
- It's been on market 16 days — a 2% lower offer ($212k) is reasonable based on typical stale-listing flexibility.
- 2 sale attempts since 9y ago with the ask held roughly flat each time — persistent listings suggest the price (not the market) is what's stuck; bring a comps-based counter.
Risks & watch-outs
- Climate carrying-cost: extreme-heat days projected 7→21/yr by 2055 (HVAC capex compounding) — expect insurance premiums to compound above CPI over the hold.
Questions for the listing agent
- Is there a deadline driving the sale (1031 exchange, divorce, estate, relocation)? That informs how much negotiation room exists.
- Schools are D-rated, which usually means shorter tenancies and higher turnover. Who's the typical renter profile here, and what's been the actual vacancy rate?
- The area grade is low — what's the realistic commute time and amenity access for the typical tenant pool here? Any planned neighborhood developments (good or bad) we should know about?
- What's the average days-on-market for RENTAL listings here right now (not sales)? A rising rental-DOM trend means longer vacancies and softer asking-rent achievability than the comps imply.
- What's the recent tenant-quality profile in this submarket — average credit score on applications, eviction rate, late-payment / NSF rate, and stable-employment percentage? A property-management company in the area should have these aggregated.
- How much new for-sale + rental construction is in the pipeline within 1–3 miles? Heavy new supply typically softens prices + rents 12–24 months out; constrained supply supports both.
Investment metrics
- 1% rule
- 0.80% ✗
- Cap rate
- 6.54%
- Cash-on-cash
- 0.90%
- DSCR
- 1.04
- GRM
- 10.4
CMA / ARV
- ARV (median comp)
- $286,847
- List price
- $215,000
- Delta
- -25.05%
- Verdict
- UNDERPRICED
- Comps
- 20 within 1.0 mi
Show comp detail 12 sales within ~0.75 mi
| Address | Dist | Beds/Ba | Sqft | Sold | Price | $/sf | Match |
|---|---|---|---|---|---|---|---|
| 719 White Ash Dr | 0.40mi | 3/2.0 | 1,364 (+5%) | 2mo | $202,000 | $148 | 71 |
| 967 Greencliff Dr | 0.49mi | 3/2.0 | 1,284 (-1%) | 8mo | $209,000 | $163 | 68 |
| 757 Greencliff Dr | 0.57mi | 3/2.0 | 1,342 (+3%) | 2mo | $255,000 | $190 | 66 |
| 1562 Sarah Ann Cv | 0.48mi | 3/2.0 | 1,356 (+4%) | 8mo | $230,000 | $170 | 64 |
| 8274 Willow Dr | 0.68mi | 3/2.0 | 1,314 (+1%) | 6mo | $252,000 | $192 | 61 |
| 7395 White Ash Dr | 0.53mi | 3/2.0 | 1,388 (+7%) | 6mo | $224,900 | $162 | 59 |
| 8145 Autumn Woods Dr | 0.45mi | 3/2.0 | 1,420 (+9%) | 9mo | $225,000 | $158 | 56 |
| 8311 Hackberry | 0.65mi | 3/2.0 | 1,415 (+9%) | 2mo | $245,000 | $173 | 53 |
| 1359 Greencliff Dr | 0.55mi | 3/2.0 | 1,439 (+11%) | 8mo | $269,000 | $187 | 49 |
| 1643 E Madison Cv | 0.61mi | 3/2.0 | 1,463 (+13%) | 10mo | $265,000 | $181 | 42 |
| 8287 Grayce Dr | 0.63mi | 3/2.0 | 1,463 (+13%) | 9mo | $249,900 | $171 | 42 |
| 421 Country Garden Dr | 0.74mi | 3/2.0 | 1,455 (+12%) | 9mo | $263,900 | $181 | 38 |
Match score weights: distance 35% · size 25% · config 20% · recency 20%. Top-matched comps best support the ARV.
Projected returns pro-forma
-3.0% appreciation · 3.2% rent growth · sell at horizon
- IRR
- -14.7%
- Equity multiple
- 0.47×
- Total profit
- $-31,696
- Equity at exit
- $32,057
- IRR
- -5.8%
- Equity multiple
- 0.62×
- Total profit
- $-22,771
- Equity at exit
- $18,589
Cash invested: $60,200 (down + closing). Projections, not guarantees.
Landlord ↔ Tenant lean methodology
- Overall (STATE)
- 90 Strongly Landlord-Friendly
- State Mississippi
- 90 Strongly Landlord-Friendly · R+11
- County
- — inherits STATE
- City
- — inherits STATE
ZIP-level market 38671
- Home prices YoY
- -18.2%
- Rents YoY
- 3.2%
- Active inventory
- 193
- Price-to-rent
- 10.4×
Monthly cashflow live
- Estimated rent
- $1,730 high interval (Pro) →
- Mortgage (P&I)
- −$1,127
- Tax from tax record
- −$105 /mo · $1,257/yr
- Insurance
- −$90
- HOA
- −$0
- Vacancy / Maint / Mgmt
- −$363
- Net cashflow
- $45
Break-even live
UW: 25.0% down · 7.5% · 30yr · 1.5% tax · 5.0% vac · 8.0% maint · 8.0% mgmt
Financing live
Cash to close
- Down payment
- $53,750
- Closing costs
- $6,450
- Reserves months
- —
- Total cash needed
- —
Loan-product check · same deal, 3 products live
Conventional
25% down · 7.5% · 30yr
- Down + closing
- —
- Monthly P&I
- —
- Monthly cashflow
- —
- DSCR
- —
- Eligible?
- —
Personal DTI + credit; lowest rate.
DSCR
20% down · 8.5% · 30yr
- Down + closing
- —
- Monthly P&I
- —
- Monthly cashflow
- —
- DSCR
- —
- Eligible?
- —
No personal income docs; deal must DSCR.
Hard money
10% down · 12.0% · 12mo
- Down + closing
- —
- Monthly P&I
- —
- Monthly cashflow
- —
- DSCR
- —
- Eligible?
- —
Short-term bridge; refi at stabilization.
Rent comps 37 comps
| Address | Beds | Baths | Sqft | Rent | $/sqft | DOM | Units | Dist |
|---|---|---|---|---|---|---|---|---|
| 7654 Stonycreek Cv Southaven, MS | 3.0 | 2.0 | 1293 | $1,650 | $1.28 | 21d | 1 | 0.32mi |
| 817 Barrington Woods Cv Southaven, MS | 2.0 | 1.5 | 1176 | $1,395 | $1.19 | 14d | 1 | 0.38mi |
| 7902 Hemlock Dr Southaven, MS | 3.0 | 2.0 | 1609 | $1,999 | $1.24 | 4d | 1 | 0.39mi |
| 818 Barrington Woods Cv Unit 817 Southaven, MS | 2.0 | 1.5 | 1176 | $1,395 | $1.19 | 14d | 1 | 0.39mi |
| 818 Barrington Woods Cv Unit 769-6 Southaven, MS | 2.0 | 2.0 | 1100 | $1,345 | $1.22 | 23d | 1 | 0.39mi |
| 1521 Miskelly Dr Unit 1 Southaven, MS | 3.0 | 2.0 | 1695 | $2,065 | $1.22 | 43d | 1 | 0.41mi |
| 769 Barrington Woods Cv Unit 6 Southaven, MS | 2.0 | 2.0 | 1100 | $1,345 | $1.22 | 23d | 1 | 0.43mi |
| 8035 Park Pike Dr Southaven, MS | 3.0 | 2.0 | 1340 | $1,695 | $1.26 | 3d | 1 | 0.54mi |
| 1688 Sarah Ann Dr W Southaven, MS | 3.0 | 2.0 | 1430 | $1,695 | $1.19 | 19d | 1 | 0.58mi |
| 494 Windridge Pt Southaven, MS | 3.0 | 2.0 | 1644 | $2,013 | $1.22 | 43d | 1 | 0.62mi |
| 1104 Atterbury Cir S Southaven, MS | 3.0 | 2.0 | 1366 | $1,660 | $1.22 | 43d | 1 | 0.62mi |
| 8085 Creekwood Cir E Southaven, MS | 2.0 | 2.0 | 1000 | $1,600 | $1.60 | 43d | 1 | 0.63mi |
| 1708 Cherry Rd Southaven, MS | 3.0 | 2.0 | 1606 | $1,780 | $1.11 | 11d | 1 | 0.64mi |
| 875 Hackberry Dr Southaven, MS | 3.0 | 2.0 | 1283 | $1,525 | $1.19 | 21d | 1 | 0.65mi |
| 863 Hackberry Dr Southaven, MS | 3.0 | 2.0 | 1500 | $1,665 | $1.11 | 3d | 1 | 0.65mi |
| 7896 Nature Walk Dr Southaven, MS | 3.0 | 2.0 | 1428 | $1,705 | $1.19 | 14d | 1 | 0.65mi |
| 8061 Creekwood Cir W Southaven, MS | 2.0 | 1.5 | 1300 | $1,550 | $1.19 | 16d | 1 | 0.67mi |
| 8161 Loden Cv Southaven, MS | 4.0 | 2.0 | 1840 | $2,040 | $1.11 | 43d | 1 | 0.68mi |
| 1820 Mary Payton Cv Southaven, MS | 3.0 | 2.0 | 1699 | $1,835 | $1.08 | 43d | 1 | 0.70mi |
| 970 Millcreek Pl Southaven, MS | 3.0 | 2.0 | 1253 | $1,550 | $1.24 | 14d | 1 | 0.70mi |
| 8274 Park Pike Dr Southaven, MS | 3.0 | 2.0 | 1365 | $1,765 | $1.29 | 1d | 1 | 0.73mi |
| 1865 Winners Cir N Southaven, MS | 3.0 | 2.0 | 1600 | $1,890 | $1.18 | 43d | 1 | 0.76mi |
| 1859 Winners Circle Cv Southaven, MS | 3.0 | 2.0 | 1773 | $2,145 | $1.21 | 3d | 1 | 0.76mi |
| 8181 Martin Dr Southaven, MS | 4.0 | 2.0 | 1750 | $1,970 | $1.13 | 16d | 1 | 0.77mi |
| 8375 Old Forge Rd Southaven, MS | 3.0 | 2.0 | 1080 | $1,295 | $1.20 | 4d | 1 | 0.78mi |
| 8278 Lake Shore Dr W Southaven, MS | 4.0 | 2.0 | 1584 | $1,750 | $1.10 | 14d | 1 | 0.81mi |
| 7875 Sarah Ann Dr S Southaven, MS | 3.0 | 2.0 | 1572 | $1,800 | $1.15 | 43d | 1 | 0.82mi |
| 845 Rockwall Cv Southaven, MS | 3.0 | 1.5 | 1229 | $1,450 | $1.18 | 43d | 1 | 0.83mi |
| 7711 Iris Cv Southaven, MS | 3.0 | 2.0 | 1284 | $1,710 | $1.33 | 2d | 1 | 0.92mi |
| 7456 Overlook Dr Southaven, MS | 2.0 | 2.0 | 1212 | $1,550 | $1.28 | 43d | 1 | 0.92mi |
| 330 Avery Jordan Cv Southaven, MS | 3.0 | 2.0 | 1221 | $1,605 | $1.31 | 4d | 1 | 0.98mi |
| 371 Alex Cv Southaven, MS | 3.0 | 2.0 | 1300 | $1,595 | $1.23 | 1d | 1 | 1.03mi |
| 7187 Gazebo Dr Southaven, MS | 2.0 | 2.0 | 1026 | $1,450 | $1.41 | 14d | 1 | 1.04mi |
| 8743 Greenbrook Pkwy Southaven, MS | 3.0 | 2.0 | 1229 | $1,590 | $1.29 | 21d | 1 | 1.08mi |
| 98 Stonebrook Cv Southaven, MS | 4.0 | 2.0 | 1451 | $1,500 | $1.03 | 43d | 1 | 1.28mi |
| 8082 Whitebrook Dr Southaven, MS | 3.0 | 1.0 | 1100 | $1,495 | $1.36 | 23d | 1 | 1.33mi |
| 8426 Linda Shore Cv Southaven, MS | 3.0 | 2.0 | 1780 | $1,910 | $1.07 | 4d | 1 | 1.38mi |
Listing history 5 events
-
2026-05-13$215,000 Active 101-char remark
-
2017-03-27soldstatus
-
2017-03-22soldstatus $124,000 Closed
-
2017-02-07$125,000 Active
-
2001-07-24soldstatus
ⓘ Source: listings_history table (triggers on properties + properties_extension) + one-shot
backfill from property_details.listing_events for pre-trigger history.
Tax reassessment forecast MS · Resets to sale price
- Current annual tax
- $1,257 · $105/mo
- Projected year-2 tax
- $1,699 · $142/mo
- Expected delta
- +$442/yr (+$37/mo · 35.1%)
ⓘ Screening estimate from a state-policy table — verify with the county assessor before closing.
Climate risk First Street
- Flood 1/10 Low FEMA zone X (unshaded) · 0% chance over 30 yrs
- Wildfire 3/10 Moderate
- Heat 7/10 Severe 7 d/yr ≥109°F today · 21 d/yr by 30 yrs out
- Wind 4/10 Moderate 19% chance of damaging wind over 30 yrs
- Air quality 2/10 Low 2 unhealthy d/yr today · 2 by 30 yrs out
Nearby sold comps map
Loading sold comps map…
Walkable amenities ~0.75 mi
Loading nearby amenities…
Taxation est. · year 1
- Rental income
- $20,763
- − Mortgage interest
- −$12,043
- − Property taxes
- −$1,257
- − Insurance
- −$1,075
- − Repairs & maintenance
- −$1,661
- − Management
- −$1,661
- − Depreciation
- −$6,255
- Taxable loss
- −$3,189
- Est. tax savings @ 24.0%
- +$765
- After-tax cash flow
- $1,306/yr
For passive investors: Depreciation is non-cash, so a rental often shows a tax loss while cash-flowing — sheltering income. Rental losses are passive: they offset passive income freely, and up to $25,000/yr can offset ordinary (W-2) income if you actively participate and your MAGI is under $100k (phasing out to $0 by $150k); unused losses carry forward. On sale, claimed depreciation is recaptured at up to 25%, and gains may owe capital-gains tax (a 1031 exchange can defer both). Figures are a year-1 estimate at your 24.0% rate — not tax advice; consult a CPA.
Schools (NCES district)
- District
- Desoto County School District
- NCES district ID
- 2801320
- Math proficiency
- 48% ▼ -13.00%
- Reading proficiency
- 42% ▼ -6.00%
- Median HH income
- $59,272
- Composite
- 39.56/100
- National rank
- #3933
- State rank
- #20 of 130 in MS
Livability — Southaven
- Score
- 65/100
- State rank
- #107
- US rank
- #12584
Category grades
Schools grade is shown separately in the Schools card above.
Census & demographics
- Census place
- Southaven, MS
- County
- DeSoto County · 176,513 people
- City population
- 53,755
- Metro
- Memphis, TN-MS-AR
- Population (ZIP)
- 37,319
- Household income
- $61,843
- Rent vs Own
- Severe rent burden
- 1583.0
Population outlook (DeSoto County) Hauer SSP2
- Today (2025)
- 203,338 people
- By 2030
- 217,692 · +7.1%
- By 2040
- 245,320 · +20.6%
- By 2050
- 270,133 · +32.8%
- By 2075
- 323,341 · +59.0%
- By 2100
- 348,742 · +71.5%
Race, ethnicity, and origin ACS 2023
- Neighborhood character
- Diverse neighborhood (Simpson 0.58)
- Race & ethnicity
- White 49% Black 42% Hispanic / Latino 6% Two or more races 4%
- Hispanic origin (detail)
- Mexican 3%
- Common ancestry
- Italian 1% Lithuanian 1% Serbian 1%
- Foreign-born
- 3% · Canada
- Languages at home
- 95% English-only · Spanish 4%
Political lean MEDSL · DeSoto
- 2024 margin
- Strong R (+24.1) · D 36.7% · R 60.8% · Other 2.5%
- 2008→2024 swing
- +14.2pp toward D · 2008: -38.2pp · 2024: -24.1pp
- All cycles
- 2024: R+24.1 2020: R+23.9 2016: R+34.8 2012: R+33.5 2008: R+38.2
Not yet ingested
- Civics
- —
Market trends
- HPI YoY
- ▼ -49.08%
- Current HPI
- 220.7875
- Rent YoY
- ▲ 3.20%
- Metro
- Memphis, TN-MS-AR
- State GDP YoY
- —
- F500 in state
- 0
Price history
+72.0% since first listed6 events — show timeline
- 2026-05-29 Pending — MLSU
- 2026-05-13 Listed $215,000 MLSU
- 2017-03-27 Sold (Public Records) — Public Records
- 2017-03-22 Sold (MLS) — Memphis Area Association of Realtors(R) MLS
- 2017-02-07 Listed $125,000 Memphis Area Association of Realtors(R) MLS
- 2001-07-24 Sold (Public Records) — Public Records
Property tax history
+16.2%/yrLatest (2025): $1,257 · +14.2% YoY. Source: county tax records.
Cash-flow waterfall
monthlySold comps — $/sqft
last 12 mo · ≤1 miLoading sold comps…