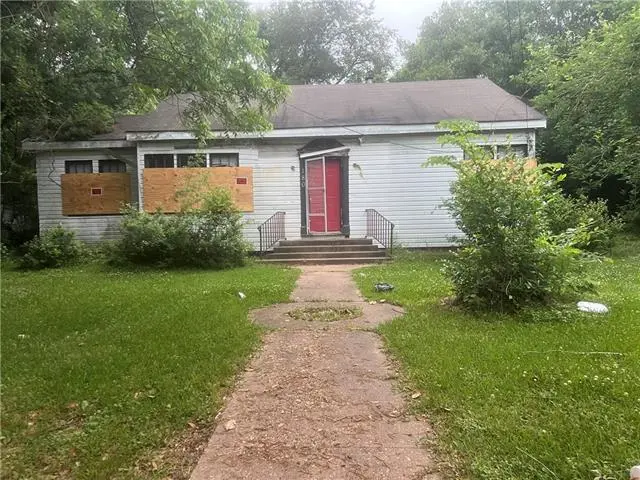
1808 Monroe St · Alexandria, LA
Flood risk 1/10 · Minimal
- FEMA flood zone
- X (shaded)
- Chance of flooding over 30 yrs
- 0.0%
- Est. flood insurance / yr
- $507 – $1,088
Fire risk 1/10 · Minimal
- Est. fire insurance / yr
- $1,269 – $2,357
Heat risk 8/10 · Major
- Hot days now (above 111°F)
- 7 days/yr
- Hot days in 30 yrs
- 19 days/yr
Wind risk 8/10 · Major
- Chance of severe wind over 30 yrs
- 98.0%
Air-quality risk 2/10 · Minimal
- Unhealthy air days now
- 1 days/yr
- Unhealthy air days in 30 yrs
- 1 days/yr
Risk factors via First Street. Map © Google.
Why this score? — see what drove the D grade
The composite is a weighted blend of 9 inputs, each scored 0–100. Each bar is that input's sub-score; the figure is the points it added to the 100-point composite (weight × sub-score).
- Cash flow +15.0/30.0
- ARV discount +7.5/15.0
- 1% rule +5.0/10.0
- DSCR +5.0/10.0
- Livability +3.2/5.0
- Schools +3.1/10.0
- Rent growth +2.5/5.0
- Condition / age +2.5/5.0
- Appreciation +0.0/10.0
$20,000
🖨 Deal sheet 📄 Offer letter ✓ Due diligence
Listing remarks
Investor Special - Rehab Opportunity This property is being sold as-is and presents a renovation project for experienced investors or buyers seeking a full rebuild opportunity. The home has been vandalized and is currently uninhabitable, with no active utilities. Condition and safety concerns will require caution when accessing the property. Ideal for those looking to restore, redesign, or potentially rebuild, this property offers a blank slate with substantial upside potential. Bring your vision and creativity--this is a chance to transform a distressed property into something new.
Key facts
- 0.39 acre lot
- Parking
- Built 1939
Property features AI
Exterior
- Parking: Carport
- Home design: Single-family residence
- Construction: Wood siding construction; Composition roof
- Exterior features: Composition roof; Wood siding
Interior
- Bedrooms: Bedroom 1; Bedroom 2; Bedroom 3
- Bathrooms: 1 full bathroom
- Heating & cooling: No central heating; No central cooling
- Interior features: Living room; Kitchen
Neighborhood map
What this means for you Summary
Snapshot
- This is a 3-bed/1.0-bath single-family listed at $20k.
Deal economics
- At list price, monthly cash flow is $1k ($14k/yr) — positive.
- The deal already cash-flows at list — no discount required.
- Meets the 1% rule at list price ($2k rent vs $20k).
- Recommended offer: $19k (3.0% below list) — sets the bar for market timing.
- Cap rate 73.9% vs local median 4.9% in Alexandria — top-decile yield for the area; either an underpriced asset or a hidden risk that comps aren't pricing in. Stress-test before assuming the spread holds.
Location & tenants
- Location reads 64/100 on livability (#160 in LA) — a middle-class / working-renter tenant base. Strengths: cost of living A+, housing A+, health & safety A+; Watch: crime F, amenities F, commute F.
- Rapides Parish (urban): math 29% / reading 44% proficiency, ranked #31 of 98 in LA (top 32%) — families likely to look elsewhere, expect single-tenant / working-renter base with shorter leases; 64% free/reduced lunch — lower-income household profile, screen leases tightly.
- Market conditions: 151 active listings in the ZIP; 1 comparable units currently listed for rent nearby; 239 units permitted in Rapides Parish in 2024 (0 in 5+ unit buildings).
Forward outlook
- Local home prices are declining (-3.0%/yr); year-one equity from $138 of loan paydown is wiped out by about $600 of value loss. Plan a longer hold.
- Rapides County population projected to shrink 6% by 2050 — rents likely to lag national; underwrite the cash flow, not the appreciation.
- At projected returns (-3.0% appreciation + 3.0% rent growth), your $6k cash investment doubles in ~1 year — after that, you're playing with house money.
Negotiation context
- It's been on market 51 days — a 3% lower offer ($19k) is reasonable based on typical stale-listing flexibility.
- 5 sale attempts since 8y ago with the ask held roughly flat each time — persistent listings suggest the price (not the market) is what's stuck; bring a comps-based counter.
Risks & watch-outs
- Watch-outs: built in 1939 — expect roof / HVAC / electrical / plumbing capex.
- Climate carrying-cost: severe wind risk, 98% chance of damaging wind over 30y; extreme-heat days projected 7→19/yr by 2055 (HVAC capex compounding) — expect insurance premiums to compound above CPI over the hold.
Questions for the listing agent
- It's been on market 51 days. Have you received any prior offers? Is the seller open to a 3% concession, seller financing, or rate buy-down credit?
- Built in 1939 — when were the roof, HVAC, electrical panel, plumbing, and water heater last replaced?
- Is there a deadline driving the sale (1031 exchange, divorce, estate, relocation)? That informs how much negotiation room exists.
- Crime grade is F in this area — have there been break-ins, vandalism, or insurance claims at this property in the last 3 years? What carrier currently insures it and at what premium?
- The area grade is low — what's the realistic commute time and amenity access for the typical tenant pool here? Any planned neighborhood developments (good or bad) we should know about?
- What's the average days-on-market for RENTAL listings here right now (not sales)? A rising rental-DOM trend means longer vacancies and softer asking-rent achievability than the comps imply.
- What's the recent tenant-quality profile in this submarket — average credit score on applications, eviction rate, late-payment / NSF rate, and stable-employment percentage? A property-management company in the area should have these aggregated.
- How much new for-sale + rental construction is in the pipeline within 1–3 miles? Heavy new supply typically softens prices + rents 12–24 months out; constrained supply supports both.
Investment metrics
- 1% rule
- 8.00% ✓
- Cap rate
- 73.85%
- Cash-on-cash
- 241.29%
- DSCR
- 11.74
- GRM
- 1.0
CMA / ARV
- ARV (median comp)
- $53,509
- List price
- $20,000
- Delta
- -62.62%
- Verdict
- UNDERPRICED
- Comps
- 20 within 1.0 mi
Show comp detail 7 sales within ~0.75 mi
| Address | Dist | Beds/Ba | Sqft | Sold | Price | $/sf | Match |
|---|---|---|---|---|---|---|---|
| 70-72 Ball Powell St Unit 70,72 | 0.16mi | 2/1.0 (-1) | 1,704 (-4%) | 1mo | $20,000 | $12 | 80 |
| 1907 Marye St | 0.39mi | 3/2.0 | 1,767 (-0%) | 3mo | $173,000 | $98 | 75 |
| 2110 Alma St | 0.27mi | 3/2.0 | 1,682 (-5%) | 8mo | $48,000 | $29 | 68 |
| 2216 Elliott St | 0.50mi | 3/2.0 | 1,668 (-6%) | 1mo | $59,000 | $35 | 62 |
| 2214 Alma St | 0.42mi | 3/1.0 | 1,530 (-14%) | 3mo | $15,000 | $10 | 55 |
| 2228 Marye St | 0.56mi | 3/2.0 | 1,922 (+8%) | 3mo | $170,000 | $88 | 53 |
| 2526 Avenue C | 0.68mi | 3/2.0 | 1,973 (+11%) | 7mo | $200,000 | $101 | 40 |
Match score weights: distance 35% · size 25% · config 20% · recency 20%. Top-matched comps best support the ARV.
Projected returns pro-forma
-3.0% appreciation · 3.0% rent growth · sell at horizon
- IRR
- —
- Equity multiple
- 13.23×
- Total profit
- $68,499
- Equity at exit
- $2,982
- IRR
- —
- Equity multiple
- 28.16×
- Total profit
- $152,091
- Equity at exit
- $1,729
Cash invested: $5,600 (down + closing). Projections, not guarantees.
Landlord ↔ Tenant lean methodology
- Overall (STATE)
- 90 Strongly Landlord-Friendly
- State Louisiana
- 90 Strongly Landlord-Friendly · R+12
- County
- — inherits STATE
- City
- — inherits STATE
ZIP-level market 71301
- Home prices YoY
- -23.0%
- Active inventory
- 151
- Price-to-rent
- 1.0×
Monthly cashflow live
- Estimated rent
- $1,600 medium interval (Pro) →
- Mortgage (P&I)
- −$105
- Tax from tax record
- −$25 /mo · $297/yr
- Insurance
- −$8
- HOA
- −$0
- Vacancy / Maint / Mgmt
- −$336
- Net cashflow
- $1,126
Break-even live
UW: 25.0% down · 7.5% · 30yr · 1.5% tax · 5.0% vac · 8.0% maint · 8.0% mgmt
Financing live
Cash to close
- Down payment
- $5,000
- Closing costs
- $600
- Reserves months
- —
- Total cash needed
- —
Loan-product check · same deal, 3 products live
Conventional
25% down · 7.5% · 30yr
- Down + closing
- —
- Monthly P&I
- —
- Monthly cashflow
- —
- DSCR
- —
- Eligible?
- —
Personal DTI + credit; lowest rate.
DSCR
20% down · 8.5% · 30yr
- Down + closing
- —
- Monthly P&I
- —
- Monthly cashflow
- —
- DSCR
- —
- Eligible?
- —
No personal income docs; deal must DSCR.
Hard money
10% down · 12.0% · 12mo
- Down + closing
- —
- Monthly P&I
- —
- Monthly cashflow
- —
- DSCR
- —
- Eligible?
- —
Short-term bridge; refi at stabilization.
Rent comps 1 comps
| Address | Beds | Baths | Sqft | Rent | $/sqft | DOM | Units | Dist |
|---|---|---|---|---|---|---|---|---|
| 1214 Jackson St Alexandria, LA | 2.0 | 2.0 | 2473 | $1,600 | $0.65 | 43d | 1 | 0.54mi |
Listing history 21 events
-
2026-06-19days on market $20,000 Active 51 DOM
-
2026-06-18days on market $20,000 Active 50 DOM
-
2026-06-17days on market $20,000 Active 49 DOM
-
2026-06-16days on market $20,000 Active 48 DOM
-
2026-06-15days on market $20,000 Active 47 DOM
-
2026-06-14days on market $20,000 Active 45 DOM
-
2026-06-13days on market $20,000 Active 44 DOM
-
2026-06-10days on market $20,000 Active 42 DOM
-
2026-06-09days on market $20,000 Active 41 DOM
-
2026-06-08days on market $20,000 Active 40 DOM
-
2026-06-07days on market $20,000 Active 39 DOM
-
2026-06-03days on market $20,000 Active 35 DOM
-
2026-06-02days on market $20,000 Active 34 DOM
-
2026-06-01days on market $20,000 Active 33 DOM
-
2026-05-31days on market $20,000 Active 32 DOM
-
2026-05-30days on market $20,000 Active 31 DOM
-
2026-04-29$20,000 Active 589-char remark
-
2019-10-07$49,000
-
2018-08-31$100,000
-
2018-06-22$56,000
-
2018-05-23$56,000
ⓘ Source: listings_history table (triggers on properties + properties_extension) + one-shot
backfill from property_details.listing_events for pre-trigger history.
Tax reassessment forecast LA · Resets to sale price
- Current annual tax
- $297 · $25/mo
- Projected year-2 tax
- $297 · $25/mo
- Expected delta
- $0/yr ($0/mo · 0.0%)
ⓘ Screening estimate from a state-policy table — verify with the county assessor before closing.
Climate risk First Street
- Flood 1/10 Low FEMA zone X (shaded) · 0% chance over 30 yrs
- Wildfire 1/10 Low
- Heat 8/10 Severe 7 d/yr ≥111°F today · 19 d/yr by 30 yrs out
- Wind 8/10 Severe 98% chance of damaging wind over 30 yrs
- Air quality 2/10 Low 1 unhealthy d/yr today · 1 by 30 yrs out
Nearby sold comps map
Loading sold comps map…
Walkable amenities ~0.75 mi
Loading nearby amenities…
Taxation est. · year 1
- Rental income
- $19,200
- − Mortgage interest
- −$1,120
- − Property taxes
- −$297
- − Insurance
- −$100
- − Repairs & maintenance
- −$1,536
- − Management
- −$1,536
- − Depreciation
- −$582
- Taxable income
- $14,029
- Est. tax owed @ 24.0%
- −$3,367
- After-tax cash flow
- $10,145/yr
For passive investors: Depreciation is non-cash, so a rental often shows a tax loss while cash-flowing — sheltering income. Rental losses are passive: they offset passive income freely, and up to $25,000/yr can offset ordinary (W-2) income if you actively participate and your MAGI is under $100k (phasing out to $0 by $150k); unused losses carry forward. On sale, claimed depreciation is recaptured at up to 25%, and gains may owe capital-gains tax (a 1031 exchange can defer both). Figures are a year-1 estimate at your 24.0% rate — not tax advice; consult a CPA.
Schools (NCES district)
- District
- Rapides Parish
- NCES district ID
- 2201290
- Math proficiency
- 29% ▼ -34.00%
- Reading proficiency
- 44% ▼ -29.00%
- Median HH income
- $41,057
- Composite
- 30.68/100
- National rank
- #6179
- State rank
- #31 of 98 in LA
Livability — Alexandria
- Score
- 64/100
- State rank
- #160
- US rank
- #13698
Category grades
Schools grade is shown separately in the Schools card above.
Census & demographics
- Census place
- Alexandria, LA
- City population
- 25,138
- Population (ZIP)
- 17,266
Population outlook (Rapides County) Hauer SSP2
- Today (2025)
- 133,047 people
- By 2030
- 132,333 · -0.5%
- By 2040
- 129,355 · -2.8%
- By 2050
- 124,535 · -6.4%
- By 2075
- 110,338 · -17.1%
- By 2100
- 88,641 · -33.4%
Race, ethnicity, and origin ACS 2023
- Neighborhood character
- Diverse neighborhood (Simpson 0.58)
- Race & ethnicity
- Black 53% White 36% Hispanic / Latino 4% Two or more races 3% Asian 2%
- Common ancestry
- Lithuanian 5% Portuguese 1% Hispanic 1%
- Foreign-born
- 6% · Canada, Vietnam
- Languages at home
- 93% English-only · Spanish 3% Other Asian/Pacific 2% French/Haitian/Cajun 1%
Political lean MEDSL · Rapides
- 2024 margin
- Solid R (+36.8) · D 31.0% · R 67.7% · Other 1.3%
- 2008→2024 swing
- -8.1pp toward R · 2008: -28.7pp · 2024: -36.8pp
- All cycles
- 2024: R+36.8 2020: R+32.1 2016: R+32.5 2012: R+29.6 2008: R+28.7
Not yet ingested
- Civics
- —
Market trends
- HPI YoY
- ▼ -55.38%
- Current HPI
- 184.9889
- Rent YoY
- —
- Metro
- —
- State GDP YoY
- ▲ 3.29%
- F500 in state
- 10
Industry mix (Fortune 500 HQ in LA)
| Industry | F500 HQs | Revenue |
|---|---|---|
| Telecommunications | 2 | $23B |
|
||
| Utilities | 1 | $12B |
|
||
| Wholesale / Distribution | 1 | $5B |
|
||
| Advertising | 1 | $2B |
|
||
Price history
-64.3% since first listed5 events — show timeline
- 2026-04-29 Listed $20,000 AcadianaMLS
- 2019-10-07 Listed $49,000 AcadianaMLS
- 2018-08-31 Listed $100,000 AcadianaMLS
- 2018-06-22 Listed $56,000 AcadianaMLS
- 2018-05-23 Listed $56,000 AcadianaMLS
Property tax history
+0.3%/yrLatest (2025): $297 · -1.6% YoY. Source: county tax records.
Cash-flow waterfall
monthlySold comps — $/sqft
last 12 mo · ≤1 miLoading sold comps…