 8-Plex
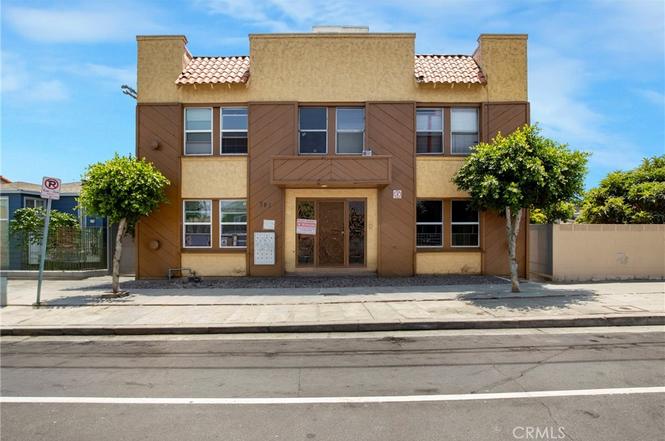
383 W 14th St · Los Angeles, CA
Flood risk 1/10 · Minimal
- FEMA flood zone
- X (unshaded)
- Chance of flooding over 30 yrs
- 0.0%
- Est. flood insurance / yr
- $507 – $1,088
Fire risk 1/10 · Minimal
- Est. fire insurance / yr
- $659 – $1,223
Heat risk 3/10 · Minor
- Hot days now (above 84°F)
- 7 days/yr
- Hot days in 30 yrs
- 23 days/yr
Wind risk 1/10 · Minimal
- Chance of severe wind over 30 yrs
- —
Air-quality risk 3/10 · Minor
- Unhealthy air days now
- 4 days/yr
- Unhealthy air days in 30 yrs
- 4 days/yr
Risk factors via First Street. Map © Google.
Why this score? — see what drove the C- grade
The composite is a weighted blend of 9 inputs, each scored 0–100. Each bar is that input's sub-score; the figure is the points it added to the 100-point composite (weight × sub-score).
- Cash flow +25.4/30.0
- DSCR +8.4/10.0
- 1% rule +6.0/10.0
- Schools +3.6/10.0
- Livability +3.4/5.0
- Condition / age +2.5/5.0
- Rent growth +2.1/5.0
- ARV discount +1.3/15.0
- Appreciation +0.0/10.0
$1,450,000
🖨 Deal sheet (PDF) 📄 Offer letter ✓ Due diligence
Multi-family units
County records classify this as Multi-Family (5+ Unit). Listing-text estimate: 8 units. confirmed
5+ unit building — per-unit beds/baths from public records are typically unavailable; the breakdown below (if shown) is an estimate from the listing text.
Listing remarks
8 Unit Apartment Complex Near Waterfront Development in one of the fastest-growing rental pockets of Los Angeles. The property consists of all 1 bed/1 bath units, generating $12,918/month in current rental income (including projected rent for 1 Vacant unit). Offered at a 7% CAP rate and 9.3 GRM, this is the strongest cash-flowing multifamily opportunities in San Pedro for a well maintained property. * * * Major capital improvements include electrical, plumbing, exterior paint, reinforced foundation, and roof work, 7 of the 8 units have been renovated. Potential to add ADUs in the rear (Buyer to Verify). * * * Located near the massive San Pedro waterfront redevelopment with over $500M
Key facts
- Renovated units
- Roof work
- 4,807 sq ft lot
Tags
Property features AI
Finance
- Other: Tenants pay gas and electricity; Reserve expense listed separately
- Financial info: Total building area reported as 5,180; Gross income / gross scheduled income reported as $155,016; Net operating income reported as $101,510; Operating expenses reported as $49,696 (breakdown includes maintenance, insurance, water/sewer, taxes); Laundry income reported; Vacancy allowance reported
- HOA & community: Community apartment common interest; Rent control in effect
Exterior
- Parking: Four uncovered parking spaces (total 4 parking spaces)
- Security: No security features provided
- Utilities: Public sewer; District/Public water; One separate water meter; Nine separate gas meters; Nine separate electric meters
- Home design: Attached community apartment; One building with two stories; Two or more common walls
- Construction: Year built source: Assessor
- Exterior features: No pool; Walkstreet lot feature; Street lighting and urban community setting
Interior
- Kitchen: No specific kitchen appliance details provided
- Bedrooms: Eight 1-bedroom units (each unit listed as 1 bed)
- Flooring: No flooring details provided
- Bathrooms: Eight full bathrooms (each unit listed as 1 full bath)
- Heating & cooling: No heating or cooling details provided
- Interior features: Two levels; Entry at level 1
- Laundry & utility: No on-site laundry listed; Laundry income reported (small amount)
Neighborhood map
What this means for you Summary
Snapshot
- This is a 8 × 1-bed/1.0-bath units multifamily listed at $1.45M.
Deal economics
- At list price, monthly cash flow is $3k ($40k/yr) — positive. Per door: $415/mo.
- The deal already cash-flows at list — no discount required.
- Meets the 1% rule at list price ($16k rent vs $1.45M).
- Cap rate 9.0% vs local median 2.1% in Los Angeles — top-decile yield for the area; either an underpriced asset or a hidden risk that comps aren't pricing in. Stress-test before assuming the spread holds.
Location & tenants
- Location reads 68/100 on livability (#273 in CA) — a middle-class / working-renter tenant base. Strengths: amenities A+, commute A+, employment B; Watch: health & safety C-, crime F, cost of living F.
- Los Angeles Unified (urban): math 29% / reading 54% proficiency, ranked #223 of 517 in CA (top 43%) — families likely to look elsewhere, expect single-tenant / working-renter base with shorter leases; 67% free/reduced lunch — lower-income household profile, screen leases tightly.
- Zoned schools: Fifteenth Street Elementary (397 students, 90% FRL); Richard Henry Dana Middle (1,424 students, 82% FRL); San Pedro Senior High (math 30% / reading 50%, grade F, #520 of 1,170 statewide, top 45%, 2,582 students, 67% FRL).
- Market conditions: Rents soft (-1.4%/yr); 123 active listings in the ZIP; 2 comparable units currently listed for rent nearby; solid renter incomes; 19,697 units permitted in Los Angeles County in 2024 (9,426 in 5+ unit buildings).
- At $16,010/mo this rent would consume 251% of the median local household income ($76k/yr) (locally 4568% of renters already pay >50% of income on rent) — very limited rent-growth headroom before tenants either downsize or default.
Forward outlook
- Local home prices are declining (-3.0%/yr); year-one equity from $10k of loan paydown is wiped out by about $44k of value loss. Plan a longer hold.
- Los Angeles County population projected at +9% by 2050 — modest demand growth; plan on rents tracking national, not racing it.
Negotiation context
- Only 11 days on market — expect competitive offers; lowballing is unlikely to land.
- 4 sale attempts since 25y ago with the ask held roughly flat each time — persistent listings suggest the price (not the market) is what's stuck; bring a comps-based counter.
- Current owner paid $880k; list at $1.45M implies a 65% gain — meaningful room to come down on a strong offer.
Risks & watch-outs
- Watch-outs: built in 1923 — expect roof / HVAC / electrical / plumbing capex.
Questions for the listing agent
- Can we see the unit-by-unit rent roll, current vacancy, and any below-market leases? What's the average tenancy length?
- What capital expenditures (roof, boiler, parking lot, exteriors) have been made in the last 5 years, and what's planned in the next 2?
- Built in 1923 — when were the roof, HVAC, electrical panel, plumbing, and water heater last replaced?
- Is there a deadline driving the sale (1031 exchange, divorce, estate, relocation)? That informs how much negotiation room exists.
- Schools are D-rated, which usually means shorter tenancies and higher turnover. Who's the typical renter profile here, and what's been the actual vacancy rate?
- Crime grade is F in this area — have there been break-ins, vandalism, or insurance claims at this property in the last 3 years? What carrier currently insures it and at what premium?
- What's the average days-on-market for RENTAL listings here right now (not sales)? A rising rental-DOM trend means longer vacancies and softer asking-rent achievability than the comps imply.
- What's the recent tenant-quality profile in this submarket — average credit score on applications, eviction rate, late-payment / NSF rate, and stable-employment percentage? A property-management company in the area should have these aggregated.
- How much new apartment / multifamily construction is in the pipeline within 1–3 miles? Heavy new supply (>2% of stock underway) typically softens rents 12–24 months out; light construction supports rent growth.
Investment metrics
- 1% rule
- 1.10% ✓
- Cap rate
- 9.04%
- Cash-on-cash
- 9.80%
- DSCR
- 1.44
- GRM
- 7.5
CMA / ARV
- ARV (on-the-fly)
- $1,274,280
- Comps found
- 2
Show comp detail 2 sales within ~0.75 mi
| Address | Dist | Beds/Ba | Sqft | Sold | Price | $/sf | Match |
|---|---|---|---|---|---|---|---|
| 423 W 19th St | 0.32mi | 10/8.0 | 5,590 (+8%) | 15mo | $1,335,056 | $239 | 60 |
| 358 W 17th | 0.16mi | 9/5.0 (-1) | 4,547 (-12%) | 3mo | $1,120,000 | $246 | 53 |
Match score weights: distance 35% · size 25% · config 20% · recency 20%. Top-matched comps best support the ARV.
Projected returns pro-forma
-3.0% appreciation · 0.0% rent growth · sell at horizon
- IRR
- -4.8%
- Equity multiple
- 0.83×
- Total profit
- $-70,827
- Equity at exit
- $216,200
- IRR
- 1.1%
- Equity multiple
- 1.07×
- Total profit
- $28,262
- Equity at exit
- $125,369
Cash invested: $406,000 (down + closing). Projections, not guarantees.
Landlord ↔ Tenant lean methodology
- Overall (CITY)
- 0 Strongly Tenant-Friendly
- State California
- 18 Strongly Tenant-Friendly · D+13
- County
- — inherits STATE
- City Los Angeles
- 0 Strongly Tenant-Friendly · D+22
ZIP-level market 90731
- Rents YoY
- -1.4%
- Active inventory
- 123
- Price-to-rent
- 60.4×
Monthly cashflow live
- Estimated rent
- $16,010 high interval (Pro) →
- Mortgage (P&I)
- −$7,604
- Tax from tax record
- −$1,123 /mo · $13,478/yr
- Insurance
- −$604
- HOA
- −$0
- Vacancy / Maint / Mgmt
- −$3,362
- Net cashflow
- $3,317
Break-even live
Sensitivity live
| Price | -10% $4,137 | -5% $3,727 | +0% $3,317 | +5% $2,906 | +10% $2,496 |
|---|---|---|---|---|---|
| Rent | -10% $2,052 | -5% $2,684 | +0% $3,317 | +5% $3,949 | +10% $4,581 |
| Rate | -1.0pp $4,047 | -0.5pp $3,685 | base $3,317 | +0.5pp $2,941 | +1.0pp $2,559 |
8-unit breakdown (identical units grouped — click to expand)
| Units | Beds | Baths | Est. rent |
|---|---|---|---|
| 8× units | 1 | 1 | $16,008 |
| #1 | 1 | 1 | $2,001 |
| #2 | 1 | 1 | $2,001 |
| #3 | 1 | 1 | $2,001 |
| #4 | 1 | 1 | $2,001 |
| #5 | 1 | 1 | $2,001 |
| #6 | 1 | 1 | $2,001 |
| #7 | 1 | 1 | $2,001 |
| #8 | 1 | 1 | $2,001 |
| Total (8 units) | $16,010 | ||
UW: 25.0% down · 7.5% · 30yr · 1.5% tax · 5.0% vac · 8.0% maint · 8.0% mgmt
Financing live
Cash to close
- Down payment
- $362,500
- Closing costs
- $43,500
- Reserves months
- —
- Total cash needed
- —
Loan-product check · same deal, 3 products live
Conventional
25% down · 7.5% · 30yr
- Down + closing
- —
- Monthly P&I
- —
- Monthly cashflow
- —
- DSCR
- —
- Eligible?
- —
Personal DTI + credit; lowest rate.
DSCR
20% down · 8.5% · 30yr
- Down + closing
- —
- Monthly P&I
- —
- Monthly cashflow
- —
- DSCR
- —
- Eligible?
- —
No personal income docs; deal must DSCR.
Hard money
10% down · 12.0% · 12mo
- Down + closing
- —
- Monthly P&I
- —
- Monthly cashflow
- —
- DSCR
- —
- Eligible?
- —
Short-term bridge; refi at stabilization.
Rent comps 2 comps
| Address | Beds | Baths | Sqft | Rent | $/sqft | DOM | Units | Dist |
|---|---|---|---|---|---|---|---|---|
| 523 W 12th St Unit 5 San Pedro, CA | 10.0 | 10.0 | 3928 | $2,650 | $0.67 | 26d | 1 | 0.25mi |
| 523 W 12th St San Pedro, CA | 10.0 | 10.0 | 3928 | $2,650 | $0.67 | 45d | 1 | 0.25mi |
Listing history 7 events
-
2026-06-21days on market $1,450,000 Active 11 DOM
-
2026-06-18days on market $1,450,000 Active 8 DOM
-
2026-06-17days on market $1,450,000 Active 7 DOM
-
2026-06-16days on market $1,450,000 Active 6 DOM
-
2026-06-15days on market $1,450,000 Active 5 DOM
-
2026-06-13remarks 699-char remark
-
2026-06-13$1,450,000 Active 3 DOM
ⓘ Source: listings_history table (triggers on properties + properties_extension) + one-shot
backfill from property_details.listing_events for pre-trigger history.
Tax reassessment forecast CA · Resets to sale price
- Current annual tax
- $13,478 · $1,123/mo
- Projected year-2 tax
- $13,478 · $1,123/mo
- Expected delta
- $0/yr ($0/mo · 0.0%)
ⓘ Screening estimate from a state-policy table — verify with the county assessor before closing.
Climate risk First Street
- Flood 1/10 Low FEMA zone X (unshaded) · 0% chance over 30 yrs
- Wildfire 1/10 Low
- Heat 3/10 Moderate 7 d/yr ≥84°F today · 23 d/yr by 30 yrs out
- Wind 1/10 Low
- Air quality 3/10 Moderate 4 unhealthy d/yr today · 4 by 30 yrs out
Nearby sold comps map
Loading sold comps map…
Walkable amenities ~0.75 mi
Loading nearby amenities…
Taxation est. · year 1
- Rental income
- $192,120
- − Mortgage interest
- −$81,223
- − Property taxes
- −$13,478
- − Insurance
- −$7,250
- − Repairs & maintenance
- −$15,370
- − Management
- −$15,370
- − Depreciation
- −$42,182
- Taxable income
- $17,248
- Est. tax owed @ 24.0%
- −$4,140
- After-tax cash flow
- $35,660/yr
For passive investors: Depreciation is non-cash, so a rental often shows a tax loss while cash-flowing — sheltering income. Rental losses are passive: they offset passive income freely, and up to $25,000/yr can offset ordinary (W-2) income if you actively participate and your MAGI is under $100k (phasing out to $0 by $150k); unused losses carry forward. On sale, claimed depreciation is recaptured at up to 25%, and gains may owe capital-gains tax (a 1031 exchange can defer both). Figures are a year-1 estimate at your 24.0% rate — not tax advice; consult a CPA.
Schools (NCES district)
- District
- Los Angeles Unified
- NCES district ID
- 0622710
- Math proficiency
- 29% ▼ -4.00%
- Reading proficiency
- 54% ▲ 10.00%
- Median HH income
- $50,403
- Composite
- 35.67/100
- National rank
- #4875
- State rank
- #223 of 517 in CA
Livability — Los Angeles
- Score
- 68/100
- State rank
- #273
- US rank
- #9237
Category grades
Schools grade is shown separately in the Schools card above.
Census & demographics
- Census place
- Los Angeles, CA
- County
- Los Angeles County · 9,444,647 people
- City population
- 3,838,149
- Metro
- Los Angeles-Long Beach-Anaheim, CA
- Population (ZIP)
- 61,944
- Household income
- $76,395
- Rent vs Own
- Severe rent burden
- 4568.0
Population outlook (Los Angeles County) Hauer SSP2
- Today (2025)
- 10,940,515 people
- By 2030
- 11,256,481 · +2.9%
- By 2040
- 11,729,929 · +7.2%
- By 2050
- 11,948,407 · +9.2%
- By 2075
- 11,818,114 · +8.0%
- By 2100
- 10,842,928 · -0.9%
Race, ethnicity, and origin ACS 2023
- Neighborhood character
- Diverse neighborhood (Simpson 0.60)
- Race & ethnicity
- Hispanic / Latino 57% White 27% Two or more races 18% Asian 5% Black 5% Native American 1%
- Hispanic origin (detail)
- Mexican 44%
- Common ancestry
- Lithuanian 1% Slovak 1% Romanian 1%
- Foreign-born
- 26% · Canada, South Korea, Jamaica
- Languages at home
- 53% English-only · Spanish 39% Other Indo-European 2% Other Asian/Pacific 2%
Political lean MEDSL · Los Angeles
- 2024 margin
- Solid D (+32.9) · D 64.8% · R 31.9% · Other 3.3%
- 2008→2024 swing
- -7.4pp toward R · 2008: 40.4pp · 2024: 32.9pp
- All cycles
- 2024: D+32.9 2020: D+44.2 2016: D+48.0 2012: D+40.0 2008: D+40.4
Not yet ingested
- Civics
- —
Market trends
- HPI YoY
- ▼ -781.38%
- Current HPI
- 310.5659
- Rent YoY
- ▼ -1.44%
- Metro
- Los Angeles-Long Beach-Anaheim, CA
- State GDP YoY
- ▲ 3.21%
- F500 in state
- 116
Industry mix (Fortune 500 HQ in CA)
| Industry | F500 HQs | Revenue |
|---|---|---|
| Technology | 27 | $1,492B |
|
||
| Financial Services | 3 | $174B |
|
||
| Retail | 3 | $44B |
|
||
| Insurance | 3 | $26B |
|
||
| Media / Entertainment | 2 | $115B |
|
||
| Pharmaceuticals / Biotech | 2 | $62B |
|
||
Price history
+538.8% since first listed26 events — show timeline
- 2026-06-10 Listed $1,450,000 CRMLS
- 2026-03-27 Price Changed — TheMLS
- 2026-01-05 Price Changed — TheMLS
- 2025-11-05 Listed — TheMLS
- 2016-02-09 Sold (Public Records) $880,000 Public Records
- 2012-12-21 Price Changed $192,000 CRMLS
- 2012-12-21 Price Changed $192,000 CRMLS
- 2012-12-21 Price Changed $192,000 CRMLS
- 2012-12-21 Price Changed $192,000 CRMLS
- 2003-04-30 Sold (MLS) $352,000 CRMLS
- 2003-01-09 Listed $359,000 CRMLS
- 2001-11-28 Sold (Public Records) $352,000 Public Records
- 2001-10-07 Price Changed $359,000 CRMLS
- 2001-10-07 Price Changed $359,000 CRMLS
- 2001-10-07 Price Changed $359,000 CRMLS
- 2001-10-07 Price Changed $359,000 CRMLS
- 2001-10-06 Price Changed $1,375,000 CRMLS
- 2001-10-06 Price Changed $1,375,000 CRMLS
- 2001-10-06 Price Changed $1,375,000 CRMLS
- 2001-05-17 Listing Removed — CRMLS
- 2001-01-21 Listed $359,000 CRMLS
- 1999-11-15 Price Changed $359,000 CRMLS
- 1999-11-15 Price Changed $359,000 CRMLS
- 1999-11-15 Price Changed $359,000 CRMLS
- 1999-11-15 Price Changed $359,000 CRMLS
- 1984-07-03 Sold (Public Records) $227,000 Public Records
Property tax history
+5.5%/yrLatest (2025): $13,478 · +1.5% YoY. Source: county tax records.
Cash-flow waterfall
monthlySold comps — $/sqft
last 12 mo · ≤1 miLoading sold comps…