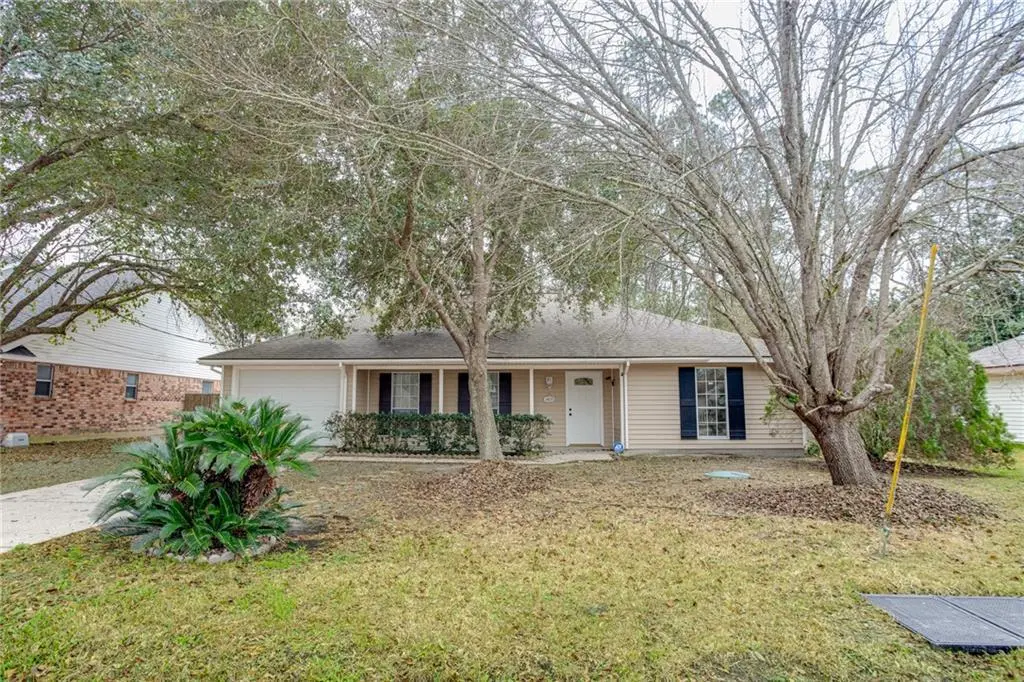
1405 Live Oak St · Slidell, LA
Flood risk 4/10 · Minor
- FEMA flood zone
- X
- Chance of flooding over 30 yrs
- 0.13%
- Est. flood insurance / yr
- $507 – $1,088
Fire risk 5/10 · Moderate
- Est. fire insurance / yr
- $1,269 – $2,357
Heat risk 10/10 · Severe
- Hot days now (above 108°F)
- 7 days/yr
- Hot days in 30 yrs
- 21 days/yr
Wind risk 9/10 · Severe
- Chance of severe wind over 30 yrs
- 99.0%
Air-quality risk 2/10 · Minimal
- Unhealthy air days now
- 1 days/yr
- Unhealthy air days in 30 yrs
- 2 days/yr
Risk factors via First Street. Map © Google.
Why this score? — see what drove the D grade
The composite is a weighted blend of 9 inputs, each scored 0–100. Each bar is that input's sub-score; the figure is the points it added to the 100-point composite (weight × sub-score).
- Cash flow +12.1/30.0
- ARV discount +9.3/15.0
- Schools +4.3/10.0
- Rent growth +4.0/5.0
- DSCR +3.6/10.0
- Livability +3.5/5.0
- 1% rule +2.9/10.0
- Condition / age +2.5/5.0
- Appreciation +0.0/10.0
$199,000
🖨 Deal sheet 📄 Offer letter ✓ Due diligence
Listing remarks MLS
Great split floor plan move in ready! Covered front porch, open foyer into living room with cathedral ceilings. Bonus room great for office or a 4th bedroom. Privacy fenced backyard. Nearby restaurants, shopping, and I-10. New Counter Tops, House Freshly Painted, Flood Zone C - 4 year old roof! Schedule your showing today!
Key facts
- Covered front porch
- Split floor plan
- Cathedral ceilings
Tags
Neighborhood map
What this means for you Summary
Snapshot
- This is a 3-bed/2.0-bath single-family listed at $199k.
Deal economics
- At list price, monthly cash flow is $-45 ($-540/yr) — negative.
- To cash-flow at today's rent, offer at most $191k (4.0% below list).
- To meet the 1% rule (rent ≥ 1% of price), the offer needs to be $157k (21.2% below list).
- Recommended offer: $157k (21.2% below list) — sets the bar for 1% rule.
Location & tenants
- Location reads 70/100 on livability (#57 in LA) — a middle-class / working-renter tenant base. Strengths: cost of living A+, housing A+, health & safety A+; Watch: amenities F, commute F.
- St. Tammany Parish (suburban): math 43% / reading 55% proficiency, ranked #11 of 98 in LA (top 11%) — families likely to look elsewhere, expect single-tenant / working-renter base with shorter leases.
- Market conditions: Rents rising fast (+5.9%/yr); 241 active listings in the ZIP; 5 comparable units currently listed for rent nearby; rentals lingering (median 44d on market — plan ~5-8 weeks vacancy on turnover, expect pricing pressure); 80% of comp listings sitting > 30 days — soft ceiling on asking rent; 1,064 units permitted in St. Tammany Parish in 2024 (0 in 5+ unit buildings).
- This rent runs 30% of the median local income ($63k/yr) — at the standard rent-burdened threshold; future hikes will face affordability resistance.
Forward outlook
- Local home prices are declining (-3.0%/yr); year-one equity from $1k of loan paydown is wiped out by about $6k of value loss. Plan a longer hold.
- St. Tammany County population projected at +27% by 2050 — long-run rental-demand tailwind backs the buy-and-hold thesis.
Negotiation context
- It's been on market 122 days — a 12% lower offer ($175k) is reasonable based on typical stale-listing flexibility.
- 8 sale attempts since 18y ago; this cycle's ask has dropped $16k (7%) from the opening price — seller is motivated, your offer sets the floor, not the list.
- Current owner paid $125k; list at $199k implies a 59% gain — meaningful room to come down on a strong offer.
Risks & watch-outs
- Climate carrying-cost: severe wind risk, 99% chance of damaging wind over 30y; moderate wildfire risk; extreme-heat days projected 7→21/yr by 2055 (HVAC capex compounding) — expect insurance premiums to compound above CPI over the hold.
Questions for the listing agent
- What do current leases actually rent for vs. the listed asking? Can we see a recent rent roll and the last 12 months of T-12 income?
- It's been on market 122 days. Have you received any prior offers? Is the seller open to a 21% concession, seller financing, or rate buy-down credit?
- Why hasn't it sold? Are there any deal-killer items the seller is aware of (foundation, flood, title, zoning, code violations)?
- Is there a deadline driving the sale (1031 exchange, divorce, estate, relocation)? That informs how much negotiation room exists.
- Schools are B-rated — typically a magnet for longer-tenancy family renters. What's the average tenant stay here, and is there a school-zone premium baked into asking?
- The area grade is low — what's the realistic commute time and amenity access for the typical tenant pool here? Any planned neighborhood developments (good or bad) we should know about?
- What's the average days-on-market for RENTAL listings here right now (not sales)? A rising rental-DOM trend means longer vacancies and softer asking-rent achievability than the comps imply.
- What's the recent tenant-quality profile in this submarket — average credit score on applications, eviction rate, late-payment / NSF rate, and stable-employment percentage? A property-management company in the area should have these aggregated.
- How much new for-sale + rental construction is in the pipeline within 1–3 miles? Heavy new supply typically softens prices + rents 12–24 months out; constrained supply supports both.
Investment metrics
- 1% rule
- 0.79% ✗
- Cap rate
- 6.02%
- Cash-on-cash
- -0.97%
- DSCR
- 0.96
- GRM
- 10.6
CMA / ARV
- ARV (median comp)
- $207,266
- List price
- $199,000
- Delta
- -3.99%
- Verdict
- FAIR
- Comps
- 20 within 1.0 mi
Show comp detail 9 sales within ~0.75 mi
| Address | Dist | Beds/Ba | Sqft | Sold | Price | $/sf | Match |
|---|---|---|---|---|---|---|---|
| 1383 Cherry St | 0.07mi | 3/2.0 | 1,269 (-3%) | 8mo | $202,000 | $159 | 85 |
| 1556 Cherry St | 0.33mi | 3/2.0 | 1,305 (-0%) | 11mo | $205,000 | $157 | 76 |
| 1417 Hickory St | 0.16mi | 3/2.0 | 1,200 (-8%) | 4mo | $171,000 | $143 | 75 |
| 1529 Beech St | 0.24mi | 3/2.0 | 1,364 (+4%) | 10mo | $205,000 | $150 | 73 |
| 1427 Cherry St | 0.09mi | 3/2.0 | 1,355 (+4%) | 23mo | $179,600 | $133 | 71 |
| 1632 Live Oak St | 0.47mi | 3/2.0 | 1,300 (-0%) | 9mo | $215,000 | $165 | 70 |
| 1513 Live Oak St | 0.16mi | 3/2.0 | 1,271 (-3%) | 22mo | $195,000 | $153 | 69 |
| 35305 Rose St | 0.56mi | 3/2.0 | 1,400 (+7%) | 3mo | $210,000 | $150 | 60 |
| 1633 Cherry St | 0.47mi | 3/2.0 | 1,201 (-8%) | 13mo | $208,000 | $173 | 54 |
Match score weights: distance 35% · size 25% · config 20% · recency 20%. Top-matched comps best support the ARV.
Projected returns pro-forma
-3.0% appreciation · 5.91% rent growth · sell at horizon
- IRR
- -14.9%
- Equity multiple
- 0.45×
- Total profit
- $-30,416
- Equity at exit
- $29,672
- IRR
- -2.3%
- Equity multiple
- 0.83×
- Total profit
- $-9,712
- Equity at exit
- $17,206
Cash invested: $55,720 (down + closing). Projections, not guarantees.
Landlord ↔ Tenant lean methodology
- Overall (STATE)
- 90 Strongly Landlord-Friendly
- State Louisiana
- 90 Strongly Landlord-Friendly · R+12
- County
- — inherits STATE
- City
- — inherits STATE
ZIP-level market 70460
- Rents YoY
- 5.9%
- Active inventory
- 241
- Price-to-rent
- 10.6×
Monthly cashflow live
- Estimated rent
- $1,569 high interval (Pro) →
- Mortgage (P&I)
- −$1,044
- Tax from tax record
- −$158 /mo · $1,895/yr
- Insurance
- −$83
- HOA
- −$0
- Vacancy / Maint / Mgmt
- −$329
- Net cashflow
- $-45
Break-even live
UW: 25.0% down · 7.5% · 30yr · 1.5% tax · 5.0% vac · 8.0% maint · 8.0% mgmt
Financing live
Cash to close
- Down payment
- $49,750
- Closing costs
- $5,970
- Reserves months
- —
- Total cash needed
- —
Loan-product check · same deal, 3 products live
Conventional
25% down · 7.5% · 30yr
- Down + closing
- —
- Monthly P&I
- —
- Monthly cashflow
- —
- DSCR
- —
- Eligible?
- —
Personal DTI + credit; lowest rate.
DSCR
20% down · 8.5% · 30yr
- Down + closing
- —
- Monthly P&I
- —
- Monthly cashflow
- —
- DSCR
- —
- Eligible?
- —
No personal income docs; deal must DSCR.
Hard money
10% down · 12.0% · 12mo
- Down + closing
- —
- Monthly P&I
- —
- Monthly cashflow
- —
- DSCR
- —
- Eligible?
- —
Short-term bridge; refi at stabilization.
Rent comps 5 comps
| Address | Beds | Baths | Sqft | Rent | $/sqft | DOM | Units | Dist |
|---|---|---|---|---|---|---|---|---|
| 1620 Beech St Slidell, LA | 3.0 | 1.0 | 923 | $1,100 | $1.19 | 43d | 1 | 0.48mi |
| 34649 Grantham College Dr Slidell, LA | 2.0 | 1.5 | 1070 | $900 | $0.84 | 3d | 1 | 0.63mi |
| 444 Holmes Dr Slidell, LA | 4.0 | 2.0 | 1594 | $1,800 | $1.13 | 44d | 1 | 0.84mi |
| 35363 Melody Ln Slidell, LA | 3.0 | 2.0 | 1510 | $1,800 | $1.19 | 43d | 1 | 0.98mi |
| 35567 Liberty Dr Slidell, LA | 3.0 | 2.0 | 1232 | $1,650 | $1.34 | 44d | 1 | 1.30mi |
Listing history 31 events
-
2026-06-18days on market $199,000 Active 122 DOM
-
2026-06-17days on market $199,000 Active 121 DOM
-
2026-06-16days on market $199,000 Active 120 DOM
-
2026-06-15days on market $199,000 Active 119 DOM
-
2026-06-13days on market $199,000 Active 117 DOM
-
2026-06-10days on market $199,000 Active 114 DOM
-
2026-06-09days on market $199,000 Active 113 DOM
-
2026-06-08days on market $199,000 Active 112 DOM
-
2026-06-07days on market $199,000 Active 111 DOM
-
2026-06-03days on market $199,000 Active 107 DOM
-
2026-06-02days on market $199,000 Active 106 DOM
-
2026-06-01days on market $199,000 Active 105 DOM
-
2026-05-31days on market $199,000 Active 104 DOM
-
2026-05-11price $199,000 324-char remark
Show marketing remark (324 chars)
Great split floor plan move in ready! Covered front porch, open foyer into living room with cathedral ceilings. Bonus room great for office or a 4th bedroom. Privacy fenced backyard. Nearby restaurants, shopping, and I-10. New Counter Tops, House Freshly Painted, Flood Zone C - 4 year old roof! Schedule your showing today!
-
2026-04-09price $209,000 324-char remark
Show marketing remark (324 chars)
Great split floor plan move in ready! Covered front porch, open foyer into living room with cathedral ceilings. Bonus room great for office or a 4th bedroom. Privacy fenced backyard. Nearby restaurants, shopping, and I-10. New Counter Tops, House Freshly Painted, Flood Zone C - 4 year old roof! Schedule your showing today!
-
2026-03-10price $212,000 324-char remark
Show marketing remark (324 chars)
Great split floor plan move in ready! Covered front porch, open foyer into living room with cathedral ceilings. Bonus room great for office or a 4th bedroom. Privacy fenced backyard. Nearby restaurants, shopping, and I-10. New Counter Tops, House Freshly Painted, Flood Zone C - 4 year old roof! Schedule your showing today!
-
2026-02-16$215,000 Active 324-char remark
Show marketing remark (324 chars)
Great split floor plan move in ready! Covered front porch, open foyer into living room with cathedral ceilings. Bonus room great for office or a 4th bedroom. Privacy fenced backyard. Nearby restaurants, shopping, and I-10. New Counter Tops, House Freshly Painted, Flood Zone C - 4 year old roof! Schedule your showing today!
-
2022-02-15soldstatus $125,000
-
2016-07-12historical
-
2016-01-18$110,000 Active
-
2016-01-11$110,000
-
2015-11-22historical
-
2015-06-22$119,500 Active
-
2015-06-21$119,500
-
2009-02-20soldstatus $110,000
-
2008-07-18$123,780
-
2008-07-18$123,780
ⓘ Source: listings_history table (triggers on properties + properties_extension) + one-shot
backfill from property_details.listing_events for pre-trigger history.
Tax reassessment forecast LA · Resets to sale price
- Current annual tax
- $1,895 · $158/mo
- Projected year-2 tax
- $1,895 · $158/mo
- Expected delta
- $0/yr ($0/mo · 0.0%)
ⓘ Screening estimate from a state-policy table — verify with the county assessor before closing.
Climate risk First Street
- Flood 4/10 Moderate FEMA zone X · 13% chance over 30 yrs
- Wildfire 5/10 Major
- Heat 10/10 Extreme 7 d/yr ≥108°F today · 21 d/yr by 30 yrs out
- Wind 9/10 Extreme 99% chance of damaging wind over 30 yrs
- Air quality 2/10 Low 1 unhealthy d/yr today · 2 by 30 yrs out
Nearby sold comps map
Loading sold comps map…
Walkable amenities ~0.75 mi
Loading nearby amenities…
Taxation est. · year 1
- Rental income
- $18,827
- − Mortgage interest
- −$11,147
- − Property taxes
- −$1,895
- − Insurance
- −$995
- − Repairs & maintenance
- −$1,506
- − Management
- −$1,506
- − Depreciation
- −$5,789
- Taxable loss
- −$4,012
- Est. tax savings @ 24.0%
- +$963
- After-tax cash flow
- $423/yr
For passive investors: Depreciation is non-cash, so a rental often shows a tax loss while cash-flowing — sheltering income. Rental losses are passive: they offset passive income freely, and up to $25,000/yr can offset ordinary (W-2) income if you actively participate and your MAGI is under $100k (phasing out to $0 by $150k); unused losses carry forward. On sale, claimed depreciation is recaptured at up to 25%, and gains may owe capital-gains tax (a 1031 exchange can defer both). Figures are a year-1 estimate at your 24.0% rate — not tax advice; consult a CPA.
Schools (NCES district)
- District
- St. Tammany Parish
- NCES district ID
- 2201650
- Math proficiency
- 43% ▼ -32.00%
- Reading proficiency
- 55% ▼ -26.00%
- Median HH income
- $61,752
- Composite
- 43.04/100
- National rank
- #3098
- State rank
- #11 of 98 in LA
Livability — Slidell
- Score
- 70/100
- State rank
- #57
- US rank
- #7673
Category grades
Schools grade is shown separately in the Schools card above.
Census & demographics
- County
- Saint Tammany Parish · 228,296 people
- City population
- 95,511
- Metro
- New Orleans-Metairie, LA
- Population (ZIP)
- 21,669
- Household income
- $62,565
- Rent vs Own
- Severe rent burden
- 318.0
Population outlook (St. Tammany County) Hauer SSP2
- Today (2025)
- 286,725 people
- By 2030
- 304,175 · +6.1%
- By 2040
- 336,203 · +17.3%
- By 2050
- 364,590 · +27.2%
- By 2075
- 433,362 · +51.1%
- By 2100
- 470,333 · +64.0%
Race, ethnicity, and origin ACS 2023
- Neighborhood character
- Diverse neighborhood (Simpson 0.62)
- Race & ethnicity
- White 53% Black 29% Two or more races 11% Hispanic / Latino 10% Pacific Islander 2%
- Hispanic origin (detail)
- Mexican 3%
- Common ancestry
- Lithuanian 13% Slovak 1% Italian 1%
- Foreign-born
- 5% · Canada
- Languages at home
- 92% English-only · Spanish 6%
Political lean MEDSL · St. Tammany
- 2024 margin
- Solid R (+43.8) · D 27.3% · R 71.1% · Other 1.6%
- 2008→2024 swing
- +9.6pp toward D · 2008: -53.4pp · 2024: -43.8pp
- All cycles
- 2024: R+43.8 2020: R+44.2 2016: R+50.8 2012: R+52.2 2008: R+53.4
Not yet ingested
- Civics
- —
Market trends
- HPI YoY
- ▼ -93.87%
- Current HPI
- 130.56
- Rent YoY
- ▲ 5.91%
- Metro
- New Orleans-Metairie, LA
- State GDP YoY
- ▲ 3.29%
- F500 in state
- 10
Industry mix (Fortune 500 HQ in LA)
| Industry | F500 HQs | Revenue |
|---|---|---|
| Telecommunications | 2 | $23B |
|
||
| Utilities | 1 | $12B |
|
||
| Wholesale / Distribution | 1 | $5B |
|
||
| Advertising | 1 | $2B |
|
||
Price history
+60.8% since first listed18 events — show timeline
- 2026-05-11 Price Changed $199,000 AcadianaMLS
- 2026-05-11 Price Changed $199,000 GSREIN
- 2026-04-09 Price Changed $209,000 AcadianaMLS
- 2026-04-09 Price Changed $209,000 GSREIN
- 2026-03-10 Price Changed $212,000 AcadianaMLS
- 2026-03-10 Price Changed $212,000 GSREIN
- 2026-02-16 Listed $215,000 GSREIN
- 2026-02-16 Listed $215,000 AcadianaMLS
- 2022-02-15 Sold (Public Records) $125,000 Public Records
- 2016-07-12 Listing Removed — GSREIN
- 2016-01-18 Listed $110,000 GSREIN
- 2016-01-11 Listed $110,000 AcadianaMLS
- 2015-11-22 Listing Removed — GSREIN
- 2015-06-22 Listed $119,500 GSREIN
- 2015-06-21 Listed $119,500 AcadianaMLS
- 2009-02-20 Sold (Public Records) $110,000 Public Records
- 2008-07-18 Listed $123,780 GSREIN
- 2008-07-18 Listed $123,780 AcadianaMLS
Property tax history
-0.1%/yrLatest (2025): $1,895 · -3.9% YoY. Source: county tax records.
Cash-flow waterfall
monthlySold comps — $/sqft
last 12 mo · ≤1 miLoading sold comps…