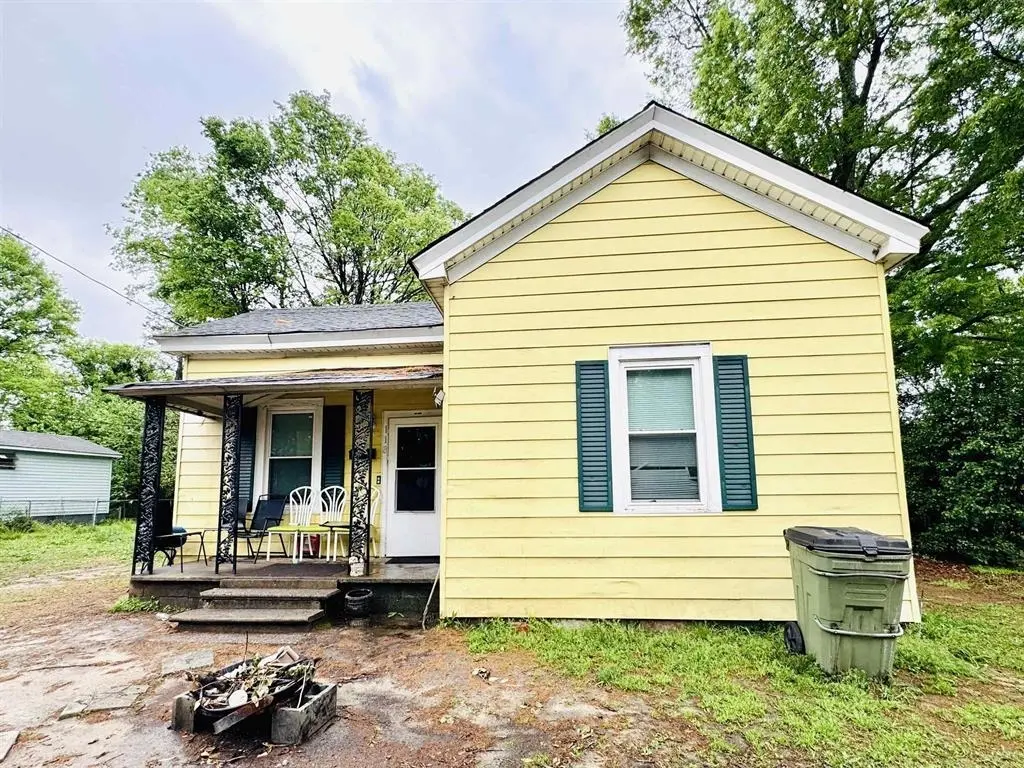
118 Cherry St · Gaffney, SC
Flood risk 1/10 · Minimal
- FEMA flood zone
- X (unshaded)
- Chance of flooding over 30 yrs
- 0.0%
- Est. flood insurance / yr
- $507 – $1,088
Fire risk 2/10 · Minimal
- Est. fire insurance / yr
- $783 – $1,453
Heat risk 6/10 · Moderate
- Hot days now (above 103°F)
- 7 days/yr
- Hot days in 30 yrs
- 16 days/yr
Wind risk 3/10 · Minor
- Chance of severe wind over 30 yrs
- 4.0%
Air-quality risk 3/10 · Minor
- Unhealthy air days now
- 3 days/yr
- Unhealthy air days in 30 yrs
- 4 days/yr
Risk factors via First Street. Map © Google.
Why this score? — see what drove the B- grade
The composite is a weighted blend of 9 inputs, each scored 0–100. Each bar is that input's sub-score; the figure is the points it added to the 100-point composite (weight × sub-score).
- Cash flow +30.0/30.0
- 1% rule +10.0/10.0
- DSCR +10.0/10.0
- ARV discount +7.5/15.0
- Livability +3.3/5.0
- Schools +2.8/10.0
- Rent growth +2.5/5.0
- Condition / age +2.5/5.0
- Appreciation +0.0/10.0
$59,900
🖨 Deal sheet 📄 Offer letter ✓ Due diligence
Listing remarks MLS
This charming investor opportunity in Gaffney has great potential for those looking to renovate or expand their portfolio. Being sold as-is, this home is perfect for investors or buyers with a vision to bring new life to a property full of character. With solid bones and plenty of upside, it presents an excellent chance to customize and add value. Conveniently located near local amenities, shopping, and major roadways, this property combines small-town appeal with strong investment potential. Don't miss this affordable opportunity to create something special!
Key facts
- 8,712 sq ft lot
- Listed 7 days
Neighborhood map
What this means for you Summary
Snapshot
- This is a 2-bed/1.0-bath single-family listed at $60k.
Deal economics
- At list price, monthly cash flow is $402 ($5k/yr) — positive.
- The deal already cash-flows at list — no discount required.
- Meets the 1% rule at list price ($1k rent vs $60k).
- Cap rate 14.3% vs local median 2.6% in Gaffney — top-decile yield for the area; either an underpriced asset or a hidden risk that comps aren't pricing in. Stress-test before assuming the spread holds.
Location & tenants
- Location reads 66/100 on livability (#112 in SC) — a middle-class / working-renter tenant base. Strengths: cost of living A+, health & safety A+, housing A-; Watch: amenities D+, crime D, commute F.
- Cherokee 01 (rural): math 29% / reading 40% proficiency, ranked #47 of 80 in SC (top 59%) — families likely to look elsewhere, expect single-tenant / working-renter base with shorter leases; 64% free/reduced lunch — lower-income household profile, screen leases tightly.
- Zoned schools: John E. Ewing Middle (math 18% / reading 30%, grade F, #167 of 229 statewide, top 74%, 486 students, 100% FRL); Gaffney High (math 40% / reading 75%, grade C, #116 of 196 statewide, top 59%, 1,838 students, 84% FRL) — zoned schools average 92% FRL vs 64% district-wide (28 pts higher); higher-poverty schools than district average — tighter screening recommended.
- Market conditions: 158 active listings in the ZIP; 2 comparable units currently listed for rent nearby; lower-income renter base — watch delinquency; 200 units permitted in Cherokee County in 2024 (0 in 5+ unit buildings).
Forward outlook
- Local home prices are declining (-3.0%/yr); year-one equity from $414 of loan paydown is wiped out by about $2k of value loss. Plan a longer hold.
- At projected returns (-3.0% appreciation + 3.0% rent growth), your $17k cash investment doubles in ~5 years — after that, you're playing with house money.
Negotiation context
- Only 7 days on market — expect competitive offers; lowballing is unlikely to land.
- 4 sale attempts with the ask held roughly flat each time — persistent listings suggest the price (not the market) is what's stuck; bring a comps-based counter.
Risks & watch-outs
- Climate carrying-cost: extreme-heat days projected 7→16/yr by 2055 (HVAC capex compounding) — expect insurance premiums to compound above CPI over the hold.
Questions for the listing agent
- Is there a deadline driving the sale (1031 exchange, divorce, estate, relocation)? That informs how much negotiation room exists.
- Schools are D-rated, which usually means shorter tenancies and higher turnover. Who's the typical renter profile here, and what's been the actual vacancy rate?
- Crime grade is D in this area — have there been break-ins, vandalism, or insurance claims at this property in the last 3 years? What carrier currently insures it and at what premium?
- What's the average days-on-market for RENTAL listings here right now (not sales)? A rising rental-DOM trend means longer vacancies and softer asking-rent achievability than the comps imply.
- What's the recent tenant-quality profile in this submarket — average credit score on applications, eviction rate, late-payment / NSF rate, and stable-employment percentage? A property-management company in the area should have these aggregated.
- How much new for-sale + rental construction is in the pipeline within 1–3 miles? Heavy new supply typically softens prices + rents 12–24 months out; constrained supply supports both.
Investment metrics
- 1% rule
- 1.74% ✓
- Cap rate
- 14.34%
- Cash-on-cash
- 28.75%
- DSCR
- 2.28
- GRM
- 4.8
CMA / ARV
- ARV (on-the-fly)
- $138,020
- Comps found
- 12
Show comp detail 12 sales within ~0.75 mi
| Address | Dist | Beds/Ba | Sqft | Sold | Price | $/sf | Match |
|---|---|---|---|---|---|---|---|
| 118 Cherry St | 0.00mi | 2/1.0 | 1,030 (0%) | 1mo | $58,400 | $57 | 99 |
| 502 Beech St | 0.11mi | 2/1.0 | 1,010 (-2%) | 1mo | $126,900 | $126 | 91 |
| 407 Willow St | 0.18mi | 2/1.0 | 965 (-6%) | 1mo | $37,000 | $38 | 80 |
| 502 Oakland Ave | 0.10mi | 3/1.0 (+1) | 1,088 (+6%) | 5mo | $35,000 | $32 | 77 |
| 99 Walnut St | 0.17mi | 3/2.0 (+1) | 1,100 (+7%) | 1mo | $199,900 | $182 | 71 |
| 504 Railroad Ave Ave | 0.31mi | 2/1.0 | 1,110 (+8%) | 3mo | $75,000 | $68 | 70 |
| 330 W Birnie St | 0.51mi | 2/2.0 | 1,014 (-2%) | 1mo | $170,000 | $168 | 69 |
| 205 E Third St | 0.42mi | 3/2.0 (+1) | 1,005 (-2%) | 3mo | $158,000 | $157 | 65 |
| 320 Providence Rd | 0.60mi | 2/1.0 | 984 (-4%) | 3mo | $199,900 | $203 | 62 |
| 421 Colonial Ave Ave | 0.61mi | 3/1.0 (+1) | 988 (-4%) | 2mo | $135,000 | $137 | 58 |
| 412 E Montgomery St | 0.63mi | 2/1.0 | 960 (-7%) | 4mo | $90,000 | $94 | 56 |
| 408 Hardin Dr | 0.48mi | 3/1.0 (+1) | 1,161 (+13%) | 4mo | $155,000 | $134 | 48 |
Match score weights: distance 35% · size 25% · config 20% · recency 20%. Top-matched comps best support the ARV.
Projected returns pro-forma
-3.0% appreciation · 3.0% rent growth · sell at horizon
- IRR
- 23.1%
- Equity multiple
- 1.95×
- Total profit
- $15,905
- Equity at exit
- $8,931
- IRR
- 31.0%
- Equity multiple
- 3.80×
- Total profit
- $46,881
- Equity at exit
- $5,179
Cash invested: $16,772 (down + closing). Projections, not guarantees.
Landlord ↔ Tenant lean methodology
- Overall (STATE)
- 90 Strongly Landlord-Friendly
- State South Carolina
- 90 Strongly Landlord-Friendly · R+6
- County
- — inherits STATE
- City
- — inherits STATE
ZIP-level market 29340
- Home prices YoY
- -29.7%
- Active inventory
- 158
- Price-to-rent
- 4.8×
Monthly cashflow live
- Estimated rent
- $1,040 medium interval (Pro) →
- Mortgage (P&I)
- −$314
- Tax from tax record
- −$81 /mo · $966/yr
- Insurance
- −$25
- HOA
- −$0
- Vacancy / Maint / Mgmt
- −$218
- Net cashflow
- $402
Break-even live
UW: 25.0% down · 7.5% · 30yr · 1.5% tax · 5.0% vac · 8.0% maint · 8.0% mgmt
Financing live
Cash to close
- Down payment
- $14,975
- Closing costs
- $1,797
- Reserves months
- —
- Total cash needed
- —
Loan-product check · same deal, 3 products live
Conventional
25% down · 7.5% · 30yr
- Down + closing
- —
- Monthly P&I
- —
- Monthly cashflow
- —
- DSCR
- —
- Eligible?
- —
Personal DTI + credit; lowest rate.
DSCR
20% down · 8.5% · 30yr
- Down + closing
- —
- Monthly P&I
- —
- Monthly cashflow
- —
- DSCR
- —
- Eligible?
- —
No personal income docs; deal must DSCR.
Hard money
10% down · 12.0% · 12mo
- Down + closing
- —
- Monthly P&I
- —
- Monthly cashflow
- —
- DSCR
- —
- Eligible?
- —
Short-term bridge; refi at stabilization.
Rent comps 2 comps
| Address | Beds | Baths | Sqft | Rent | $/sqft | DOM | Units | Dist |
|---|---|---|---|---|---|---|---|---|
| 506 S Oliver St Gaffney, SC | 1.0–2.0 | 1.0 | 900 | $955 | $1.06 | 16d | 5 | 0.92mi |
| 266 Goldmine Springs Rd Gaffney, SC | 2.0 | 1.0 | 730 | $1,099 | $1.51 | 23d | 1 | 1.05mi |
Listing history 10 events
-
2026-04-02historical Active Under Contract 565-char remark
Show marketing remark (565 chars)
This charming investor opportunity in Gaffney has great potential for those looking to renovate or expand their portfolio. Being sold as-is, this home is perfect for investors or buyers with a vision to bring new life to a property full of character. With solid bones and plenty of upside, it presents an excellent chance to customize and add value. Conveniently located near local amenities, shopping, and major roadways, this property combines small-town appeal with strong investment potential. Don't miss this affordable opportunity to create something special!
-
2026-04-02status Pending
Show marketing remark (565 chars)
This charming investor opportunity in Gaffney has great potential for those looking to renovate or expand their portfolio. Being sold as-is, this home is perfect for investors or buyers with a vision to bring new life to a property full of character. With solid bones and plenty of upside, it presents an excellent chance to customize and add value. Conveniently located near local amenities, shopping, and major roadways, this property combines small-town appeal with strong investment potential. Don't miss this affordable opportunity to create something special!
-
2026-03-26$59,900 Active 565-char remark
Show marketing remark (565 chars)
This charming investor opportunity in Gaffney has great potential for those looking to renovate or expand their portfolio. Being sold as-is, this home is perfect for investors or buyers with a vision to bring new life to a property full of character. With solid bones and plenty of upside, it presents an excellent chance to customize and add value. Conveniently located near local amenities, shopping, and major roadways, this property combines small-town appeal with strong investment potential. Don't miss this affordable opportunity to create something special!
-
2026-03-26$59,900 Active
Show marketing remark (565 chars)
This charming investor opportunity in Gaffney has great potential for those looking to renovate or expand their portfolio. Being sold as-is, this home is perfect for investors or buyers with a vision to bring new life to a property full of character. With solid bones and plenty of upside, it presents an excellent chance to customize and add value. Conveniently located near local amenities, shopping, and major roadways, this property combines small-town appeal with strong investment potential. Don't miss this affordable opportunity to create something special!
-
2025-07-16price $87,900
-
2025-07-16price $87,900
-
2025-04-30price $89,900
-
2025-04-30price $89,900
-
2025-04-07$92,500 Active
-
2025-04-07$92,500 Active
ⓘ Source: listings_history table (triggers on properties + properties_extension) + one-shot
backfill from property_details.listing_events for pre-trigger history.
Tax reassessment forecast SC · Resets to sale price
- Current annual tax
- $966 · $81/mo
- Projected year-2 tax
- $966 · $81/mo
- Expected delta
- $0/yr ($0/mo · 0.0%)
ⓘ Screening estimate from a state-policy table — verify with the county assessor before closing.
Climate risk First Street
- Flood 1/10 Low FEMA zone X (unshaded) · 0% chance over 30 yrs
- Wildfire 2/10 Low
- Heat 6/10 Major 7 d/yr ≥103°F today · 16 d/yr by 30 yrs out
- Wind 3/10 Moderate 4% chance of damaging wind over 30 yrs
- Air quality 3/10 Moderate 3 unhealthy d/yr today · 4 by 30 yrs out
Nearby sold comps map
Loading sold comps map…
Walkable amenities ~0.75 mi
Loading nearby amenities…
Taxation est. · year 1
- Rental income
- $12,477
- − Mortgage interest
- −$3,355
- − Property taxes
- −$966
- − Insurance
- −$300
- − Repairs & maintenance
- −$998
- − Management
- −$998
- − Depreciation
- −$1,743
- Taxable income
- $4,117
- Est. tax owed @ 24.0%
- −$988
- After-tax cash flow
- $3,834/yr
For passive investors: Depreciation is non-cash, so a rental often shows a tax loss while cash-flowing — sheltering income. Rental losses are passive: they offset passive income freely, and up to $25,000/yr can offset ordinary (W-2) income if you actively participate and your MAGI is under $100k (phasing out to $0 by $150k); unused losses carry forward. On sale, claimed depreciation is recaptured at up to 25%, and gains may owe capital-gains tax (a 1031 exchange can defer both). Figures are a year-1 estimate at your 24.0% rate — not tax advice; consult a CPA.
Schools (NCES district)
- District
- Cherokee 01
- NCES district ID
- 4501500
- Math proficiency
- 29% ▼ -9.00%
- Reading proficiency
- 40% ▼ -2.00%
- Median HH income
- $34,262
- Composite
- 28.39/100
- National rank
- #6768
- State rank
- #47 of 80 in SC
Livability — Gaffney
- Score
- 66/100
- State rank
- #112
- US rank
- #11549
Category grades
Schools grade is shown separately in the Schools card above.
Census & demographics
- Census place
- Gaffney, SC
- County
- Cherokee County · 41,410 people
- City population
- 41,410
- Metro
- Gaffney, SC
- Population (ZIP)
- 20,763
- Household income
- $44,123
- Rent vs Own
- Severe rent burden
- 257.0
Population outlook (Cherokee County) Hauer SSP2
- Today (2025)
- 58,602 people
- By 2030
- 59,336 · +1.3%
- By 2040
- 60,266 · +2.8%
- By 2050
- 60,314 · +2.9%
- By 2075
- 59,276 · +1.2%
- By 2100
- 53,788 · -8.2%
Race, ethnicity, and origin ACS 2023
- Neighborhood character
- Predominantly White (71%)
- Race & ethnicity
- White 71% Black 22% Two or more races 4% Hispanic / Latino 2%
- Common ancestry
- Slovak 2% Serbian 2% Italian 2%
- Foreign-born
- 2% · Canada, China
- Languages at home
- 97% English-only · Spanish 2%
Political lean MEDSL · Cherokee
- 2024 margin
- Solid R (+51.4) · D 23.9% · R 75.3%
- 2008→2024 swing
- -22.0pp toward R · 2008: -29.3pp · 2024: -51.4pp
- All cycles
- 2024: R+51.4 2020: R+43.8 2016: R+41.7 2012: R+29.3 2008: R+29.3
Not yet ingested
- Civics
- —
Market trends
- HPI YoY
- ▼ -85.24%
- Current HPI
- 201.4272
- Rent YoY
- —
- Metro
- Gaffney, SC
- State GDP YoY
- ▲ 4.51%
- F500 in state
- 2
Industry mix (Fortune 500 HQ in SC)
| Industry | F500 HQs | Revenue |
|---|---|---|
| Packaging | 1 | $7B |
|
||
Price history
-35.2% since first listed10 events — show timeline
- 2026-04-02 Contingent — CCMLS
- 2026-04-02 Pending — SPMLS
- 2026-03-26 Listed $59,900 SPMLS
- 2026-03-26 Listed $59,900 CCMLS
- 2025-07-16 Price Changed $87,900 CCMLS
- 2025-07-16 Price Changed $87,900 SPMLS
- 2025-04-30 Price Changed $89,900 SPMLS
- 2025-04-30 Price Changed $89,900 CCMLS
- 2025-04-07 Listed $92,500 SPMLS
- 2025-04-07 Listed $92,500 CCMLS
Property tax history
+4.1%/yrLatest (2025): $966 · +4.2% YoY. Source: county tax records.
Cash-flow waterfall
monthlySold comps — $/sqft
last 12 mo · ≤1 miLoading sold comps…