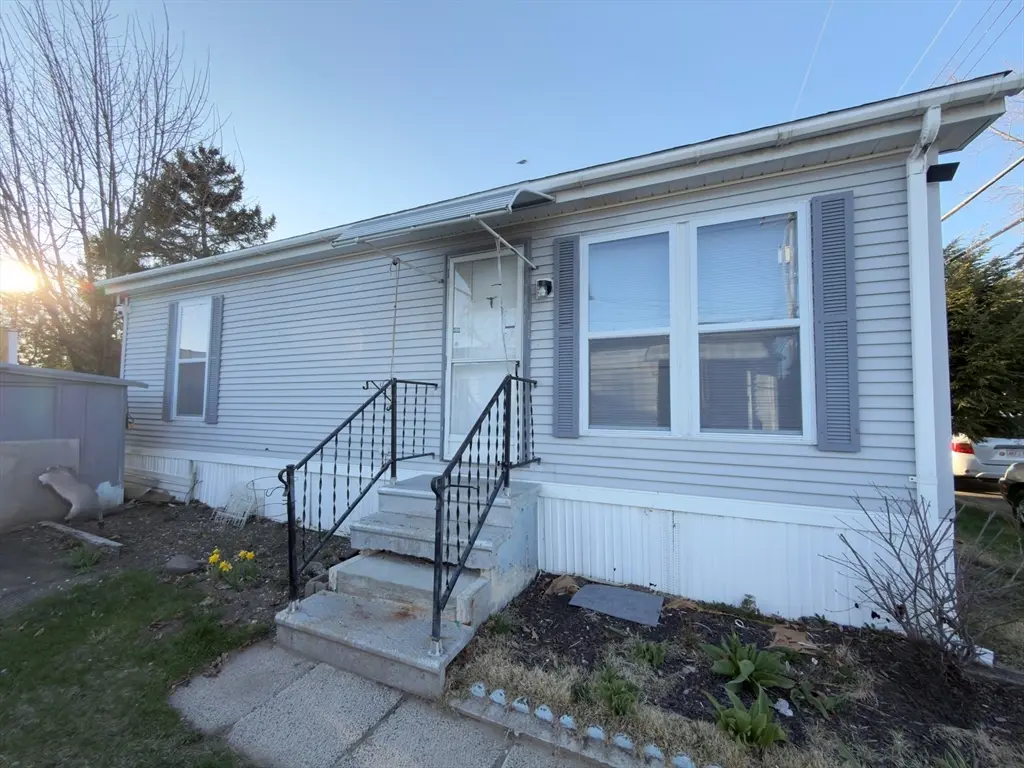
16 Mobile Home Way · Springfield, MA
Flood risk No data
- FEMA flood zone
- —
- Chance of flooding over 30 yrs
- —
- Est. flood insurance / yr
- —
Fire risk No data
- Est. fire insurance / yr
- —
Heat risk No data
- Hot days now (above threshold)
- —
- Hot days in 30 yrs
- —
Wind risk No data
- Chance of severe wind over 30 yrs
- —
Air-quality risk No data
- Unhealthy air days now
- —
- Unhealthy air days in 30 yrs
- —
Risk factors via First Street. Map © Google.
Why this score? — see what drove the B grade
The composite is a weighted blend of 9 inputs, each scored 0–100. Each bar is that input's sub-score; the figure is the points it added to the 100-point composite (weight × sub-score).
- Cash flow +30.0/30.0
- ARV discount +13.4/15.0
- 1% rule +10.0/10.0
- DSCR +10.0/10.0
- Condition / age +3.8/5.0
- Livability +3.7/5.0
- Rent growth +2.5/5.0
- Schools +1.6/10.0
- Appreciation +0.0/10.0
$125,000
🖨 Deal sheet 📄 Offer letter ✓ Due diligence
Listing remarks MLS
Welcome to 16 Mobile Home Way! This beautifully maintained Stafford manufactured home, built in 1990, offers a perfect blend of comfort and modern updates. Step inside to find updated flooring and windows throughout and a freshly painted interior that gives the home a clean, move-in-ready feel. The kitchen features brand new stainless steel appliances, ideal for both everyday living and entertaining. Enjoy a spacious layout filled with natural sunlight, complemented by high ceilings that create an open and airy atmosphere.
Key facts
- Updated flooring
- High ceilings
- Spacious layout
Tags
Neighborhood map
What this means for you Summary
Snapshot
- This is a 2-bed/1.0-bath manufactured listed at $125k. Condition is rated good.
Deal economics
- At list price, monthly cash flow is $687 ($8k/yr) — positive.
- The deal already cash-flows at list — no discount required.
- Meets the 1% rule at list price ($2k rent vs $125k).
- Recommended offer: $121k (3.0% below list) — sets the bar for market timing.
- Cap rate 12.9% vs local median 5.1% in Springfield — top-decile yield for the area; either an underpriced asset or a hidden risk that comps aren't pricing in. Stress-test before assuming the spread holds.
Location & tenants
- Location reads 73/100 on livability (#97 in MA) — a middle-class / working-renter tenant base. Strengths: commute A+, health & safety A+, amenities A; Watch: schools D, crime F, employment D-.
- Springfield (urban): math 13% / reading 25% proficiency, ranked #296 of 302 in MA (top 98%) — low school quality limits family demand, transient renter base, plan for 1-2y turnover; 81% free/reduced lunch — lower-income household profile, screen leases tightly.
- Market conditions: 16 active listings in the ZIP; 3 comparable units currently listed for rent nearby; rentals leasing fast (median 14d on market — plan ~1-2 weeks tenant-placement turnaround); 453 units permitted in Hampden County in 2024 (116 in 5+ unit buildings).
Forward outlook
- Local home prices are declining (-3.0%/yr); year-one equity from $864 of loan paydown is wiped out by about $4k of value loss. Plan a longer hold.
- Hampden County population projected at +5% by 2050 — modest demand growth; plan on rents tracking national, not racing it.
- At projected returns (-3.0% appreciation + 3.0% rent growth), your $35k cash investment doubles in ~6 years — after that, you're playing with house money.
Negotiation context
- It's been on market 59 days — a 3% lower offer ($121k) is reasonable based on typical stale-listing flexibility.
Questions for the listing agent
- It's been on market 59 days. Have you received any prior offers? Is the seller open to a 3% concession, seller financing, or rate buy-down credit?
- What does the HOA fee cover, when was the last increase, and are there any pending special assessments or reserve-fund shortfalls?
- Is there a deadline driving the sale (1031 exchange, divorce, estate, relocation)? That informs how much negotiation room exists.
- Schools are D-rated, which usually means shorter tenancies and higher turnover. Who's the typical renter profile here, and what's been the actual vacancy rate?
- Crime grade is F in this area — have there been break-ins, vandalism, or insurance claims at this property in the last 3 years? What carrier currently insures it and at what premium?
- What's the average days-on-market for RENTAL listings here right now (not sales)? A rising rental-DOM trend means longer vacancies and softer asking-rent achievability than the comps imply.
- What's the recent tenant-quality profile in this submarket — average credit score on applications, eviction rate, late-payment / NSF rate, and stable-employment percentage? A property-management company in the area should have these aggregated.
- How much new for-sale + rental construction is in the pipeline within 1–3 miles? Heavy new supply typically softens prices + rents 12–24 months out; constrained supply supports both.
Investment metrics
- 1% rule
- 1.92% ✓
- Cap rate
- 12.89%
- Cash-on-cash
- 23.55%
- DSCR
- 2.05
- GRM
- 4.3
CMA / ARV
- ARV (median comp)
- $143,804
- List price
- $125,000
- Delta
- -13.08%
- Verdict
- UNDERPRICED
- Comps
- 2 within 1.0 mi
Projected returns pro-forma
-3.0% appreciation · 3.0% rent growth · sell at horizon
- IRR
- 16.8%
- Equity multiple
- 1.68×
- Total profit
- $23,742
- Equity at exit
- $18,638
- IRR
- 25.4%
- Equity multiple
- 3.23×
- Total profit
- $78,017
- Equity at exit
- $10,808
Cash invested: $35,000 (down + closing). Projections, not guarantees.
Landlord ↔ Tenant lean methodology
- Overall (STATE)
- 20 Strongly Tenant-Friendly
- State Massachusetts
- 20 Strongly Tenant-Friendly · D+15
- County
- — inherits STATE
- City
- — inherits STATE
ZIP-level market 01119
- Home prices YoY
- -30.7%
- Active inventory
- 16
- Price-to-rent
- 4.3×
Monthly cashflow live
- Estimated rent
- $2,400 medium interval (Pro) →
- Mortgage (P&I)
- −$656
- Tax est. 1.5%
- −$156 /mo · $1,875/yr
- Insurance
- −$52
- HOA
- −$345
- Vacancy / Maint / Mgmt
- −$504
- Net cashflow
- $687
Break-even live
UW: 25.0% down · 7.5% · 30yr · 1.5% tax · 5.0% vac · 8.0% maint · 8.0% mgmt
Financing live
Cash to close
- Down payment
- $31,250
- Closing costs
- $3,750
- Reserves months
- —
- Total cash needed
- —
Loan-product check · same deal, 3 products live
Conventional
25% down · 7.5% · 30yr
- Down + closing
- —
- Monthly P&I
- —
- Monthly cashflow
- —
- DSCR
- —
- Eligible?
- —
Personal DTI + credit; lowest rate.
DSCR
20% down · 8.5% · 30yr
- Down + closing
- —
- Monthly P&I
- —
- Monthly cashflow
- —
- DSCR
- —
- Eligible?
- —
No personal income docs; deal must DSCR.
Hard money
10% down · 12.0% · 12mo
- Down + closing
- —
- Monthly P&I
- —
- Monthly cashflow
- —
- DSCR
- —
- Eligible?
- —
Short-term bridge; refi at stabilization.
Rent comps 3 comps
| Address | Beds | Baths | Sqft | Rent | $/sqft | DOM | Units | Dist |
|---|---|---|---|---|---|---|---|---|
| 1142 Boston Rd Unit 1142 Springfield, MA | 3.0 | 1.5 | 2150 | $2,475 | $1.15 | 13d | 1 | 0.13mi |
| 19-21 Daniel St Unit 19 Springfield, MA | 3.0 | 1.0 | 1050 | $2,000 | $1.90 | 43d | 1 | 1.10mi |
| 35 Healey St Unit 3rd Floor Indian Orchard, MA | 3.0 | 1.0 | 1200 | $2,000 | $1.67 | 13d | 1 | 1.38mi |
HOA detail
- Monthly dues
- $345 · $4,140/yr
Listing history 18 events
-
2026-06-18days on market $125,000 Active 59 DOM
-
2026-06-17days on market $125,000 Active 58 DOM
-
2026-06-16days on market $125,000 Active 57 DOM
-
2026-06-15days on market $125,000 Active 56 DOM
-
2026-06-14days on market $125,000 Active 54 DOM
-
2026-06-13days on market $125,000 Active 53 DOM
-
2026-06-10days on market $125,000 Active 51 DOM
-
2026-06-09days on market $125,000 Active 50 DOM
-
2026-06-08days on market $125,000 Active 49 DOM
-
2026-06-07days on market $125,000 Active 48 DOM
-
2026-06-05days on market $125,000 Active 45 DOM
-
2026-06-03days on market $125,000 Active 44 DOM
-
2026-06-02days on market $125,000 Active 43 DOM
-
2026-06-01days on market $125,000 Active 42 DOM
-
2026-05-31days on market $125,000 Active 41 DOM
-
2026-05-30days on market $125,000 Active 40 DOM
-
2026-05-15status Under Agreement 528-char remark
Show marketing remark (528 chars)
Welcome to 16 Mobile Home Way! This beautifully maintained Stafford manufactured home, built in 1990, offers a perfect blend of comfort and modern updates. Step inside to find updated flooring and windows throughout and a freshly painted interior that gives the home a clean, move-in-ready feel. The kitchen features brand new stainless steel appliances, ideal for both everyday living and entertaining. Enjoy a spacious layout filled with natural sunlight, complemented by high ceilings that create an open and airy atmosphere.
-
2026-04-14$125,000 New 528-char remark
Show marketing remark (528 chars)
Welcome to 16 Mobile Home Way! This beautifully maintained Stafford manufactured home, built in 1990, offers a perfect blend of comfort and modern updates. Step inside to find updated flooring and windows throughout and a freshly painted interior that gives the home a clean, move-in-ready feel. The kitchen features brand new stainless steel appliances, ideal for both everyday living and entertaining. Enjoy a spacious layout filled with natural sunlight, complemented by high ceilings that create an open and airy atmosphere.
ⓘ Source: listings_history table (triggers on properties + properties_extension) + one-shot
backfill from property_details.listing_events for pre-trigger history.
Nearby sold comps map
Loading sold comps map…
Walkable amenities ~0.75 mi
Loading nearby amenities…
Taxation est. · year 1
- Rental income
- $28,796
- − Mortgage interest
- −$7,002
- − Property taxes
- −$1,875
- − Insurance
- −$625
- − Repairs & maintenance
- −$2,304
- − Management
- −$2,304
- − HOA
- −$4,140
- − Depreciation
- −$3,636
- Taxable income
- $6,911
- Est. tax owed @ 24.0%
- −$1,659
- After-tax cash flow
- $6,584/yr
For passive investors: Depreciation is non-cash, so a rental often shows a tax loss while cash-flowing — sheltering income. Rental losses are passive: they offset passive income freely, and up to $25,000/yr can offset ordinary (W-2) income if you actively participate and your MAGI is under $100k (phasing out to $0 by $150k); unused losses carry forward. On sale, claimed depreciation is recaptured at up to 25%, and gains may owe capital-gains tax (a 1031 exchange can defer both). Figures are a year-1 estimate at your 24.0% rate — not tax advice; consult a CPA.
Condition & rehab AI · 11 photos
This Stafford manufactured home, built in 1990, offers a blend of comfort and modern updates. Freshly painted and updated throughout, it's move-in ready with a spacious layout and natural sunlight.
Value-add opportunities
- Both Paint exterior — Enhances curb appeal and value
- Both Replace window seals — Improves energy efficiency and appearance
Renovation cost estimate screening
Value-add ROI direction
- Both Paint exterior — Enhances curb appeal and value ↑
- Both Replace window seals — Improves energy efficiency and appearance ↑
ⓘ Cost ranges are severity-bucket heuristics (US national rule-of-thumb). Get contractor quotes + a written scope before underwriting a rehab budget.
Schools (NCES district)
- District
- Springfield
- NCES district ID
- 2511130
- Math proficiency
- 13% ▼ -12.00%
- Reading proficiency
- 25% ▼ -5.00%
- Median HH income
- $34,938
- Composite
- 15.6/100
- National rank
- #9293
- State rank
- #296 of 302 in MA
Livability — Springfield
- Score
- 73/100
- State rank
- #97
- US rank
- #5195
Category grades
Schools grade is shown separately in the Schools card above.
Census & demographics
- Census place
- Springfield, MA
- City population
- 61,006
- Population (ZIP)
- 14,059
Population outlook (Hampden County) Hauer SSP2
- Today (2025)
- 485,646 people
- By 2030
- 491,517 · +1.2%
- By 2040
- 500,539 · +3.1%
- By 2050
- 508,827 · +4.8%
- By 2075
- 539,167 · +11.0%
- By 2100
- 545,698 · +12.4%
Race, ethnicity, and origin ACS 2023
- Neighborhood character
- Diverse neighborhood (Simpson 0.68)
- Race & ethnicity
- White 41% Hispanic / Latino 33% Black 20% Two or more races 14% Asian 4%
- Hispanic origin (detail)
- Puerto Rican 29% Dominican 2%
- Common ancestry
- Lithuanian 8% Romanian 4% Russian 1%
- Foreign-born
- 7% · Canada
- Languages at home
- 72% English-only · Spanish 24% Other Indo-European 1% Vietnamese 1%
Political lean MEDSL · Hampden
- 2024 margin
- Lean D (+8.9) · D 53.4% · R 44.5% · Other 2.1%
- 2008→2024 swing
- -16.4pp toward R · 2008: 25.3pp · 2024: 8.9pp
- All cycles
- 2024: D+8.9 2020: D+17.7 2016: D+16.0 2012: D+25.4 2008: D+25.3
Not yet ingested
- Civics
- —
Market trends
- HPI YoY
- ▼ -154.94%
- Current HPI
- 349.652
- Rent YoY
- —
- Metro
- —
- State GDP YoY
- ▲ 2.28%
- F500 in state
- 38
Industry mix (Fortune 500 HQ in MA)
| Industry | F500 HQs | Revenue |
|---|---|---|
| Technology | 3 | $17B |
|
||
| Insurance | 2 | $84B |
|
||
| Retail | 2 | $76B |
|
||
| Life Sciences | 1 | $43B |
|
||
| Energy Technology | 1 | $31B |
|
||
| Aerospace / Defense | 1 | $18B |
|
||
Price history
2 events — show timeline
- 2026-05-15 Pending — MLS PIN
- 2026-04-14 Listed $125,000 MLS PIN
Cash-flow waterfall
monthlySold comps — $/sqft
last 12 mo · ≤1 miLoading sold comps…