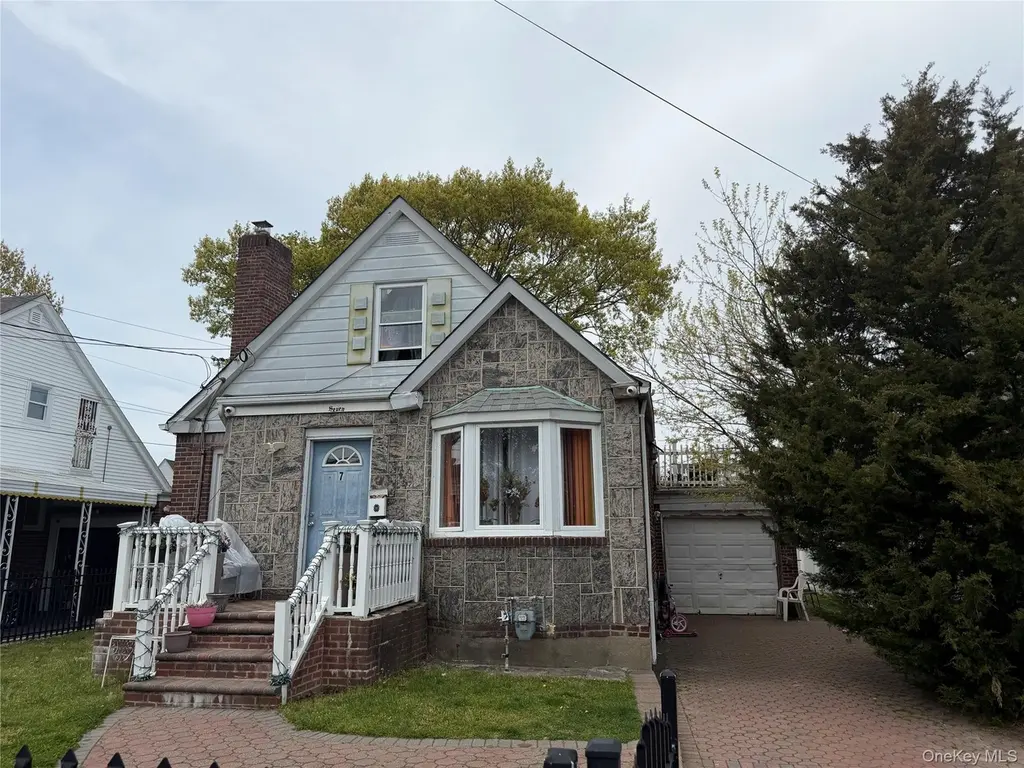
7 Dale Ave · Hempstead, NY
Flood risk 1/10 · Minimal
- FEMA flood zone
- X (unshaded)
- Chance of flooding over 30 yrs
- 0.0%
- Est. flood insurance / yr
- $473 – $860
Fire risk 1/10 · Minimal
- Est. fire insurance / yr
- $691 – $1,283
Heat risk 6/10 · Moderate
- Hot days now (above 96°F)
- 7 days/yr
- Hot days in 30 yrs
- 16 days/yr
Wind risk 6/10 · Moderate
- Chance of severe wind over 30 yrs
- 57.0%
Air-quality risk 4/10 · Minor
- Unhealthy air days now
- 5 days/yr
- Unhealthy air days in 30 yrs
- 8 days/yr
Risk factors via First Street. Map © Google.
Why this score? — see what drove the B grade
The composite is a weighted blend of 9 inputs, each scored 0–100. Each bar is that input's sub-score; the figure is the points it added to the 100-point composite (weight × sub-score).
- Cash flow +30.0/30.0
- 1% rule +10.0/10.0
- DSCR +10.0/10.0
- ARV discount +7.5/15.0
- Schools +5.8/10.0
- Livability +4.0/5.0
- Rent growth +2.5/5.0
- Condition / age +2.5/5.0
- Appreciation +0.0/10.0
$305,000
🖨 Deal sheet 📄 Offer letter ✓ Due diligence
Listing remarks
CASH ONLY ! ! ! --- Charming Cape style single family home, offering approximately 1500 square feet of living space on a 5000 square foot lot in a Central Hempstead location. Built-in 1941, this property features 4 bedrooms and 2 full bathrooms with a functional layout that includes a formal dining room, eat in kitchen and additional den family room space. The home includes a full finished basement. Interior highlights include a fireplace, attic space and forced air heating. Exterior features include private driveway, attached one car garage and a porch/deck area on a standard 50x100 lot!
Key facts
- Formal dining room
- Eat in kitchen
- Finished basement
Tags
Property features AI
Finance
- Other:
- Financial info:
- HOA & community:
Exterior
- Parking: Driveway; Garage (1 space)
- Security:
- Utilities: Public sewer; Electricity connected
- Home design: Single family residence
- Construction:
- Exterior features: Frame construction; Not waterfront
Interior
- Kitchen: Other appliances
- Bedrooms:
- Flooring:
- Bathrooms: 2 full bathrooms
- Heating & cooling: Forced air heating; Oil heating; Central air conditioning; Fireplace (1)
- Interior features: Finished basement; Unfinished attic; 7 total rooms; Other interior features
- Laundry & utility:
Neighborhood map
What this means for you Summary
Snapshot
- This is a 4-bed/2.0-bath single-family listed at $305k.
Deal economics
- At list price, monthly cash flow is $1k ($16k/yr) — positive.
- The deal already cash-flows at list — no discount required.
- Meets the 1% rule at list price ($5k rent vs $305k).
- Cap rate 11.6% vs local median 5.1% in Hempstead — top-decile yield for the area; either an underpriced asset or a hidden risk that comps aren't pricing in. Stress-test before assuming the spread holds.
Location & tenants
- Location reads 79/100 on livability (#123 in NY, #2,002 nationally) — a middle-class / working-renter tenant base. Strengths: amenities A+, commute A+, health & safety A; Watch: crime C-, cost of living F.
- Uniondale Union Free School District (suburban): math 59% / reading 70% proficiency, ranked #164 of 590 in NY (top 28%) — acceptable for families but not a draw, mixed tenant base, ~2y average lease.
- Zoned schools: Uniondale High School (math 83% / reading 90%, grade A, #336 of 1,100 statewide, top 31%, 2,080 students, 62% FRL).
- Zoned-school proficiency averages 86% at this address vs 64% district-wide (+22 pts) — the actual schools serving this property are materially stronger than the Uniondale Union Free School District average implies; a family-tenant draw the district grade alone would hide.
- Market conditions: 167 active listings in the ZIP; 8 comparable units currently listed for rent nearby; rentals at typical pace (median 25d on market — plan ~3-4 weeks tenant-placement turnaround); solid renter incomes; 824 units permitted in Nassau County in 2024 (153 in 5+ unit buildings).
Forward outlook
- Local home prices are declining (-3.0%/yr); year-one equity from $2k of loan paydown is wiped out by about $9k of value loss. Plan a longer hold.
- Nassau County population projected at +7% by 2050 — modest demand growth; plan on rents tracking national, not racing it.
- At projected returns (-3.0% appreciation + 3.0% rent growth), your $85k cash investment doubles in ~7 years — after that, you're playing with house money.
Negotiation context
- Only 11 days on market — expect competitive offers; lowballing is unlikely to land.
- 2 sale attempts since 8y ago with the ask held roughly flat each time — persistent listings suggest the price (not the market) is what's stuck; bring a comps-based counter.
- Current owner paid $185k; list at $305k implies a 65% gain — meaningful room to come down on a strong offer.
Risks & watch-outs
- Watch-outs: built in 1941 — expect roof / HVAC / electrical / plumbing capex.
- Climate carrying-cost: major wind risk, 57% chance of damaging wind over 30y; extreme-heat days projected 7→16/yr by 2055 (HVAC capex compounding) — expect insurance premiums to compound above CPI over the hold.
Questions for the listing agent
- Built in 1941 — when were the roof, HVAC, electrical panel, plumbing, and water heater last replaced?
- Is there a deadline driving the sale (1031 exchange, divorce, estate, relocation)? That informs how much negotiation room exists.
- Schools are D-rated, which usually means shorter tenancies and higher turnover. Who's the typical renter profile here, and what's been the actual vacancy rate?
- What's the average days-on-market for RENTAL listings here right now (not sales)? A rising rental-DOM trend means longer vacancies and softer asking-rent achievability than the comps imply.
- What's the recent tenant-quality profile in this submarket — average credit score on applications, eviction rate, late-payment / NSF rate, and stable-employment percentage? A property-management company in the area should have these aggregated.
- How much new for-sale + rental construction is in the pipeline within 1–3 miles? Heavy new supply typically softens prices + rents 12–24 months out; constrained supply supports both.
Investment metrics
- 1% rule
- 1.52% ✓
- Cap rate
- 11.59%
- Cash-on-cash
- 18.92%
- DSCR
- 1.84
- GRM
- 5.5
CMA / ARV
- ARV (median comp)
- $732,619
- List price
- $305,000
- Delta
- -58.37%
- Verdict
- UNDERPRICED
- Comps
- 20 within 1.0 mi
Show comp detail 12 sales within ~0.75 mi
| Address | Dist | Beds/Ba | Sqft | Sold | Price | $/sf | Match |
|---|---|---|---|---|---|---|---|
| 269 Windsor Pkwy | 0.22mi | 3/1.0 (-1) | 1,500 (-0%) | 4mo | $620,000 | $413 | 77 |
| 141 Brown Ave | 0.28mi | 4/3.0 | 1,541 (+2%) | 4mo | $744,600 | $483 | 76 |
| 248 Kennedy Ave | 0.32mi | 3/2.0 (-1) | 1,474 (-2%) | 3mo | $740,000 | $502 | 75 |
| 15 Clyde Ave | 0.14mi | 3/2.0 (-1) | 1,656 (+10%) | 0mo | $625,000 | $377 | 72 |
| 34 Frazier St | 0.42mi | 3/1.5 (-1) | 1,472 (-2%) | 1mo | $480,000 | $326 | 68 |
| 48 Cliff Ave | 0.11mi | 4/1.0 | 1,289 (-14%) | 2mo | $454,000 | $352 | 65 |
| 135 Dietz St | 0.74mi | 4/2.0 | 1,463 (-3%) | 5mo | $735,000 | $502 | 56 |
| 34 Heath Pl | 0.40mi | 4/2.0 | 1,294 (-14%) | 2mo | $640,000 | $495 | 56 |
| 70 Baldwin Rd | 0.53mi | 4/3.0 | 1,612 (+7%) | 5mo | $660,000 | $409 | 55 |
| 203 Rutland Rd | 0.57mi | 4/1.5 | 1,368 (-9%) | 3mo | $680,000 | $497 | 54 |
| 2 Fordham Pl | 0.40mi | 3/1.0 (-1) | 1,300 (-14%) | 1mo | $450,226 | $346 | 49 |
| 23 Peters Ave | 0.71mi | 3/2.0 (-1) | 1,650 (+10%) | 2mo | $780,000 | $473 | 45 |
Match score weights: distance 35% · size 25% · config 20% · recency 20%. Top-matched comps best support the ARV.
Projected returns pro-forma
-3.0% appreciation · 3.0% rent growth · sell at horizon
- IRR
- 10.8%
- Equity multiple
- 1.43×
- Total profit
- $36,529
- Equity at exit
- $45,476
- IRR
- 19.9%
- Equity multiple
- 2.67×
- Total profit
- $143,038
- Equity at exit
- $26,371
Cash invested: $85,400 (down + closing). Projections, not guarantees.
Landlord ↔ Tenant lean methodology
- Overall (STATE)
- 15 Strongly Tenant-Friendly
- State New York
- 15 Strongly Tenant-Friendly · D+10
- County
- — inherits STATE
- City
- — inherits STATE
ZIP-level market 11550
- Active inventory
- 167
- Price-to-rent
- 5.5×
Monthly cashflow live
- Estimated rent
- $4,639 high interval (Pro) →
- Mortgage (P&I)
- −$1,599
- Tax from tax record
- −$592 /mo · $7,101/yr
- Insurance
- −$127
- HOA
- −$0
- Vacancy / Maint / Mgmt
- −$974
- Net cashflow
- $1,346
Break-even live
UW: 25.0% down · 7.5% · 30yr · 1.5% tax · 5.0% vac · 8.0% maint · 8.0% mgmt
Financing live
Cash to close
- Down payment
- $76,250
- Closing costs
- $9,150
- Reserves months
- —
- Total cash needed
- —
Loan-product check · same deal, 3 products live
Conventional
25% down · 7.5% · 30yr
- Down + closing
- —
- Monthly P&I
- —
- Monthly cashflow
- —
- DSCR
- —
- Eligible?
- —
Personal DTI + credit; lowest rate.
DSCR
20% down · 8.5% · 30yr
- Down + closing
- —
- Monthly P&I
- —
- Monthly cashflow
- —
- DSCR
- —
- Eligible?
- —
No personal income docs; deal must DSCR.
Hard money
10% down · 12.0% · 12mo
- Down + closing
- —
- Monthly P&I
- —
- Monthly cashflow
- —
- DSCR
- —
- Eligible?
- —
Short-term bridge; refi at stabilization.
Rent comps 8 comps
| Address | Beds | Baths | Sqft | Rent | $/sqft | DOM | Units | Dist |
|---|---|---|---|---|---|---|---|---|
| 533 Greenwich St Unit 1D Hempstead, NY | 3.0 | 2.0 | 1103 | $4,000 | $3.63 | 43d | 1 | 0.05mi |
| 54 Kane Ave Hempstead, NY | 5.0 | 2.0 | 1750 | $4,800 | $2.74 | 43d | 1 | 0.23mi |
| 366 Greenwich St Hempstead, NY | 3.0 | 1.5 | 1504 | $4,000 | $2.66 | 1d | 1 | 0.29mi |
| 523 Hawthorne Ave Uniondale, NY | 3.0 | 1.0 | 1328 | $3,300 | $2.48 | 24d | 1 | 0.63mi |
| 529 Maple Ave Unit Second Floor Uniondale, NY | 3.0 | 2.0 | 1240 | $3,750 | $3.02 | 24d | 1 | 0.83mi |
| 168 Lenox Ave Uniondale, NY | 5.0 | 2.0 | 1837 | $5,900 | $3.21 | 1d | 1 | 1.24mi |
| 21 Union Ave Hempstead, NY | 4.0 | 3.0 | 1342 | $5,700 | $4.25 | 1d | 1 | 1.36mi |
| 650 Winthrop Dr Uniondale, NY | 3.0 | 3.0 | 1300 | $4,900 | $3.77 | 1d | 1 | 1.46mi |
Listing history 7 events
-
2026-05-11status Pending 595-char remark
-
2026-04-30$305,000 Active 595-char remark
-
2019-01-08historical
-
2018-10-11status Under Contract
-
2018-09-27$290,000 New
-
1999-09-17soldstatus $185,000
-
1977-10-01soldstatus $42,500
ⓘ Source: listings_history table (triggers on properties + properties_extension) + one-shot
backfill from property_details.listing_events for pre-trigger history.
Tax reassessment forecast NY · Partial reset (capped growth)
- Current annual tax
- $7,101 · $592/mo
- Projected year-2 tax
- $7,101 · $592/mo
- Expected delta
- $0/yr ($0/mo · 0.0%)
ⓘ Screening estimate from a state-policy table — verify with the county assessor before closing.
Climate risk First Street
- Flood 1/10 Low FEMA zone X (unshaded) · 0% chance over 30 yrs
- Wildfire 1/10 Low
- Heat 6/10 Major 7 d/yr ≥96°F today · 16 d/yr by 30 yrs out
- Wind 6/10 Major 57% chance of damaging wind over 30 yrs
- Air quality 4/10 Moderate 5 unhealthy d/yr today · 8 by 30 yrs out
Nearby sold comps map
Loading sold comps map…
Walkable amenities ~0.75 mi
Loading nearby amenities…
Taxation est. · year 1
- Rental income
- $55,666
- − Mortgage interest
- −$17,085
- − Property taxes
- −$7,101
- − Insurance
- −$1,525
- − Repairs & maintenance
- −$4,453
- − Management
- −$4,453
- − Depreciation
- −$8,873
- Taxable income
- $12,176
- Est. tax owed @ 24.0%
- −$2,922
- After-tax cash flow
- $13,234/yr
For passive investors: Depreciation is non-cash, so a rental often shows a tax loss while cash-flowing — sheltering income. Rental losses are passive: they offset passive income freely, and up to $25,000/yr can offset ordinary (W-2) income if you actively participate and your MAGI is under $100k (phasing out to $0 by $150k); unused losses carry forward. On sale, claimed depreciation is recaptured at up to 25%, and gains may owe capital-gains tax (a 1031 exchange can defer both). Figures are a year-1 estimate at your 24.0% rate — not tax advice; consult a CPA.
Schools (NCES district)
- District
- Uniondale Union Free School District
- NCES district ID
- 3629280
- Math proficiency
- 59% ▲ 8.00%
- Reading proficiency
- 70% ▲ 17.00%
- Median HH income
- $78,596
- Composite
- 57.5/100
- National rank
- #1071
- State rank
- #164 of 590 in NY
Livability — Hempstead
- Score
- 79/100
- State rank
- #123
- US rank
- #2002
Category grades
Schools grade is shown separately in the Schools card above.
Census & demographics
- Census place
- Hempstead, NY
- County
- Nassau County · 653,051 people
- City population
- 60,960
- Metro
- New York-Newark-Jersey City, NY-NJ-PA
- Population (ZIP)
- 60,960
- Household income
- $92,677
- Rent vs Own
- Severe rent burden
- 2535.0
Population outlook (Nassau County) Hauer SSP2
- Today (2025)
- 1,409,302 people
- By 2030
- 1,431,482 · +1.6%
- By 2040
- 1,471,607 · +4.4%
- By 2050
- 1,502,845 · +6.6%
- By 2075
- 1,575,403 · +11.8%
- By 2100
- 1,554,356 · +10.3%
Race, ethnicity, and origin ACS 2023
- Neighborhood character
- Diverse neighborhood (Simpson 0.62)
- Race & ethnicity
- Hispanic / Latino 44% Black 43% Two or more races 14% White 7% Asian 2%
- Hispanic origin (detail)
- Mexican 1% Puerto Rican 3% Dominican 4%
- Common ancestry
- Hispanic 4%
- Foreign-born
- 37% · Canada, Jamaica
- Languages at home
- 53% English-only · Spanish 40% French/Haitian/Cajun 4% Other Indo-European 1%
Political lean MEDSL · Nassau
- 2024 margin
- Toss-up / Even · D 47.9% · R 52.1%
- 2008→2024 swing
- -12.6pp toward R · 2008: 8.4pp · 2024: -4.2pp
- All cycles
- 2024: R+4.2 2020: D+9.5 2016: D+5.3 2012: D+6.7 2008: D+8.4
Not yet ingested
- Civics
- —
Market trends
- HPI YoY
- ▼ -297.72%
- Current HPI
- 339.055
- Rent YoY
- —
- Metro
- New York-Newark-Jersey City, NY-NJ-PA
- State GDP YoY
- ▲ 2.60%
- F500 in state
- 92
Industry mix (Fortune 500 HQ in NY)
| Industry | F500 HQs | Revenue |
|---|---|---|
| Financial Services | 10 | $950B |
|
||
| Consumer Goods | 9 | $162B |
|
||
| Insurance | 4 | $225B |
|
||
| Telecommunications | 2 | $144B |
|
||
| Pharmaceuticals | 2 | $112B |
|
||
| Media / Entertainment | 2 | $69B |
|
||
Price history
+617.6% since first listed7 events — show timeline
- 2026-05-11 Pending — OneKey® MLS as Distributed by MLS Grid
- 2026-04-30 Listed $305,000 OneKey® MLS as Distributed by MLS Grid
- 2019-01-08 Listing Removed — OneKey® MLS as Distributed by MLS Grid
- 2018-10-11 Pending — OneKey® MLS as Distributed by MLS Grid
- 2018-09-27 Listed $290,000 OneKey® MLS as Distributed by MLS Grid
- 1999-09-17 Sold (Public Records) $185,000 Public Records
- 1977-10-01 Sold (Public Records) $42,500 Public Records
Property tax history
+2.8%/yrLatest (2024): $7,101 · +6.0% YoY. Source: county tax records.
Cash-flow waterfall
monthlySold comps — $/sqft
last 12 mo · ≤1 miLoading sold comps…