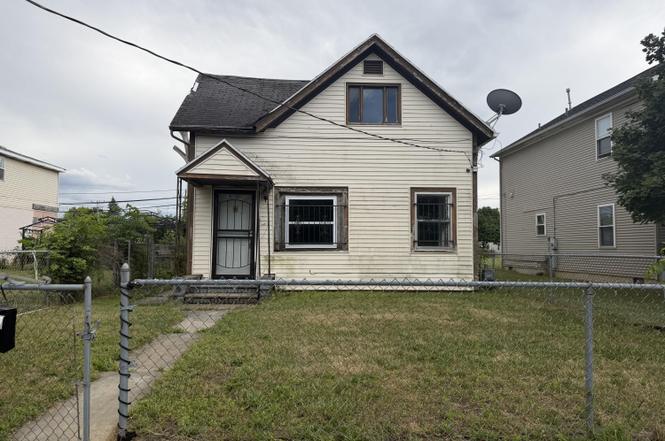
1015 Belmont Ave · Toledo, OH
Flood risk 1/10 · Minimal
- FEMA flood zone
- X (unshaded)
- Chance of flooding over 30 yrs
- 0.0%
- Est. flood insurance / yr
- $507 – $1,088
Fire risk 1/10 · Minimal
- Est. fire insurance / yr
- $713 – $1,323
Heat risk 3/10 · Minor
- Hot days now (above 101°F)
- 7 days/yr
- Hot days in 30 yrs
- 16 days/yr
Wind risk 2/10 · Minimal
- Chance of severe wind over 30 yrs
- —
Air-quality risk 2/10 · Minimal
- Unhealthy air days now
- 1 days/yr
- Unhealthy air days in 30 yrs
- 2 days/yr
Risk factors via First Street. Map © Google.
Why this score? — see what drove the B- grade
The composite is a weighted blend of 9 inputs, each scored 0–100. Each bar is that input's sub-score; the figure is the points it added to the 100-point composite (weight × sub-score).
- Cash flow +30.0/30.0
- DSCR +10.0/10.0
- 1% rule +8.1/10.0
- ARV discount +7.5/15.0
- Rent growth +4.5/5.0
- Livability +3.3/5.0
- Condition / age +2.5/5.0
- Schools +1.6/10.0
- Appreciation +0.0/10.0
$83,000
🖨 Deal sheet 📄 Offer letter ✓ Due diligence
Listing remarks MLS
Welcome to this charming 2 bed, 1 bath home featuring an open living and kitchen layout with updated kitchen and bathroom, new flooring, and fresh paint. Schedule your showing today!
Key facts
- 3,800 sq ft lot
- 3 parking spots
- Built 1887
Property features AI
Exterior
- Parking: Three parking spaces; Alley access, on-street parking, and parking pad
- Utilities: Public water; Public sewer; Other utilities
- Home design: Single-family residence; One story
- Construction: Vinyl siding; Crawl space foundation; Built as a one-level home
- Exterior features: Shingle roof; Lot about 0.09 acres
Interior
- Kitchen: Main-level kitchen (approx. 12' long)
- Bedrooms: Two bedrooms on the main level (one approx. 12' long, second approx. 11' long)
- Flooring: Vinyl flooring
- Bathrooms: One full bathroom
- Heating & cooling: Natural gas heating
- Interior features: Open living area with four main rooms; Other interior features
- Laundry & utility: Main-level laundry features (other)
Neighborhood map
What this means for you Summary
Snapshot
- This is a 2-bed/1.5-bath single-family listed at $83k.
Deal economics
- At list price, monthly cash flow is $341 ($4k/yr) — positive.
- The deal already cash-flows at list — no discount required.
- Meets the 1% rule at list price ($1k rent vs $83k).
- Cap rate 11.2% vs local median 7.6% in Toledo — top-decile yield for the area; either an underpriced asset or a hidden risk that comps aren't pricing in. Stress-test before assuming the spread holds.
Location & tenants
- Location reads 66/100 on livability (#645 in OH) — a middle-class / working-renter tenant base. Strengths: cost of living A+, housing A+, health & safety A+; Watch: amenities C-, crime F, commute F.
- Toledo City (urban): math 15% / reading 24% proficiency, ranked #634 of 656 in OH (top 97%) — low school quality limits family demand, transient renter base, plan for 1-2y turnover; 72% free/reduced lunch — lower-income household profile, screen leases tightly.
- Zoned schools: Pickett Elementary School (math 8% / reading 2%, grade F, #1,554 of 1,584 statewide, top 100%, 274 students, 0% FRL); Jesup W. Scott High School (math 8% / reading 17%, grade F, #726 of 781 statewide, top 94%, 736 students, 0% FRL) — zoned schools average 0% FRL vs 72% district-wide (72 pts lower); this property's tenant base skews higher-income than the district average.
- Market conditions: Rents rising fast (+8.2%/yr); 83 active listings in the ZIP; 30 comparable units currently listed for rent nearby; rentals lingering (median 44d on market — plan ~5-8 weeks vacancy on turnover, expect pricing pressure); 60% of comp listings sitting > 30 days — soft ceiling on asking rent; lower-income renter base — watch delinquency; 415 units permitted in Lucas County in 2024 (122 in 5+ unit buildings).
- This rent runs 32% of the median local income ($41k/yr) — at the standard rent-burdened threshold; future hikes will face affordability resistance.
Forward outlook
- Local home prices are declining (-3.0%/yr); year-one equity from $574 of loan paydown is wiped out by about $2k of value loss. Plan a longer hold.
- Lucas County population projected at -16% by 2050 — secular population decline; favor cash flow + early exit over multi-decade hold.
- At projected returns (-3.0% appreciation + 8.0% rent growth), your $23k cash investment doubles in ~6 years — after that, you're playing with house money.
Negotiation context
- Only 2 days on market — expect competitive offers; lowballing is unlikely to land.
- 6 sale attempts with the ask held roughly flat each time — persistent listings suggest the price (not the market) is what's stuck; bring a comps-based counter.
- Current owner paid $32k; list at $83k implies a 155% gain — meaningful room to come down on a strong offer.
Risks & watch-outs
- Watch-outs: built in 1887 — expect roof / HVAC / electrical / plumbing capex.
Questions for the listing agent
- Built in 1887 — when were the roof, HVAC, electrical panel, plumbing, and water heater last replaced?
- Is there a deadline driving the sale (1031 exchange, divorce, estate, relocation)? That informs how much negotiation room exists.
- Schools are D-rated, which usually means shorter tenancies and higher turnover. Who's the typical renter profile here, and what's been the actual vacancy rate?
- Crime grade is F in this area — have there been break-ins, vandalism, or insurance claims at this property in the last 3 years? What carrier currently insures it and at what premium?
- What's the average days-on-market for RENTAL listings here right now (not sales)? A rising rental-DOM trend means longer vacancies and softer asking-rent achievability than the comps imply.
- What's the recent tenant-quality profile in this submarket — average credit score on applications, eviction rate, late-payment / NSF rate, and stable-employment percentage? A property-management company in the area should have these aggregated.
- How much new for-sale + rental construction is in the pipeline within 1–3 miles? Heavy new supply typically softens prices + rents 12–24 months out; constrained supply supports both.
Investment metrics
- 1% rule
- 1.31% ✓
- Cap rate
- 11.22%
- Cash-on-cash
- 17.61%
- DSCR
- 1.78
- GRM
- 6.3
CMA / ARV
- ARV (on-the-fly)
- $33,912
- Comps found
- 7
Show comp detail 7 sales within ~0.75 mi
| Address | Dist | Beds/Ba | Sqft | Sold | Price | $/sf | Match |
|---|---|---|---|---|---|---|---|
| 109 Wellington St | 0.52mi | 2/1.0 | 859 (-9%) | 3mo | $4,500 | $5 | 57 |
| 1338 Pinewood Ave | 0.51mi | 2/1.0 | 900 (-4%) | 17mo | $9,000 | $10 | 52 |
| 1524 Vance St | 0.65mi | 3/1.0 (+1) | 920 (-2%) | 22mo | $33,000 | $36 | 40 |
| 1041 Whittier St | 0.73mi | 3/1.0 (+1) | 968 (+3%) | 21mo | $55,000 | $57 | 37 |
| 1534 Pinewood Ave | 0.71mi | 3/1.0 (+1) | 1,030 (+9%) | 9mo | $74,900 | $73 | 37 |
| 1546 Tecumseh St | 0.73mi | 2/1.0 | 854 (-9%) | 14mo | $22,650 | $27 | 37 |
| 566 Palmwood Ave | 0.68mi | 3/1.0 (+1) | 1,036 (+10%) | 12mo | $55,000 | $53 | 35 |
Match score weights: distance 35% · size 25% · config 20% · recency 20%. Top-matched comps best support the ARV.
Projected returns pro-forma
-3.0% appreciation · 8.0% rent growth · sell at horizon
- IRR
- 14.3%
- Equity multiple
- 1.60×
- Total profit
- $14,016
- Equity at exit
- $12,376
- IRR
- 26.4%
- Equity multiple
- 3.85×
- Total profit
- $66,338
- Equity at exit
- $7,176
Cash invested: $23,240 (down + closing). Projections, not guarantees.
Landlord ↔ Tenant lean methodology
- Overall (STATE)
- 73 Landlord-Friendly
- State Ohio
- 73 Landlord-Friendly · R+6
- County
- — inherits STATE
- City
- — inherits STATE
ZIP-level market 43607
- Home prices YoY
- -27.5%
- Rents YoY
- 8.2%
- Active inventory
- 83
- Price-to-rent
- 6.3×
Monthly cashflow live
- Estimated rent
- $1,091 high interval (Pro) →
- Mortgage (P&I)
- −$435
- Tax from tax record
- −$51 /mo · $609/yr
- Insurance
- −$35
- HOA
- −$0
- Vacancy / Maint / Mgmt
- −$229
- Net cashflow
- $341
Break-even live
UW: 25.0% down · 7.5% · 30yr · 1.5% tax · 5.0% vac · 8.0% maint · 8.0% mgmt
Financing live
Cash to close
- Down payment
- $20,750
- Closing costs
- $2,490
- Reserves months
- —
- Total cash needed
- —
Loan-product check · same deal, 3 products live
Conventional
25% down · 7.5% · 30yr
- Down + closing
- —
- Monthly P&I
- —
- Monthly cashflow
- —
- DSCR
- —
- Eligible?
- —
Personal DTI + credit; lowest rate.
DSCR
20% down · 8.5% · 30yr
- Down + closing
- —
- Monthly P&I
- —
- Monthly cashflow
- —
- DSCR
- —
- Eligible?
- —
No personal income docs; deal must DSCR.
Hard money
10% down · 12.0% · 12mo
- Down + closing
- —
- Monthly P&I
- —
- Monthly cashflow
- —
- DSCR
- —
- Eligible?
- —
Short-term bridge; refi at stabilization.
Rent comps 30 comps
| Address | Beds | Baths | Sqft | Rent | $/sqft | DOM | Units | Dist |
|---|---|---|---|---|---|---|---|---|
| 1026 Oakwood Ave Toledo, OH | 2.0 | 1.0 | 1100 | $850 | $0.77 | 43d | 1 | 0.60mi |
| 400 Nebraska Ave Toledo, OH | 1.0 | 1.0 | 664 | $1,129 | $1.70 | 13d | 1 | 0.88mi |
| 223 Charles St Toledo, OH | 2.0 | 1.0 | 612 | $875 | $1.43 | 43d | 1 | 0.89mi |
| 1825 Collingwood Blvd Toledo, OH | 1.0 | 1.0 | 710 | $850 | $1.20 | 13d | 1 | 0.96mi |
| 1785 Tecumseh St Toledo, OH | 2.0 | 1.0 | 930 | $900 | $0.97 | 43d | 1 | 0.98mi |
| 142 23rd St Toledo, OH | 1.0 | 1.0–1.5 | 508 | $1,395 | $2.75 | 43d | 1 | 1.01mi |
| 1321 Gordon St Toledo, OH | 3.0 | 1.0 | 1121 | $1,050 | $0.94 | 43d | 1 | 1.03mi |
| 1521 Emma St Unit LABS 1521 Emma St, B 43051619729 Toledo, OH | 1.0 | 1.0 | 975 | $900 | $0.92 | 43d | 1 | 1.10mi |
| 2115 Collingwood Blvd Toledo, OH | 2.0 | 1.0 | 676 | $765 | $1.13 | 23d | 1 | 1.19mi |
| 1418 Colburn St Toledo, OH | 3.0 | 1.0 | 992 | $1,200 | $1.21 | 13d | 1 | 1.29mi |
| 34 S Erie St Unit 209 Toledo, OH | 1.0 | 1.0 | 930 | $1,375 | $1.48 | 23d | 1 | 1.32mi |
| 425 W Bancroft St Toledo, OH | 1.0 | 1.0 | 711 | $725 | $1.02 | 43d | 1 | 1.32mi |
| 15 S Ontario St Apt 409 Toledo, OH | 1.0 | 1.0 | 984 | $1,695 | $1.72 | 43d | 1 | 1.33mi |
| 409 W Bancroft St Toledo, OH | 2.0 | 1.0 | 730 | $880 | $1.21 | 43d | 1 | 1.33mi |
| 34 S Erie St Unit 107 Toledo, OH | 1.0 | 1.0 | 1103 | $1,300 | $1.18 | 23d | 1 | 1.33mi |
| 34 S Erie St Unit 611 Toledo, OH | 1.0 | 1.0 | 990 | $1,300 | $1.31 | 43d | 1 | 1.33mi |
| 34 S Erie St Apt 602 Toledo, OH | 1.0 | 1.0 | 894 | $1,315 | $1.47 | 43d | 1 | 1.33mi |
| 34 S Erie St Unit 202 Toledo, OH | 1.0 | 1.0 | 894 | $1,275 | $1.43 | 23d | 1 | 1.33mi |
| 34 S Erie St Unit 409 Toledo, OH | 1.0 | 1.0 | 930 | $1,375 | $1.48 | 43d | 1 | 1.33mi |
| 625 Virginia St Toledo, OH | 2.0 | 1.0 | 1000 | $850 | $0.85 | 13d | 1 | 1.34mi |
| 625 Virginia St Toledo, OH | 2.0 | 1.0 | 1000 | $800 | $0.80 | 43d | 1 | 1.34mi |
| 827 Colburn St Toledo, OH | 2.0 | 1.0 | 1092 | $750 | $0.69 | 43d | 1 | 1.34mi |
| 1 S Erie St Toledo, OH | 1.0 | 1.0 | 846 | $1,410 | $1.67 | 13d | 1 | 1.40mi |
| 322 14th St Apt 203 Toledo, OH | 3.0 | 1.5 | 1065 | $1,000 | $0.94 | 13d | 1 | 1.40mi |
| 538 Nicholas St Unit B Toledo, OH | 1.0 | 1.0 | 600 | $600 | $1.00 | 43d | 1 | 1.41mi |
| 1037 Orchard St Toledo, OH | 2.0 | 1.0 | 696 | $820 | $1.18 | 21d | 1 | 1.41mi |
| 332 14th St Unit 303 Toledo, OH | 3.0 | 1.5 | 1040 | $1,000 | $0.96 | 43d | 1 | 1.41mi |
| 416 Maumee Ave Unit D Toledo, OH | 1.0 | 1.0 | 622 | $475 | $0.76 | 43d | 1 | 1.44mi |
| 1133 Parkside Blvd Toledo, OH | 2.0 | 1.0 | 960 | $850 | $0.89 | 43d | 1 | 1.46mi |
| 771 Orchard St Unit 7715 Toledo, OH | 2.0 | 1.0 | 1086 | $645 | $0.59 | 23d | 1 | 1.49mi |
Listing history 3 events
-
2026-06-18days on market $83,000 Active 2 DOM
-
2026-06-17remarks 145-char remark
-
2026-06-17$83,000 Active 1 DOM
ⓘ Source: listings_history table (triggers on properties + properties_extension) + one-shot
backfill from property_details.listing_events for pre-trigger history.
Tax reassessment forecast OH · Partial reset (capped growth)
- Current annual tax
- $609 · $51/mo
- Projected year-2 tax
- $952 · $79/mo
- Expected delta
- +$343/yr (+$29/mo · 56.3%)
ⓘ Screening estimate from a state-policy table — verify with the county assessor before closing.
Climate risk First Street
- Flood 1/10 Low FEMA zone X (unshaded) · 0% chance over 30 yrs
- Wildfire 1/10 Low
- Heat 3/10 Moderate 7 d/yr ≥101°F today · 16 d/yr by 30 yrs out
- Wind 2/10 Low
- Air quality 2/10 Low 1 unhealthy d/yr today · 2 by 30 yrs out
Nearby sold comps map
Loading sold comps map…
Walkable amenities ~0.75 mi
Loading nearby amenities…
Taxation est. · year 1
- Rental income
- $13,087
- − Mortgage interest
- −$4,649
- − Property taxes
- −$609
- − Insurance
- −$415
- − Repairs & maintenance
- −$1,047
- − Management
- −$1,047
- − Depreciation
- −$2,415
- Taxable income
- $2,906
- Est. tax owed @ 24.0%
- −$697
- After-tax cash flow
- $3,395/yr
For passive investors: Depreciation is non-cash, so a rental often shows a tax loss while cash-flowing — sheltering income. Rental losses are passive: they offset passive income freely, and up to $25,000/yr can offset ordinary (W-2) income if you actively participate and your MAGI is under $100k (phasing out to $0 by $150k); unused losses carry forward. On sale, claimed depreciation is recaptured at up to 25%, and gains may owe capital-gains tax (a 1031 exchange can defer both). Figures are a year-1 estimate at your 24.0% rate — not tax advice; consult a CPA.
Schools (NCES district)
- District
- Toledo City
- NCES district ID
- 3904490
- Math proficiency
- 15% ▼ -16.00%
- Reading proficiency
- 24% ▼ -13.00%
- Median HH income
- $32,137
- Composite
- 15.76/100
- National rank
- #9276
- State rank
- #634 of 656 in OH
Livability — Toledo
- Score
- 66/100
- State rank
- #645
- US rank
- #11442
Category grades
Schools grade is shown separately in the Schools card above.
Census & demographics
- Census place
- Toledo, OH
- County
- Lucas County · 380,724 people
- City population
- 280,811
- Metro
- Toledo, OH
- Population (ZIP)
- 19,469
- Household income
- $41,335
- Rent vs Own
- Severe rent burden
- 1157.0
Population outlook (Lucas County) Hauer SSP2
- Today (2025)
- 420,751 people
- By 2030
- 410,187 · -2.5%
- By 2040
- 384,019 · -8.7%
- By 2050
- 355,125 · -15.6%
- By 2075
- 291,683 · -30.7%
- By 2100
- 233,670 · -44.5%
Race, ethnicity, and origin ACS 2023
- Neighborhood character
- Diverse neighborhood (Simpson 0.57)
- Race & ethnicity
- Black 59% White 27% Two or more races 6% Hispanic / Latino 6% Asian 3%
- Hispanic origin (detail)
- Mexican 3% Puerto Rican 2%
- Common ancestry
- Lithuanian 2% Romanian 2% Slovak 1%
- Foreign-born
- 4% · Canada
- Languages at home
- 94% English-only · Other Indo-European 1% Spanish 1% Russian/Polish/Slavic 1%
Political lean MEDSL · Lucas
- 2024 margin
- D (+12.6) · D 55.8% · R 43.2%
- 2008→2024 swing
- -18.9pp toward R · 2008: 31.4pp · 2024: 12.6pp
- All cycles
- 2024: D+12.6 2020: D+16.8 2016: D+17.4 2012: D+30.4 2008: D+31.4
Not yet ingested
- Civics
- —
Market trends
- HPI YoY
- ▼ -66.58%
- Current HPI
- 175.2772
- Rent YoY
- ▲ 8.19%
- Metro
- Toledo, OH
- State GDP YoY
- ▲ 1.98%
- F500 in state
- 48
Industry mix (Fortune 500 HQ in OH)
| Industry | F500 HQs | Revenue |
|---|---|---|
| Insurance | 3 | $145B |
|
||
| Industrial Machinery | 3 | $49B |
|
||
| Financial Services | 3 | $24B |
|
||
| Consumer Goods | 2 | $93B |
|
||
| Aerospace / Defense | 2 | $47B |
|
||
| Utilities | 2 | $33B |
|
||
Price history
+822.2% since first listed18 events — show timeline
- 2026-06-16 Listed $83,000 NORIS
- 2026-03-30 Sold (MLS) $32,500 NORIS
- 2026-03-19 Contingent — NORIS
- 2026-02-09 Listed $34,900 NORIS
- 2025-12-09 Listing Removed — NORIS
- 2025-11-03 Price Changed $39,400 NORIS
- 2025-10-14 Price Changed $17,000 NORIS
- 2025-09-14 Price Changed $39,900 NORIS
- 2025-09-01 Price Changed $44,900 NORIS
- 2025-08-20 Listed $49,900 NORIS
- 2025-08-11 Sold (MLS) $17,000 NORIS
- 2025-08-07 Pending — NORIS
- 2025-08-01 Relisted — NORIS
- 2025-07-28 Pending — NORIS
- 2025-07-16 Relisted — NORIS
- 2025-05-23 Pending — NORIS
- 2025-04-30 Listed $19,900 NORIS
- 1986-04-14 Sold (Public Records) $9,000 Public Records
Property tax history
+2.4%/yrLatest (2025): $609 · -13.4% YoY. Source: county tax records.
Cash-flow waterfall
monthlySold comps — $/sqft
last 12 mo · ≤1 miLoading sold comps…