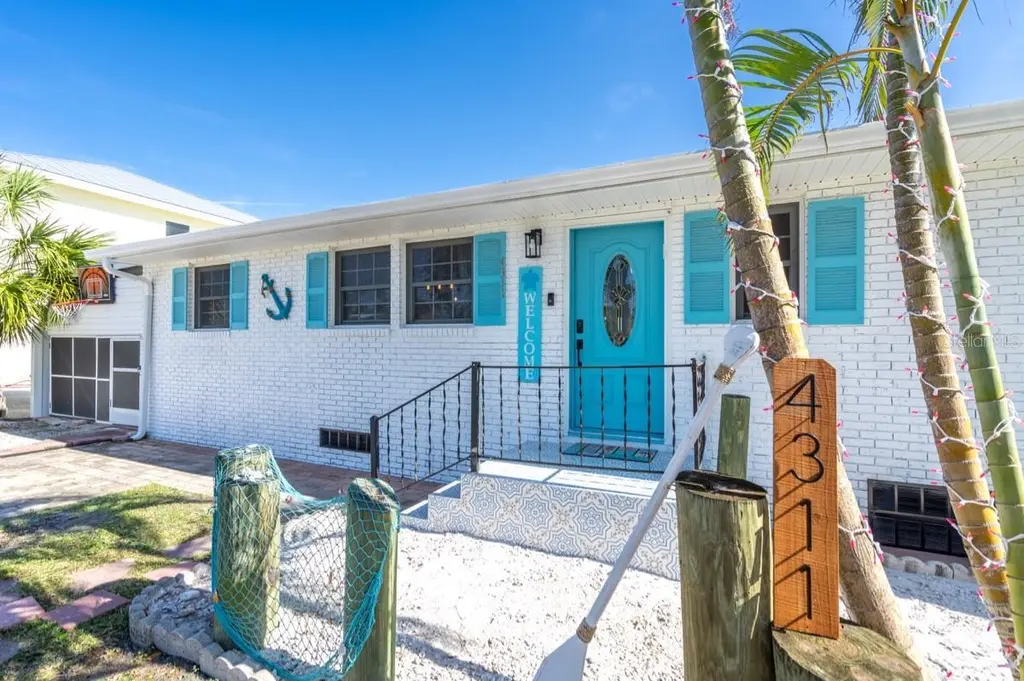
4311 123rd St W · Cortez, FL
Flood risk 10/10 · Severe
- FEMA flood zone
- AE
- Chance of flooding over 30 yrs
- 0.99%
- Est. flood insurance / yr
- $1,737 – $8,500
Fire risk 1/10 · Minimal
- Est. fire insurance / yr
- $947 – $1,759
Heat risk 10/10 · Severe
- Hot days now (above 106°F)
- 7 days/yr
- Hot days in 30 yrs
- 29 days/yr
Wind risk 10/10 · Severe
- Chance of severe wind over 30 yrs
- 99.0%
Air-quality risk 3/10 · Minor
- Unhealthy air days now
- 2 days/yr
- Unhealthy air days in 30 yrs
- 2 days/yr
Risk factors via First Street. Map © Google.
Why this score? — see what drove the B grade
The composite is a weighted blend of 9 inputs, each scored 0–100. Each bar is that input's sub-score; the figure is the points it added to the 100-point composite (weight × sub-score).
- Cash flow +29.7/30.0
- DSCR +10.0/10.0
- 1% rule +8.2/10.0
- ARV discount +7.5/15.0
- Appreciation +6.6/10.0
- Schools +4.4/10.0
- Livability +3.5/5.0
- Rent growth +2.5/5.0
- Condition / age +2.5/5.0
$389,900
🖨 Deal sheet 📄 Offer letter ✓ Due diligence
Listing remarks
Short Sale. Ideal for an Investor or Owner occupant looking for the ultimate Beach life. Property is a 4 bedrooms, 2 baths less than 1 miles away from Bradenton Beach and Anne Marie Island!!. Open kitchen, Stainless steel appliances, comfortable Island, spacious living room, lots of natural light. Good size bedrooms, vinyl flooring throughout, screened patio overlooking the marina. Brand New Roof, Good A/C, New Washer and Dryer inside CarPort. Spacious yard with much potential for a pool or much more. Five minutes to the Island and all Anne Marie Island has to offer.
Key facts
- Screened patio
- Good a/c
- Brand new roof
Tags
Property features AI
Finance
- Other: Lot approximately 0.18 acres (80 x 100); Land area less than 1/4 acre; Zoned RDD6/CH
- Financial info: No lease restrictions
- HOA & community: No association / HOA indicated; No association approval required
Exterior
- Parking: Driveway; Open parking; Carport (1 space)
- Utilities: Public water and well; Public sewer; Public utilities
- Home design: Single family residence; One story; Faces south; Residential property
- Construction: Block construction; Other roof; Crawlspace and stilt/on piling foundation; Built on pilings/stilts
- Exterior features: Sliding doors; Other exterior features; Bay/Harbor and Intracoastal Waterway view
Interior
- Kitchen: Dishwasher; Disposal; Microwave; Refrigerator; Exhaust fan; Electric water heater; Other kitchen appliances
- Bedrooms: 4 bedrooms
- Flooring: Vinyl
- Bathrooms: 2 full bathrooms
- Heating & cooling: Central heating; Central air conditioning
- Interior features: Ceiling fans; Sliding doors
- Laundry & utility: Inside laundry; Washer and dryer included (appliances listed)
Neighborhood map
What this means for you Summary
Snapshot
- This is a 2-bed/1.0-bath single-family listed at $390k.
Deal economics
- At list price, monthly cash flow is $997 ($12k/yr) — positive.
- The deal already cash-flows at list — no discount required.
- Meets the 1% rule at list price ($5k rent vs $390k).
- Cap rate 10.7% vs local median 1.8% in Cortez — top-decile yield for the area; either an underpriced asset or a hidden risk that comps aren't pricing in. Stress-test before assuming the spread holds.
Location & tenants
- Location reads 69/100 on livability (#486 in FL) — a middle-class / working-renter tenant base. Strengths: crime A+, commute A+, housing A+; Watch: cost of living C-, schools D-, amenities F.
- Manatee (suburban): math 54% / reading 50% proficiency, ranked #26 of 73 in FL (top 36%) — acceptable for families but not a draw, mixed tenant base, ~2y average lease.
- Market conditions: 30 active listings in the ZIP; 13 comparable units currently listed for rent nearby; rentals at typical pace (median 24d on market — plan ~3-4 weeks tenant-placement turnaround); 7,472 units permitted in Manatee County in 2024 (1,782 in 5+ unit buildings).
Forward outlook
- In year one you build about $15k of equity ($3k loan paydown + $13k appreciation (3.2% local appreciation)).
- Manatee County population projected at +43% by 2050 — long-run rental-demand tailwind backs the buy-and-hold thesis.
- At projected returns (3.2% appreciation + 3.0% rent growth), your $109k cash investment doubles in ~4 years — after that, you're playing with house money.
- By year 3, paydown + projected appreciation supports a ~$38k cash-out refi (75% LTV) — recoverable capital for the next deal without selling this one.
Negotiation context
- Only 7 days on market — expect competitive offers; lowballing is unlikely to land.
- 9 sale attempts since 4y ago with the ask held roughly flat each time — persistent listings suggest the price (not the market) is what's stuck; bring a comps-based counter.
Risks & watch-outs
- Watch-outs: flood insurance adds $427/mo.
- Climate carrying-cost: in FEMA flood zone AE (mandatory federal flood insurance); severe wind risk, 99% chance of damaging wind over 30y; extreme-heat days projected 7→29/yr by 2055 (HVAC capex compounding) — expect insurance premiums to compound above CPI over the hold.
Questions for the listing agent
- Built in 1974 — when were the roof, HVAC, electrical panel, plumbing, and water heater last replaced?
- What's the actual annual flood-insurance premium (NFIP or private), and is the property in a SFHA with mandatory coverage?
- Is there a deadline driving the sale (1031 exchange, divorce, estate, relocation)? That informs how much negotiation room exists.
- Schools are D-rated, which usually means shorter tenancies and higher turnover. Who's the typical renter profile here, and what's been the actual vacancy rate?
- What's the average days-on-market for RENTAL listings here right now (not sales)? A rising rental-DOM trend means longer vacancies and softer asking-rent achievability than the comps imply.
- What's the recent tenant-quality profile in this submarket — average credit score on applications, eviction rate, late-payment / NSF rate, and stable-employment percentage? A property-management company in the area should have these aggregated.
- How much new for-sale + rental construction is in the pipeline within 1–3 miles? Heavy new supply typically softens prices + rents 12–24 months out; constrained supply supports both.
Investment metrics
- 1% rule
- 1.32% ✓
- Cap rate
- 10.67%
- Cash-on-cash
- 15.65%
- DSCR
- 1.70
- GRM
- 6.3
CMA / ARV
- ARV (on-the-fly)
- $1,216,750
- Comps found
- 12
Show comp detail 12 sales within ~0.75 mi
| Address | Dist | Beds/Ba | Sqft | Sold | Price | $/sf | Match |
|---|---|---|---|---|---|---|---|
| 4337 Marina View Way | 0.14mi | 3/2.5 (+1) | 1,678 (+7%) | 0mo | $1,465,000 | $873 | 71 |
| 4322 Marina View Way | 0.16mi | 3/2.5 (+1) | 1,678 (+7%) | 0mo | $1,275,000 | $760 | 70 |
| 4305 Marina View Way | 0.15mi | 3/2.5 (+1) | 1,683 (+7%) | 2mo | $1,610,000 | $957 | 68 |
| 4318 Marina View Way | 0.16mi | 3/2.5 (+1) | 1,683 (+7%) | 9mo | $1,350,000 | $802 | 62 |
| 4337 Saltwater Pearl Way | 0.21mi | 3/2.5 (+1) | 1,678 (+7%) | 7mo | $1,095,000 | $653 | 62 |
| 4215 Saltwater Pearl Way | 0.20mi | 3/2.5 (+1) | 1,678 (+7%) | 8mo | $1,150,000 | $685 | 62 |
| 4425 123rd ST Ct W | 0.16mi | 3/2.0 (+1) | 1,450 (-8%) | 14mo | $465,000 | $321 | 59 |
| 4231 Marina View Way | 0.15mi | 3/2.5 (+1) | 1,678 (+7%) | 14mo | $1,580,000 | $942 | 58 |
| 12507 Gulf Breeze Ter | 0.19mi | 3/2.5 (+1) | 1,678 (+7%) | 13mo | $1,325,000 | $790 | 58 |
| 12511 Gulf Breeze Ter | 0.20mi | 3/2.5 (+1) | 1,678 (+7%) | 22mo | $1,300,000 | $775 | 50 |
| 3620 118th St W | 0.57mi | 2/2.0 | 1,802 (+15%) | 1mo | $475,000 | $264 | 44 |
| 3901 116th Street Ct W | 0.51mi | 2/1.5 | 1,423 (-9%) | 18mo | $160,000 | $112 | 44 |
Match score weights: distance 35% · size 25% · config 20% · recency 20%. Top-matched comps best support the ARV.
Projected returns pro-forma
3.23% appreciation · 3.0% rent growth · sell at horizon
- IRR
- 18.3%
- Equity multiple
- 2.06×
- Total profit
- $115,494
- Equity at exit
- $180,323
- IRR
- 19.6%
- Equity multiple
- 3.90×
- Total profit
- $316,841
- Equity at exit
- $281,857
Cash invested: $109,172 (down + closing). Projections, not guarantees.
Landlord ↔ Tenant lean methodology
- Overall (STATE)
- 87 Strongly Landlord-Friendly
- State Florida
- 87 Strongly Landlord-Friendly · R+3
- County
- — inherits STATE
- City
- — inherits STATE
ZIP-level market 34215
- Home prices YoY
- 1.2%
- Active inventory
- 30
- Price-to-rent
- 6.3×
Monthly cashflow live
- Estimated rent
- $5,147 high interval (Pro) →
- Mortgage (P&I)
- −$2,045
- Tax from tax record
- −$435 /mo · $5,220/yr
- Insurance
- −$162
- Flood insurance flood zone
- −$427 /mo · $5,118/yr
- HOA
- −$0
- Vacancy / Maint / Mgmt
- −$1,081
- Net cashflow
- $997
Break-even live
UW: 25.0% down · 7.5% · 30yr · 1.5% tax · 5.0% vac · 8.0% maint · 8.0% mgmt
Financing live
Cash to close
- Down payment
- $97,475
- Closing costs
- $11,697
- Reserves months
- —
- Total cash needed
- —
Loan-product check · same deal, 3 products live
Conventional
25% down · 7.5% · 30yr
- Down + closing
- —
- Monthly P&I
- —
- Monthly cashflow
- —
- DSCR
- —
- Eligible?
- —
Personal DTI + credit; lowest rate.
DSCR
20% down · 8.5% · 30yr
- Down + closing
- —
- Monthly P&I
- —
- Monthly cashflow
- —
- DSCR
- —
- Eligible?
- —
No personal income docs; deal must DSCR.
Hard money
10% down · 12.0% · 12mo
- Down + closing
- —
- Monthly P&I
- —
- Monthly cashflow
- —
- DSCR
- —
- Eligible?
- —
Short-term bridge; refi at stabilization.
Rent comps 13 comps
| Address | Beds | Baths | Sqft | Rent | $/sqft | DOM | Units | Dist |
|---|---|---|---|---|---|---|---|---|
| 4325 Marina View Way Cortez, FL | 3.0 | 2.5 | 1678 | $8,000 | $4.77 | 23d | 1 | 0.12mi |
| 12112 44th Ave W Unit 1545997P Cortez, FL | 2.0 | 2.0 | 1216 | $1,613 | $1.33 | 14d | 1 | 0.14mi |
| 4337 Saltwater Pearl Way Cortez, FL | 3.0 | 2.5 | 1678 | $4,200 | $2.50 | 23d | 1 | 0.19mi |
| 4333 Saltwater Pearl Way Cortez, FL | 3.0 | 2.5 | 1678 | $7,000 | $4.17 | 21d | 1 | 0.19mi |
| 2100 Avenue A Bradenton Beach, FL | 3.0 | 2.0 | 2077 | $3,000 | $1.44 | 15d | 1 | 1.09mi |
| 1397 Perico Point Cir Unit 1397 Bradenton, FL | 2.0 | 2.0 | 1866 | $4,500 | $2.41 | 23d | 1 | 1.13mi |
| 1318 Perico Point Cir Bradenton, FL | 2.0 | 2.0 | 1272 | $5,500 | $4.32 | 23d | 1 | 1.15mi |
| 1155 Edgewater Cir #28 Bradenton, FL | 2.0 | 2.0 | 1486 | $2,500 | $1.68 | 23d | 1 | 1.17mi |
| 971 Waterside Ln Bradenton, FL | 2.0 | 2.0 | 1069 | $6,000 | $5.61 | 23d | 1 | 1.29mi |
| 1233 Spoonbill Landings Cir Unit NA Bradenton, FL | 2.0 | 2.0 | 1272 | $2,500 | $1.97 | 15d | 1 | 1.30mi |
| 1216 Spoonbill Landings Cir Bradenton, FL | 2.0 | 2.0 | 1334 | $2,500 | $1.87 | 23d | 1 | 1.35mi |
| 2511 Avenue C Unit W Bradenton Beach, FL | 2.0 | 2.0 | 1511 | $6,500 | $4.30 | 23d | 1 | 1.47mi |
| 922 Sandpiper Cir Bradenton, FL | 2.0 | 2.0 | 1096 | $3,500 | $3.19 | 23d | 1 | 1.48mi |
Listing history 30 events
-
2026-05-04status Pending
-
2026-04-27$389,900 Active
-
2026-03-11historical
-
2025-09-15status Active
-
2025-09-15price $499,900
-
2025-08-09historical $2,999
-
2025-07-23price $2,999
-
2025-07-08price $3,400
-
2025-07-07price $549,900
-
2025-06-20$3,750
-
2025-06-20price $3,750
-
2025-06-19$575,000 Active
-
2025-01-29historical
-
2024-12-21$499,990 Active
-
2024-09-23historical
-
2024-07-24price $649,000
-
2024-05-22price $659,900
-
2024-05-01price $669,900
-
2024-04-18price $679,900
-
2024-03-08$689,000 Active
-
2024-03-01historical
-
2023-11-29price $699,900
-
2023-10-19$729,900 Active
-
2022-07-06soldstatus $420,000
-
2022-07-01soldstatus $420,000 Closed
-
2022-06-08status Pending
-
2022-06-03status Active
-
2022-05-29status Pending
-
2022-05-17$450,000 Active
-
1999-05-20soldstatus $80,500
ⓘ Source: listings_history table (triggers on properties + properties_extension) + one-shot
backfill from property_details.listing_events for pre-trigger history.
Tax reassessment forecast FL · Resets to sale price
- Current annual tax
- $5,220 · $435/mo
- Projected year-2 tax
- $5,220 · $435/mo
- Expected delta
- $0/yr ($0/mo · 0.0%)
ⓘ Screening estimate from a state-policy table — verify with the county assessor before closing.
Climate risk First Street
- Flood 10/10 Extreme FEMA zone AE · 99% chance over 30 yrs
- Wildfire 1/10 Low
- Heat 10/10 Extreme 7 d/yr ≥106°F today · 29 d/yr by 30 yrs out
- Wind 10/10 Extreme 99% chance of damaging wind over 30 yrs
- Air quality 3/10 Moderate 2 unhealthy d/yr today · 2 by 30 yrs out
Nearby sold comps map
Loading sold comps map…
Walkable amenities ~0.75 mi
Loading nearby amenities…
Taxation est. · year 1
- Rental income
- $61,760
- − Mortgage interest
- −$21,840
- − Property taxes
- −$5,220
- − Insurance
- −$7,068
- − Repairs & maintenance
- −$4,941
- − Management
- −$4,941
- − Depreciation
- −$11,343
- Taxable income
- $6,407
- Est. tax owed @ 24.0%
- −$1,538
- After-tax cash flow
- $10,428/yr
For passive investors: Depreciation is non-cash, so a rental often shows a tax loss while cash-flowing — sheltering income. Rental losses are passive: they offset passive income freely, and up to $25,000/yr can offset ordinary (W-2) income if you actively participate and your MAGI is under $100k (phasing out to $0 by $150k); unused losses carry forward. On sale, claimed depreciation is recaptured at up to 25%, and gains may owe capital-gains tax (a 1031 exchange can defer both). Figures are a year-1 estimate at your 24.0% rate — not tax advice; consult a CPA.
Schools (NCES district)
- District
- Manatee
- NCES district ID
- 1201230
- Math proficiency
- 54% ▼ -6.00%
- Reading proficiency
- 50% ▼ -2.00%
- Median HH income
- $49,607
- Composite
- 44.43/100
- National rank
- #2806
- State rank
- #26 of 73 in FL
Livability — Cortez
- Score
- 69/100
- State rank
- #486
- US rank
- #8944
Category grades
Schools grade is shown separately in the Schools card above.
Census & demographics
- Census place
- Cortez, FL
- City population
- 759
- Population (ZIP)
- 759
Population outlook (Manatee County) Hauer SSP2
- Today (2025)
- 447,342 people
- By 2030
- 488,911 · +9.3%
- By 2040
- 567,934 · +27.0%
- By 2050
- 637,995 · +42.6%
- By 2075
- 781,970 · +74.8%
- By 2100
- 848,272 · +89.6%
Race, ethnicity, and origin ACS 2023
- Neighborhood character
- Predominantly White (97%)
- Race & ethnicity
- White 97% Hispanic / Latino 2%
- Common ancestry
- Slovak 11% Romanian 7% German 4%
- Foreign-born
- 18% · Canada, China
Political lean MEDSL · Manatee
- 2024 margin
- Strong R (+23.5) · D 37.9% · R 61.4%
- 2008→2024 swing
- -16.5pp toward R · 2008: -7.0pp · 2024: -23.5pp
- All cycles
- 2024: R+23.5 2020: R+16.1 2016: R+17.1 2012: R+12.5 2008: R+7.0
Not yet ingested
- Civics
- —
Market trends
- HPI YoY
- ▲ 3.23%
- Current HPI
- 281.3803
- Rent YoY
- —
- Metro
- —
- State GDP YoY
- ▲ 3.28%
- F500 in state
- 36
Industry mix (Fortune 500 HQ in FL)
| Industry | F500 HQs | Revenue |
|---|---|---|
| Industrial Technology | 2 | $29B |
|
||
| Insurance | 2 | $17B |
|
||
| Retail | 1 | $60B |
|
||
| Technology Distribution | 1 | $58B |
|
||
| Homebuilding | 1 | $35B |
|
||
| Technology Manufacturing | 1 | $35B |
|
||
Price history
+384.3% since first listed30 events — show timeline
- 2026-05-04 Pending — Stellar MLS as Distributed by MLS Grid
- 2026-04-27 Listed $389,900 Stellar MLS as Distributed by MLS Grid
- 2026-03-11 Listing Removed — Stellar MLS as Distributed by MLS Grid
- 2025-09-15 Relisted — Stellar MLS as Distributed by MLS Grid
- 2025-09-15 Price Changed $499,900 Stellar MLS as Distributed by MLS Grid
- 2025-08-09 Rental Removed $2,999 STELLARMLS
- 2025-07-23 Price Changed $2,999 STELLARMLS
- 2025-07-08 Price Changed $3,400 STELLARMLS
- 2025-07-07 Price Changed $549,900 Stellar MLS as Distributed by MLS Grid
- 2025-06-20 Listed for Rent $3,750 STELLARMLS
- 2025-06-20 Price Changed $3,750 STELLARMLS
- 2025-06-19 Listed $575,000 Stellar MLS as Distributed by MLS Grid
- 2025-01-29 Listing Removed — Stellar MLS as Distributed by MLS Grid
- 2024-12-21 Listed $499,990 Stellar MLS as Distributed by MLS Grid
- 2024-09-23 Listing Removed — Stellar MLS as Distributed by MLS Grid
- 2024-07-24 Price Changed $649,000 Stellar MLS as Distributed by MLS Grid
- 2024-05-22 Price Changed $659,900 Stellar MLS as Distributed by MLS Grid
- 2024-05-01 Price Changed $669,900 Stellar MLS as Distributed by MLS Grid
- 2024-04-18 Price Changed $679,900 Stellar MLS as Distributed by MLS Grid
- 2024-03-08 Listed $689,000 Stellar MLS as Distributed by MLS Grid
- 2024-03-01 Listing Removed — Stellar MLS as Distributed by MLS Grid
- 2023-11-29 Price Changed $699,900 Stellar MLS as Distributed by MLS Grid
- 2023-10-19 Listed $729,900 Stellar MLS as Distributed by MLS Grid
- 2022-07-06 Sold (Public Records) $420,000 Public Records
- 2022-07-01 Sold (MLS) $420,000 Stellar MLS as Distributed by MLS Grid
- 2022-06-08 Pending — Stellar MLS as Distributed by MLS Grid
- 2022-06-03 Relisted — Stellar MLS as Distributed by MLS Grid
- 2022-05-29 Pending — Stellar MLS as Distributed by MLS Grid
- 2022-05-17 Listed $450,000 Stellar MLS as Distributed by MLS Grid
- 1999-05-20 Sold (Public Records) $80,500 Public Records
Property tax history
+11.1%/yrLatest (2024): $5,220 · +11.5% YoY. Source: county tax records.
Cash-flow waterfall
monthlySold comps — $/sqft
last 12 mo · ≤1 miLoading sold comps…