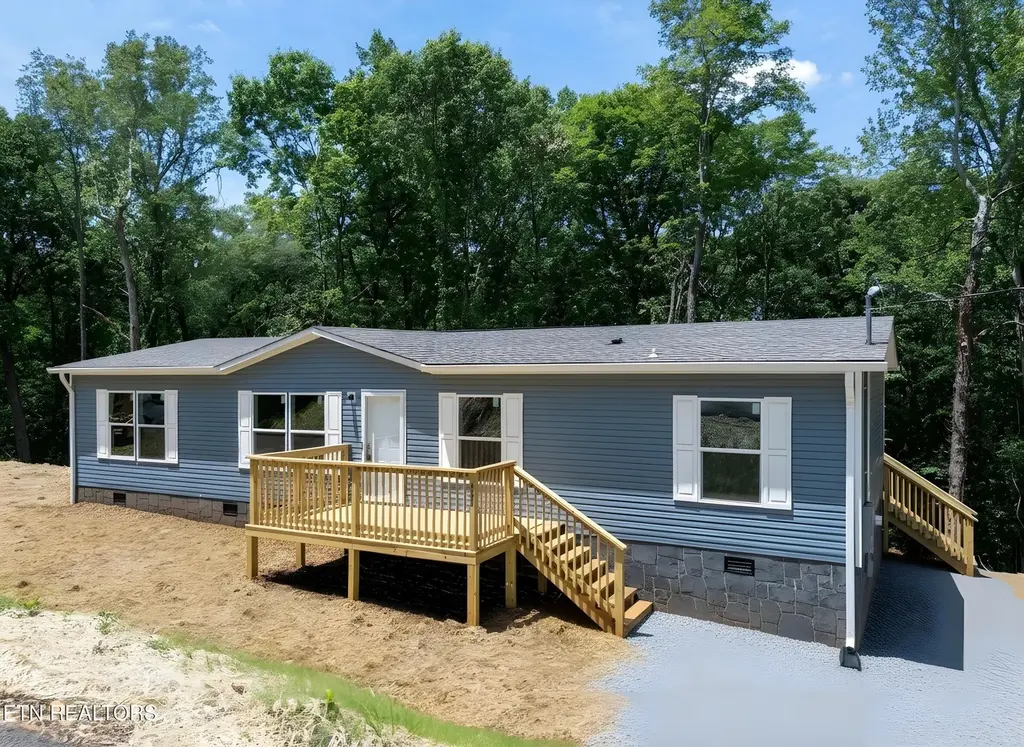
523 Smokey Dr · Loudon, TN
Flood risk 1/10 · Minimal
- FEMA flood zone
- X (unshaded)
- Chance of flooding over 30 yrs
- 0.0%
- Est. flood insurance / yr
- $507 – $1,088
Fire risk 4/10 · Minor
- Est. fire insurance / yr
- $949 – $1,763
Heat risk 5/10 · Moderate
- Hot days now (above 103°F)
- 7 days/yr
- Hot days in 30 yrs
- 20 days/yr
Wind risk 2/10 · Minimal
- Chance of severe wind over 30 yrs
- 1.0%
Air-quality risk 3/10 · Minor
- Unhealthy air days now
- 2 days/yr
- Unhealthy air days in 30 yrs
- 2 days/yr
Risk factors via First Street. Map © Google.
Why this score? — see what drove the C- grade
The composite is a weighted blend of 9 inputs, each scored 0–100. Each bar is that input's sub-score; the figure is the points it added to the 100-point composite (weight × sub-score).
- Cash flow +18.4/30.0
- ARV discount +10.5/15.0
- DSCR +5.8/10.0
- Condition / age +5.0/5.0
- 1% rule +4.9/10.0
- Schools +3.2/10.0
- Livability +3.2/5.0
- Rent growth +2.5/5.0
- Appreciation +0.0/10.0
$250,000
🖨 Deal sheet 📄 Offer letter ✓ Due diligence
Listing remarks
Welcome to your brand new home in the heart of Loudon! This beautifully crafted 4-bedroom, 2-bathroom home offers the perfect blend of modern comfort and everyday convenience. With 1,568 square feet of thoughtfully designed living space this home features an open-concept layout ideal for both relaxing and entertaining. The thoughtfully designed kitchen features ample cabinet space, modern appliances, and a seamless flow into the dining and living areas--perfect for entertaining family and friends. The spacious primary suite provides a private retreat with a luxurious en-suite bath and generous closet space, while three additional bedrooms offer flexibility for family, guests, or a home offi
Key facts
- Modern appliances
- Ample cabinet space
- Private retreat
Tags
Property features AI
Exterior
- Parking: Off-street parking
- Utilities: Public sewer
- Home design: Detached property; 1,568 building area (per plans)
- Construction: Vinyl siding; Other construction materials; Crawl space basement
- Exterior features: Irregular lot; 1 acre lot
Interior
- Kitchen: Dishwasher; Refrigerator
- Flooring: Vinyl flooring
- Bathrooms: 2 full bathrooms
- Heating & cooling: Heat pump heating; Central cooling
- Interior features: 9 total rooms; Dishwasher; Refrigerator
Neighborhood map
What this means for you Summary
Snapshot
- This is a 4-bed/2.0-bath manufactured listed at $250k. Condition is rated excellent.
Deal economics
- At list price, monthly cash flow is $235 ($3k/yr) — positive.
- The deal already cash-flows at list — no discount required.
- To meet the 1% rule (rent ≥ 1% of price), the offer needs to be $248k (0.6% below list).
- Recommended offer: $246k (1.5% below list) — sets the bar for market timing.
- Cap rate 7.4% vs local median 3.2% in Loudon — top-decile yield for the area; either an underpriced asset or a hidden risk that comps aren't pricing in. Stress-test before assuming the spread holds.
Location & tenants
- Location reads 63/100 on livability (#190 in TN) — a middle-class / working-renter tenant base. Strengths: crime A+, cost of living A+, housing A+; Watch: employment D+, schools F, amenities F.
- Loudon County (rural): math 39% / reading 35% proficiency, ranked #18 of 139 in TN (top 13%) — families likely to look elsewhere, expect single-tenant / working-renter base with shorter leases.
- Market conditions: 436 active listings in the ZIP; 1 comparable units currently listed for rent nearby; solid renter incomes; 608 units permitted in Loudon County in 2024 (0 in 5+ unit buildings).
- This rent runs 34% of the median local income ($88k/yr) — at the standard rent-burdened threshold; future hikes will face affordability resistance.
Forward outlook
- Local home prices are declining (-3.0%/yr); year-one equity from $2k of loan paydown is wiped out by about $8k of value loss. Plan a longer hold.
- Loudon County population projected at +17% by 2050 — long-run rental-demand tailwind backs the buy-and-hold thesis.
Negotiation context
- It's been on market 15 days — a 2% lower offer ($246k) is reasonable based on typical stale-listing flexibility.
Risks & watch-outs
- Climate carrying-cost: extreme-heat days projected 7→20/yr by 2055 (HVAC capex compounding) — expect insurance premiums to compound above CPI over the hold.
Questions for the listing agent
- Is there a deadline driving the sale (1031 exchange, divorce, estate, relocation)? That informs how much negotiation room exists.
- Schools are F-rated, which usually means shorter tenancies and higher turnover. Who's the typical renter profile here, and what's been the actual vacancy rate?
- What's the average days-on-market for RENTAL listings here right now (not sales)? A rising rental-DOM trend means longer vacancies and softer asking-rent achievability than the comps imply.
- What's the recent tenant-quality profile in this submarket — average credit score on applications, eviction rate, late-payment / NSF rate, and stable-employment percentage? A property-management company in the area should have these aggregated.
- How much new for-sale + rental construction is in the pipeline within 1–3 miles? Heavy new supply typically softens prices + rents 12–24 months out; constrained supply supports both.
Investment metrics
- 1% rule
- 0.99% ✗
- Cap rate
- 7.42%
- Cash-on-cash
- 4.03%
- DSCR
- 1.18
- GRM
- 8.4
CMA / ARV
- ARV (on-the-fly)
- $268,128
- Comps found
- 5
Show comp detail 5 sales within ~0.75 mi
| Address | Dist | Beds/Ba | Sqft | Sold | Price | $/sf | Match |
|---|---|---|---|---|---|---|---|
| 519 Smokey Dr | 0.06mi | 4/2.0 | 1,493 (-5%) | 1mo | $255,000 | $171 | 89 |
| 517 Smokey Dr | 0.08mi | 4/2.0 | 1,493 (-5%) | 1mo | $248,000 | $166 | 88 |
| 825 Summer St | 0.65mi | 3/2.0 (-1) | 1,568 (0%) | 24mo | $232,000 | $148 | 45 |
| 1201 Main St | 0.47mi | 3/2.5 (-1) | 1,680 (+7%) | 20mo | $395,000 | $235 | 43 |
| 1201 Main St | 0.48mi | 3/2.5 (-1) | 1,680 (+7%) | 20mo | $395,000 | $235 | 42 |
Match score weights: distance 35% · size 25% · config 20% · recency 20%. Top-matched comps best support the ARV.
Projected returns pro-forma
-3.0% appreciation · 3.0% rent growth · sell at horizon
- IRR
- -10.0%
- Equity multiple
- 0.64×
- Total profit
- $-25,514
- Equity at exit
- $37,276
- IRR
- -0.6%
- Equity multiple
- 0.96×
- Total profit
- $-2,803
- Equity at exit
- $21,615
Cash invested: $70,000 (down + closing). Projections, not guarantees.
Landlord ↔ Tenant lean methodology
- Overall (STATE)
- 87 Strongly Landlord-Friendly
- State Tennessee
- 87 Strongly Landlord-Friendly · R+13
- County
- — inherits STATE
- City
- — inherits STATE
ZIP-level market 37774
- Home prices YoY
- -12.8%
- Active inventory
- 436
- Price-to-rent
- 8.4×
Monthly cashflow live
- Estimated rent
- $2,484 medium interval (Pro) →
- Mortgage (P&I)
- −$1,311
- Tax est. 1.5%
- −$312 /mo · $3,750/yr
- Insurance
- −$104
- HOA
- −$0
- Vacancy / Maint / Mgmt
- −$522
- Net cashflow
- $235
Break-even live
UW: 25.0% down · 7.5% · 30yr · 1.5% tax · 5.0% vac · 8.0% maint · 8.0% mgmt
Financing live
Cash to close
- Down payment
- $62,500
- Closing costs
- $7,500
- Reserves months
- —
- Total cash needed
- —
Loan-product check · same deal, 3 products live
Conventional
25% down · 7.5% · 30yr
- Down + closing
- —
- Monthly P&I
- —
- Monthly cashflow
- —
- DSCR
- —
- Eligible?
- —
Personal DTI + credit; lowest rate.
DSCR
20% down · 8.5% · 30yr
- Down + closing
- —
- Monthly P&I
- —
- Monthly cashflow
- —
- DSCR
- —
- Eligible?
- —
No personal income docs; deal must DSCR.
Hard money
10% down · 12.0% · 12mo
- Down + closing
- —
- Monthly P&I
- —
- Monthly cashflow
- —
- DSCR
- —
- Eligible?
- —
Short-term bridge; refi at stabilization.
Rent comps 1 comps
| Address | Beds | Baths | Sqft | Rent | $/sqft | DOM | Units | Dist |
|---|---|---|---|---|---|---|---|---|
| 211 Waller St Loudon, TN | 3.0 | 1.5 | 1686 | $1,600 | $0.95 | 11d | 1 | 0.84mi |
Listing history 11 events
-
2026-06-18days on market $250,000 Active 15 DOM
-
2026-06-17days on market $250,000 Active 14 DOM
-
2026-06-16days on market $250,000 Active 13 DOM
-
2026-06-15days on market $250,000 Active 12 DOM
-
2026-06-14days on market $250,000 Active 10 DOM
-
2026-06-10days on market $250,000 Active 7 DOM
-
2026-06-09days on market $250,000 Active 6 DOM
-
2026-06-08days on market $250,000 Active 5 DOM
-
2026-06-07days on market $250,000 Active 4 DOM
-
2026-06-05remarks 699-char remark
-
2026-06-05$250,000 Active 1 DOM
ⓘ Source: listings_history table (triggers on properties + properties_extension) + one-shot
backfill from property_details.listing_events for pre-trigger history.
Climate risk First Street
- Flood 1/10 Low FEMA zone X (unshaded) · 0% chance over 30 yrs
- Wildfire 4/10 Moderate
- Heat 5/10 Major 7 d/yr ≥103°F today · 20 d/yr by 30 yrs out
- Wind 2/10 Low 100% chance of damaging wind over 30 yrs
- Air quality 3/10 Moderate 2 unhealthy d/yr today · 2 by 30 yrs out
Nearby sold comps map
Loading sold comps map…
Walkable amenities ~0.75 mi
Loading nearby amenities…
Taxation est. · year 1
- Rental income
- $29,811
- − Mortgage interest
- −$14,004
- − Property taxes
- −$3,750
- − Insurance
- −$1,250
- − Repairs & maintenance
- −$2,385
- − Management
- −$2,385
- − Depreciation
- −$7,273
- Taxable loss
- −$1,235
- Est. tax savings @ 24.0%
- +$296
- After-tax cash flow
- $3,115/yr
For passive investors: Depreciation is non-cash, so a rental often shows a tax loss while cash-flowing — sheltering income. Rental losses are passive: they offset passive income freely, and up to $25,000/yr can offset ordinary (W-2) income if you actively participate and your MAGI is under $100k (phasing out to $0 by $150k); unused losses carry forward. On sale, claimed depreciation is recaptured at up to 25%, and gains may owe capital-gains tax (a 1031 exchange can defer both). Figures are a year-1 estimate at your 24.0% rate — not tax advice; consult a CPA.
Condition & rehab AI · 13 photos
This brand new home in Loudon is move-in ready with modern amenities and a spacious layout. It offers a great balance of comfort and convenience, making it an excellent investment.
Value-add opportunities
- Resale Painting the exterior siding — Fresh paint can enhance the curb appeal and make the home look more inviting to potential buyers.
- Rental Landscaping the front yard — A well-maintained front yard can attract more renters and make the home more appealing.
Renovation cost estimate screening
Value-add ROI direction
- Resale Painting the exterior siding — Fresh paint can enhance the curb appeal and make the home look more inviting to potential buyers. ↑
- Rental Landscaping the front yard — A well-maintained front yard can attract more renters and make the home more appealing. ↑
ⓘ Cost ranges are severity-bucket heuristics (US national rule-of-thumb). Get contractor quotes + a written scope before underwriting a rehab budget.
Schools (NCES district)
- District
- Loudon County
- NCES district ID
- 4702520
- Math proficiency
- 39% ▼ -13.00%
- Reading proficiency
- 35% ▼ -4.00%
- Median HH income
- $54,201
- Composite
- 32.43/100
- National rank
- #5724
- State rank
- #18 of 139 in TN
Livability — Loudon
- Score
- 63/100
- State rank
- #190
- US rank
- #15214
Category grades
Schools grade is shown separately in the Schools card above.
Census & demographics
- Census place
- Loudon, TN
- County
- Loudon County · 54,472 people
- City population
- 21,784
- Metro
- Knoxville, TN
- Population (ZIP)
- 21,784
- Household income
- $87,718
- Rent vs Own
- Severe rent burden
- 200.0
Population outlook (Loudon County) Hauer SSP2
- Today (2025)
- 55,364 people
- By 2030
- 57,414 · +3.7%
- By 2040
- 61,216 · +10.6%
- By 2050
- 64,846 · +17.1%
- By 2075
- 75,829 · +37.0%
- By 2100
- 85,693 · +54.8%
Race, ethnicity, and origin ACS 2023
- Neighborhood character
- Predominantly White (87%)
- Race & ethnicity
- White 87% Hispanic / Latino 9% Two or more races 6% Asian 2% Black 1%
- Hispanic origin (detail)
- Mexican 6%
- Common ancestry
- Serbian 3% Romanian 2% Slovak 2%
- Foreign-born
- 7% · Canada
- Languages at home
- 93% English-only · Spanish 6%
Political lean MEDSL · Loudon
- 2024 margin
- Solid R (+53.0) · D 23.0% · R 76.0% · Other 1.1%
- 2008→2024 swing
- -9.0pp toward R · 2008: -44.0pp · 2024: -53.0pp
- All cycles
- 2024: R+53.0 2020: R+50.3 2016: R+54.4 2012: R+52.8 2008: R+44.0
Not yet ingested
- Civics
- —
Market trends
- HPI YoY
- ▼ -47.04%
- Current HPI
- 320.0874
- Rent YoY
- —
- Metro
- Knoxville, TN
- State GDP YoY
- ▲ 2.78%
- F500 in state
- 22
Industry mix (Fortune 500 HQ in TN)
| Industry | F500 HQs | Revenue |
|---|---|---|
| Healthcare | 3 | $91B |
|
||
| Retail | 3 | $72B |
|
||
| Transportation / Logistics | 1 | $88B |
|
||
| Paper / Packaging | 1 | $19B |
|
||
| Insurance | 1 | $13B |
|
||
| Energy | 1 | $12B |
|
||
Price history
1 event — show timeline
- 2026-06-03 Listed $250,000 Knoxville MLS
Cash-flow waterfall
monthlySold comps — $/sqft
last 12 mo · ≤1 miLoading sold comps…