None · Fort Montgomery, NY
Flood risk 1/10 · Minimal
- FEMA flood zone
- X (unshaded)
- Chance of flooding over 30 yrs
- 0.0%
- Est. flood insurance / yr
- $473 – $860
Fire risk 4/10 · Minor
- Est. fire insurance / yr
- $691 – $1,283
Heat risk 5/10 · Moderate
- Hot days now (above 100°F)
- 7 days/yr
- Hot days in 30 yrs
- 17 days/yr
Wind risk 4/10 · Minor
- Chance of severe wind over 30 yrs
- 17.0%
Air-quality risk 3/10 · Minor
- Unhealthy air days now
- 2 days/yr
- Unhealthy air days in 30 yrs
- 3 days/yr
Risk factors via First Street. Map © Google.
Why this score? — see what drove the B+ grade
The composite is a weighted blend of 9 inputs, each scored 0–100. Each bar is that input's sub-score; the figure is the points it added to the 100-point composite (weight × sub-score).
- Cash flow +29.3/30.0
- ARV discount +12.5/15.0
- DSCR +10.0/10.0
- 1% rule +8.7/10.0
- Schools +4.6/10.0
- Appreciation +4.5/10.0
- Livability +3.4/5.0
- Rent growth +2.5/5.0
- Condition / age +2.5/5.0
$549,000
🖨 Deal sheet 📄 Offer letter ✓ Due diligence
Listing remarks
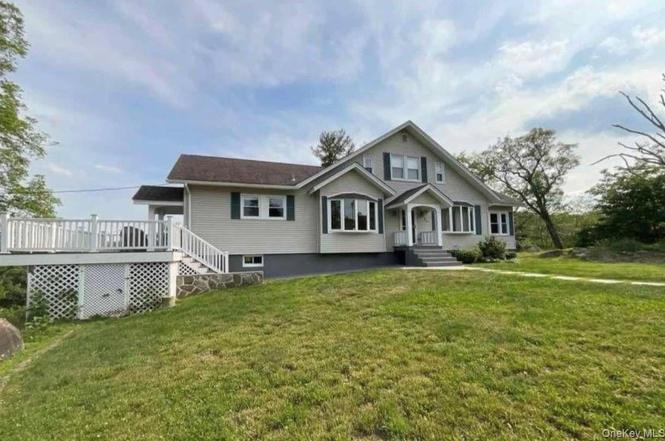
Footsteps to the Hudson River and minutes to Bear Mountain State Park and historic Fort Montgomery! Tucked away at the end of a wooded dead-end street, this 1.5-acre property offers privacy, mountain views, and views of the iconic Bear Mountain Bridge. Excellent commuter location near Route 9W, Palisades Parkway, NYS Thruway, and Peekskill Metro-North. Coming Soon. . On market date 3.3.2026
Key facts
- 0.67 acre lot
- 2 garage spots
- Built 1924
Neighborhood map
What this means for you Summary
Snapshot
- This is a 3-bed/1.5-bath single-family listed at $549k.
Deal economics
- At list price, monthly cash flow is $2k ($23k/yr) — positive.
- The deal already cash-flows at list — no discount required.
- Meets the 1% rule at list price ($8k rent vs $549k).
Location & tenants
- Location reads 68/100 on livability (#531 in NY) — a middle-class / working-renter tenant base. Strengths: crime A+, employment A+, housing A+; Watch: cost of living D, amenities F, commute F.
- Highland Falls Central School District (rural): math 53% / reading 47% proficiency, ranked #328 of 590 in NY (top 56%) — acceptable for families but not a draw, mixed tenant base, ~2y average lease.
- Zoned schools: Fort Montgomery Elementary School (201 students, 52% FRL); Highland Falls Intermediate School (math 32% / reading 47%, grade F, #418 of 729 statewide, top 59%, 324 students, 56% FRL); James I O'Neill High School (math 87% / reading 70%, grade A-, #568 of 1,100 statewide, top 52%, 424 students, 30% FRL).
- Market conditions: 9 active listings in the ZIP; 1 comparable units currently listed for rent nearby; 1,746 units permitted in Orange County in 2024 (1,265 in 5+ unit buildings).
Forward outlook
- Local home prices are declining (-1.1%/yr); year-one equity from $4k of loan paydown is wiped out by about $6k of value loss. Plan a longer hold.
- At projected returns (-1.1% appreciation + 3.0% rent growth), your $154k cash investment doubles in ~6 years — after that, you're playing with house money.
Negotiation context
- Only 1 days on market — expect competitive offers; lowballing is unlikely to land.
- Current owner paid $140k; list at $549k implies a 292% gain — meaningful room to come down on a strong offer.
Risks & watch-outs
- Watch-outs: built in 1924 — expect roof / HVAC / electrical / plumbing capex.
- Climate carrying-cost: extreme-heat days projected 7→17/yr by 2055 (HVAC capex compounding) — expect insurance premiums to compound above CPI over the hold.
Questions for the listing agent
- Built in 1924 — when were the roof, HVAC, electrical panel, plumbing, and water heater last replaced?
- Is there a deadline driving the sale (1031 exchange, divorce, estate, relocation)? That informs how much negotiation room exists.
- Schools are A-rated — typically a magnet for longer-tenancy family renters. What's the average tenant stay here, and is there a school-zone premium baked into asking?
- What's the average days-on-market for RENTAL listings here right now (not sales)? A rising rental-DOM trend means longer vacancies and softer asking-rent achievability than the comps imply.
- What's the recent tenant-quality profile in this submarket — average credit score on applications, eviction rate, late-payment / NSF rate, and stable-employment percentage? A property-management company in the area should have these aggregated.
- How much new for-sale + rental construction is in the pipeline within 1–3 miles? Heavy new supply typically softens prices + rents 12–24 months out; constrained supply supports both.
Investment metrics
- 1% rule
- 1.37% ✓
- Cap rate
- 10.51%
- Cash-on-cash
- 15.08%
- DSCR
- 1.67
- GRM
- 6.1
CMA / ARV
- ARV (on-the-fly)
- $617,520
- Comps found
- 5
Show comp detail 5 sales within ~0.75 mi
| Address | Dist | Beds/Ba | Sqft | Sold | Price | $/sf | Match |
|---|---|---|---|---|---|---|---|
| 22 Fawnwood Ln | 0.58mi | 4/2.5 (+1) | 2,273 (-8%) | 8mo | $670,000 | $295 | 44 |
| 15 Overlook Pl | 0.75mi | 3/2.0 | 2,656 (+7%) | 12mo | $590,000 | $222 | 41 |
| 57 Corbin Hill Rd | 0.44mi | 4/2.5 (+1) | 2,726 (+10%) | 23mo | $680,000 | $249 | 35 |
| 21 Wayne Ave | 0.53mi | 2/2.5 (-1) | 2,156 (-13%) | 17mo | $800,000 | $371 | 30 |
| 2 Overlook Pl | 0.69mi | 4/2.0 (+1) | 2,184 (-12%) | 15mo | $519,000 | $238 | 28 |
Match score weights: distance 35% · size 25% · config 20% · recency 20%. Top-matched comps best support the ARV.
Projected returns pro-forma
-1.08% appreciation · 3.0% rent growth · sell at horizon
- IRR
- 11.6%
- Equity multiple
- 1.52×
- Total profit
- $80,003
- Equity at exit
- $130,503
- IRR
- 17.8%
- Equity multiple
- 2.77×
- Total profit
- $271,776
- Equity at exit
- $135,324
Cash invested: $153,720 (down + closing). Projections, not guarantees.
Landlord ↔ Tenant lean methodology
- Overall (STATE)
- 15 Strongly Tenant-Friendly
- State New York
- 15 Strongly Tenant-Friendly · D+10
- County
- — inherits STATE
- City
- — inherits STATE
ZIP-level market 10922
- Home prices YoY
- -0.4%
- Active inventory
- 9
- Price-to-rent
- 6.1×
Monthly cashflow live
- Estimated rent
- $7,500 medium interval (Pro) →
- Mortgage (P&I)
- −$2,879
- Tax from tax record
- −$886 /mo · $10,632/yr
- Insurance
- −$229
- HOA
- −$0
- Vacancy / Maint / Mgmt
- −$1,575
- Net cashflow
- $1,931
Break-even live
UW: 25.0% down · 7.5% · 30yr · 1.5% tax · 5.0% vac · 8.0% maint · 8.0% mgmt
Financing live
Cash to close
- Down payment
- $137,250
- Closing costs
- $16,470
- Reserves months
- —
- Total cash needed
- —
Loan-product check · same deal, 3 products live
Conventional
25% down · 7.5% · 30yr
- Down + closing
- —
- Monthly P&I
- —
- Monthly cashflow
- —
- DSCR
- —
- Eligible?
- —
Personal DTI + credit; lowest rate.
DSCR
20% down · 8.5% · 30yr
- Down + closing
- —
- Monthly P&I
- —
- Monthly cashflow
- —
- DSCR
- —
- Eligible?
- —
No personal income docs; deal must DSCR.
Hard money
10% down · 12.0% · 12mo
- Down + closing
- —
- Monthly P&I
- —
- Monthly cashflow
- —
- DSCR
- —
- Eligible?
- —
Short-term bridge; refi at stabilization.
Rent comps 1 comps
| Address | Beds | Baths | Sqft | Rent | $/sqft | DOM | Units | Dist |
|---|---|---|---|---|---|---|---|---|
| 12 Hudson River Ln Garrison, NY | 3.0 | 2.5 | 1881 | $7,500 | $3.99 | 13d | 1 | 0.86mi |
Listing history 5 events
-
2026-03-24status Pending
-
2026-03-23status Active
-
2026-03-09status Active
-
2026-02-20historical $549,000
-
2017-04-27soldstatus $140,000
ⓘ Source: listings_history table (triggers on properties + properties_extension) + one-shot
backfill from property_details.listing_events for pre-trigger history.
Tax reassessment forecast NY · Partial reset (capped growth)
- Current annual tax
- $10,632 · $886/mo
- Projected year-2 tax
- $10,632 · $886/mo
- Expected delta
- $0/yr ($0/mo · -0.0%)
ⓘ Screening estimate from a state-policy table — verify with the county assessor before closing.
Climate risk First Street
- Flood 1/10 Low FEMA zone X (unshaded) · 0% chance over 30 yrs
- Wildfire 4/10 Moderate
- Heat 5/10 Major 7 d/yr ≥100°F today · 17 d/yr by 30 yrs out
- Wind 4/10 Moderate 17% chance of damaging wind over 30 yrs
- Air quality 3/10 Moderate 2 unhealthy d/yr today · 3 by 30 yrs out
Nearby sold comps map
Loading sold comps map…
Walkable amenities ~0.75 mi
Loading nearby amenities…
Taxation est. · year 1
- Rental income
- $90,000
- − Mortgage interest
- −$30,753
- − Property taxes
- −$10,632
- − Insurance
- −$2,745
- − Repairs & maintenance
- −$7,200
- − Management
- −$7,200
- − Depreciation
- −$15,971
- Taxable income
- $15,500
- Est. tax owed @ 24.0%
- −$3,720
- After-tax cash flow
- $19,455/yr
For passive investors: Depreciation is non-cash, so a rental often shows a tax loss while cash-flowing — sheltering income. Rental losses are passive: they offset passive income freely, and up to $25,000/yr can offset ordinary (W-2) income if you actively participate and your MAGI is under $100k (phasing out to $0 by $150k); unused losses carry forward. On sale, claimed depreciation is recaptured at up to 25%, and gains may owe capital-gains tax (a 1031 exchange can defer both). Figures are a year-1 estimate at your 24.0% rate — not tax advice; consult a CPA.
Schools (NCES district)
- District
- Highland Falls Central School District
- NCES district ID
- 3614430
- Math proficiency
- 53% ▼ -2.00%
- Reading proficiency
- 47% ▼ -6.00%
- Median HH income
- $79,944
- Composite
- 45.68/100
- National rank
- #2577
- State rank
- #328 of 590 in NY
Livability — Fort Montgomery
- Score
- 68/100
- State rank
- #531
- US rank
- #9569
Category grades
Schools grade is shown separately in the Schools card above.
Census & demographics
- Census place
- Fort Montgomery, NY
- Population (ZIP)
- 1,072
Population outlook (Orange County) Hauer SSP2
- Today (2025)
- 379,830 people
- By 2030
- 378,955 · -0.2%
- By 2040
- 375,444 · -1.2%
- By 2050
- 369,311 · -2.8%
- By 2075
- 354,233 · -6.7%
- By 2100
- 318,150 · -16.2%
Race, ethnicity, and origin ACS 2023
- Neighborhood character
- Predominantly White (74%)
- Race & ethnicity
- White 74% Hispanic / Latino 11% Black 11% Two or more races 6% Native American 4% Asian 3%
- Hispanic origin (detail)
- Mexican 3% Puerto Rican 4%
- Common ancestry
- Iranian 3% Romanian 2% Scotch-Irish 1%
- Foreign-born
- 12% · Canada
- Languages at home
- 92% English-only · Spanish 6% Russian/Polish/Slavic 1% Other Asian/Pacific 1%
Political lean MEDSL · Orange
- 2024 margin
- Lean R (+8.4) · D 45.8% · R 54.2%
- 2008→2024 swing
- -12.5pp toward R · 2008: 4.1pp · 2024: -8.4pp
- All cycles
- 2024: R+8.4 2020: R+0.2 2016: R+6.5 2012: D+5.2 2008: D+4.1
Not yet ingested
- Civics
- —
Market trends
- HPI YoY
- ▼ -1.08%
- Current HPI
- 289.0685
- Rent YoY
- —
- Metro
- —
- State GDP YoY
- ▲ 2.60%
- F500 in state
- 92
Industry mix (Fortune 500 HQ in NY)
| Industry | F500 HQs | Revenue |
|---|---|---|
| Financial Services | 10 | $950B |
|
||
| Consumer Goods | 9 | $162B |
|
||
| Insurance | 4 | $225B |
|
||
| Telecommunications | 2 | $144B |
|
||
| Pharmaceuticals | 2 | $112B |
|
||
| Media / Entertainment | 2 | $69B |
|
||
Price history
+292.1% since first listed5 events — show timeline
- 2026-03-24 Pending — OneKey® MLS as Distributed by MLS Grid
- 2026-03-23 Relisted — OneKey® MLS as Distributed by MLS Grid
- 2026-03-09 Relisted — OneKey® MLS as Distributed by MLS Grid
- 2026-02-20 Coming Soon $549,000 OneKey® MLS as Distributed by MLS Grid
- 2017-04-27 Sold (Public Records) $140,000 Public Records
Property tax history
+2.6%/yrLatest (2025): $10,632 · +1.3% YoY. Source: county tax records.
Cash-flow waterfall
monthlySold comps — $/sqft
last 12 mo · ≤1 miLoading sold comps…