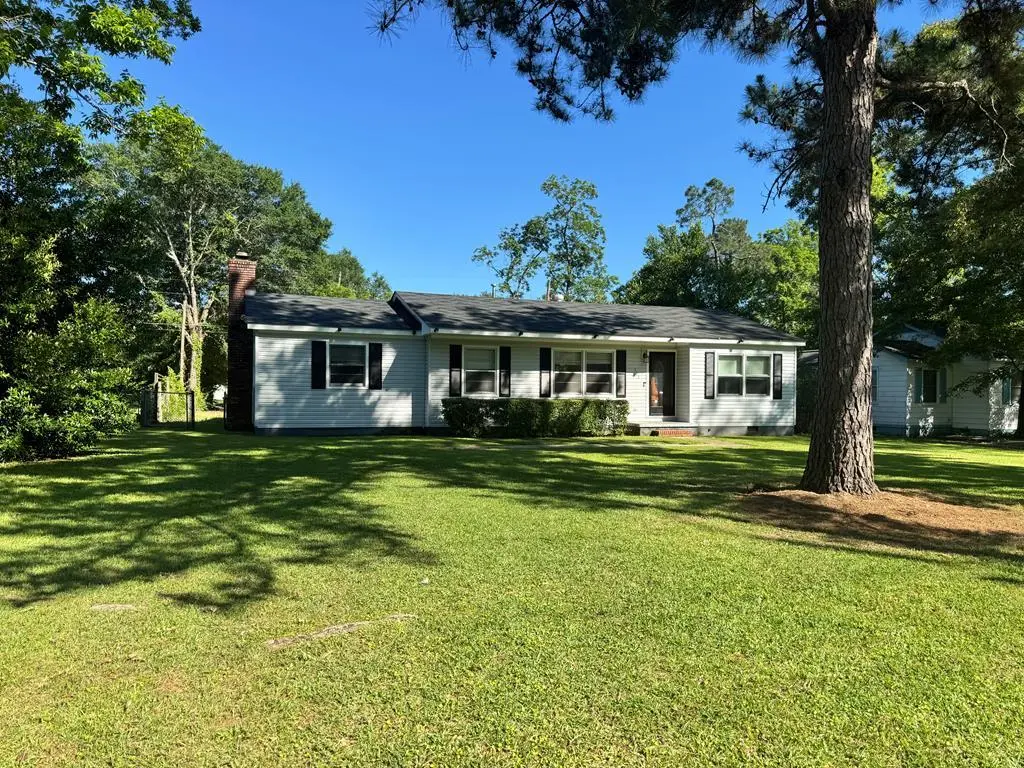
306 Ingleside Drive Dr S · Albany, GA
Flood risk 1/10 · Minimal
- FEMA flood zone
- X (unshaded)
- Chance of flooding over 30 yrs
- 0.0%
- Est. flood insurance / yr
- $507 – $1,088
Fire risk 4/10 · Minor
- Est. fire insurance / yr
- $963 – $1,789
Heat risk 8/10 · Major
- Hot days now (above 109°F)
- 7 days/yr
- Hot days in 30 yrs
- 18 days/yr
Wind risk 8/10 · Major
- Chance of severe wind over 30 yrs
- 98.0%
Air-quality risk 3/10 · Minor
- Unhealthy air days now
- 4 days/yr
- Unhealthy air days in 30 yrs
- 4 days/yr
Risk factors via First Street. Map © Google.
Why this score? — see what drove the D+ grade
The composite is a weighted blend of 9 inputs, each scored 0–100. Each bar is that input's sub-score; the figure is the points it added to the 100-point composite (weight × sub-score).
- Cash flow +24.2/30.0
- DSCR +7.8/10.0
- 1% rule +5.7/10.0
- Rent growth +4.8/5.0
- Livability +3.0/5.0
- Condition / age +2.5/5.0
- Schools +1.1/10.0
- ARV discount +0.0/15.0
- Appreciation +0.0/10.0
$109,900
🖨 Deal sheet 📄 Offer letter ✓ Due diligence
Listing remarks
Buyers this one is just for you whether it is your FIRST HOME or your RETIREMENT HOME. .. .. .3 bedrooms with the original Hardwood floors. 1 BATH THAT is updated. Kitchen has been updated and includes Refrigerator Stove and Dishwasher. Huge den and seperate Living room. Put this one on your list to see today.
Key facts
- 0.33 acre lot
- Built 1954
- Listed 31 days
Property features AI
Exterior
- Utilities: Sewer connected
- Home design: Single-family detached residence; Single story
- Construction: Shingle roof
- Exterior features: Covered patio/porch
Interior
- Kitchen: Dishwasher; Refrigerator; Electric cooktop; Electric oven
- Flooring: Hardwood
- Bathrooms: 1 full bathroom
- Heating & cooling: Central heating (natural gas); Ceiling fan(s)
- Interior features: Pantry
- Laundry & utility: Electric water heater
Neighborhood map
What this means for you Summary
Snapshot
- This is a 3-bed/2.0-bath single-family listed at $110k.
Deal economics
- At list price, monthly cash flow is $219 ($3k/yr) — positive.
- The deal already cash-flows at list — no discount required.
- Meets the 1% rule at list price ($1k rent vs $110k).
- Recommended offer: $107k (3.0% below list) — sets the bar for market timing.
- Cap rate 8.7% vs local median 4.7% in Albany — top-decile yield for the area; either an underpriced asset or a hidden risk that comps aren't pricing in. Stress-test before assuming the spread holds.
Location & tenants
- Location reads 60/100 on livability (#371 in GA) — a middle-class / working-renter tenant base. Strengths: cost of living A+, housing A-, health & safety B+; Watch: schools F, crime F, amenities F.
- Dougherty County (urban): math 12% / reading 16% proficiency, ranked #163 of 174 in GA (top 94%) — low school quality limits family demand, transient renter base, plan for 1-2y turnover; 79% free/reduced lunch — lower-income household profile, screen leases tightly.
- Market conditions: Rents rising fast (+9.4%/yr); 184 active listings in the ZIP; 10 comparable units currently listed for rent nearby; rentals at typical pace (median 21d on market — plan ~3-4 weeks tenant-placement turnaround); 45 units permitted in Dougherty County in 2024 (20 in 5+ unit buildings).
Forward outlook
- Local home prices are declining (-3.0%/yr); year-one equity from $760 of loan paydown is wiped out by about $3k of value loss. Plan a longer hold.
- Dougherty County population projected at -24% by 2050 — secular population decline; favor cash flow + early exit over multi-decade hold.
- At projected returns (-3.0% appreciation + 8.0% rent growth), your $31k cash investment doubles in ~8 years — after that, you're playing with house money.
Negotiation context
- It's been on market 32 days — a 3% lower offer ($107k) is reasonable based on typical stale-listing flexibility.
Risks & watch-outs
- Watch-outs: built in 1954 — expect roof / HVAC / electrical / plumbing capex.
- Climate carrying-cost: severe wind risk, 98% chance of damaging wind over 30y; extreme-heat days projected 7→18/yr by 2055 (HVAC capex compounding) — expect insurance premiums to compound above CPI over the hold.
Questions for the listing agent
- It's been on market 32 days. Have you received any prior offers? Is the seller open to a 3% concession, seller financing, or rate buy-down credit?
- Built in 1954 — when were the roof, HVAC, electrical panel, plumbing, and water heater last replaced?
- Is there a deadline driving the sale (1031 exchange, divorce, estate, relocation)? That informs how much negotiation room exists.
- Schools are F-rated, which usually means shorter tenancies and higher turnover. Who's the typical renter profile here, and what's been the actual vacancy rate?
- Crime grade is F in this area — have there been break-ins, vandalism, or insurance claims at this property in the last 3 years? What carrier currently insures it and at what premium?
- The area grade is low — what's the realistic commute time and amenity access for the typical tenant pool here? Any planned neighborhood developments (good or bad) we should know about?
- What's the average days-on-market for RENTAL listings here right now (not sales)? A rising rental-DOM trend means longer vacancies and softer asking-rent achievability than the comps imply.
- What's the recent tenant-quality profile in this submarket — average credit score on applications, eviction rate, late-payment / NSF rate, and stable-employment percentage? A property-management company in the area should have these aggregated.
- How much new for-sale + rental construction is in the pipeline within 1–3 miles? Heavy new supply typically softens prices + rents 12–24 months out; constrained supply supports both.
Investment metrics
- 1% rule
- 1.07% ✓
- Cap rate
- 8.68%
- Cash-on-cash
- 8.53%
- DSCR
- 1.38
- GRM
- 7.8
CMA / ARV
- ARV (on-the-fly)
- $78,416
- Comps found
- 3
Show comp detail 3 sales within ~0.75 mi
| Address | Dist | Beds/Ba | Sqft | Sold | Price | $/sf | Match |
|---|---|---|---|---|---|---|---|
| 1910 W Oglethorpe Ave | 0.23mi | 3/2.0 | 1,426 (+6%) | 11mo | $145,000 | $102 | 71 |
| 1812 W Broad Ave | 0.41mi | 3/1.0 | 1,406 (+4%) | 11mo | $75,000 | $53 | 61 |
| 2017 Jones Ave | 0.56mi | 3/2.0 | 1,428 (+6%) | 14mo | $83,063 | $58 | 53 |
Match score weights: distance 35% · size 25% · config 20% · recency 20%. Top-matched comps best support the ARV.
Projected returns pro-forma
-3.0% appreciation · 8.0% rent growth · sell at horizon
- IRR
- 1.9%
- Equity multiple
- 1.08×
- Total profit
- $2,318
- Equity at exit
- $16,386
- IRR
- 15.7%
- Equity multiple
- 2.56×
- Total profit
- $48,137
- Equity at exit
- $9,502
Cash invested: $30,772 (down + closing). Projections, not guarantees.
Landlord ↔ Tenant lean methodology
- Overall (STATE)
- 90 Strongly Landlord-Friendly
- State Georgia
- 90 Strongly Landlord-Friendly · R+3
- County
- — inherits STATE
- City
- — inherits STATE
ZIP-level market 31707
- Rents YoY
- 9.4%
- Active inventory
- 184
- Price-to-rent
- 7.8×
Monthly cashflow live
- Estimated rent
- $1,174 high interval (Pro) →
- Mortgage (P&I)
- −$576
- Tax from tax record
- −$86 /mo · $1,033/yr
- Insurance
- −$46
- HOA
- −$0
- Vacancy / Maint / Mgmt
- −$246
- Net cashflow
- $219
Break-even live
UW: 25.0% down · 7.5% · 30yr · 1.5% tax · 5.0% vac · 8.0% maint · 8.0% mgmt
Financing live
Cash to close
- Down payment
- $27,475
- Closing costs
- $3,297
- Reserves months
- —
- Total cash needed
- —
Loan-product check · same deal, 3 products live
Conventional
25% down · 7.5% · 30yr
- Down + closing
- —
- Monthly P&I
- —
- Monthly cashflow
- —
- DSCR
- —
- Eligible?
- —
Personal DTI + credit; lowest rate.
DSCR
20% down · 8.5% · 30yr
- Down + closing
- —
- Monthly P&I
- —
- Monthly cashflow
- —
- DSCR
- —
- Eligible?
- —
No personal income docs; deal must DSCR.
Hard money
10% down · 12.0% · 12mo
- Down + closing
- —
- Monthly P&I
- —
- Monthly cashflow
- —
- DSCR
- —
- Eligible?
- —
Short-term bridge; refi at stabilization.
Rent comps 10 comps
| Address | Beds | Baths | Sqft | Rent | $/sqft | DOM | Units | Dist |
|---|---|---|---|---|---|---|---|---|
| 410 Endicott Ln Albany, GA | 3.0 | 2.0 | 1080 | $1,295 | $1.20 | 21d | 1 | 0.25mi |
| 2380 Meadowlark Commons Ct Albany, GA | 2.0 | 2.0 | 1146 | $800 | $0.70 | 21d | 1 | 0.82mi |
| 1502 Gillespie Ave Albany, GA | 3.0 | 1.0 | 1104 | $875 | $0.79 | 21d | 1 | 0.86mi |
| 427 Meadowlark Dr Albany, GA | 3.0 | 2.0 | 1764 | $1,895 | $1.07 | 21d | 1 | 1.20mi |
| 1312 Colquitt Ave Albany, GA | 3.0 | 1.0 | 1133 | $900 | $0.79 | 21d | 1 | 1.21mi |
| 612 Florence Dr Albany, GA | 3.0 | 1.0 | 1428 | $1,200 | $0.84 | 21d | 1 | 1.24mi |
| 1906 Robinhood Rd Albany, GA | 3.0 | 2.0 | 1845 | $1,600 | $0.87 | 21d | 1 | 1.31mi |
| 419 S Westover Blvd Albany, GA | 1.0–3.0 | 1.0–2.0 | 1025 | $1,032 | $1.01 | 21d | 1 | 1.39mi |
| 1308 Maryland Dr Albany, GA | 2.0 | 1.0 | 988 | $750 | $0.76 | 21d | 1 | 1.45mi |
| 421 S Westover Blvd Albany, GA | 1.0–3.0 | 1.0–2.0 | 1011 | $1,033 | $1.02 | 21d | 1 | 1.48mi |
Listing history 17 events
-
2026-06-19days on market $109,900 Active 32 DOM
-
2026-06-18days on market $109,900 Active 31 DOM
-
2026-06-17days on market $109,900 Active 30 DOM
-
2026-06-16days on market $109,900 Active 29 DOM
-
2026-06-15days on market $109,900 Active 28 DOM
-
2026-06-14days on market $109,900 Active 26 DOM
-
2026-06-13days on market $109,900 Active 25 DOM
-
2026-06-10days on market $109,900 Active 23 DOM
-
2026-06-09days on market $109,900 Active 22 DOM
-
2026-06-08days on market $109,900 Active 21 DOM
-
2026-06-07days on market $109,900 Active 20 DOM
-
2026-06-05days on market $109,900 Active 17 DOM
-
2026-06-02days on market $109,900 Active 15 DOM
-
2026-06-01days on market $109,900 Active 14 DOM
-
2026-05-31days on market $109,900 Active 13 DOM
-
2026-05-30days on market $109,900 Active 12 DOM
-
2026-05-18$109,900 Active
ⓘ Source: listings_history table (triggers on properties + properties_extension) + one-shot
backfill from property_details.listing_events for pre-trigger history.
Tax reassessment forecast GA · Resets to sale price
- Current annual tax
- $1,033 · $86/mo
- Projected year-2 tax
- $1,033 · $86/mo
- Expected delta
- $0/yr ($0/mo · 0.0%)
ⓘ Screening estimate from a state-policy table — verify with the county assessor before closing.
Climate risk First Street
- Flood 1/10 Low FEMA zone X (unshaded) · 0% chance over 30 yrs
- Wildfire 4/10 Moderate
- Heat 8/10 Severe 7 d/yr ≥109°F today · 18 d/yr by 30 yrs out
- Wind 8/10 Severe 98% chance of damaging wind over 30 yrs
- Air quality 3/10 Moderate 4 unhealthy d/yr today · 4 by 30 yrs out
Nearby sold comps map
Loading sold comps map…
Walkable amenities ~0.75 mi
Loading nearby amenities…
Taxation est. · year 1
- Rental income
- $14,082
- − Mortgage interest
- −$6,156
- − Property taxes
- −$1,033
- − Insurance
- −$550
- − Repairs & maintenance
- −$1,127
- − Management
- −$1,127
- − Depreciation
- −$3,197
- Taxable income
- $893
- Est. tax owed @ 24.0%
- −$214
- After-tax cash flow
- $2,412/yr
For passive investors: Depreciation is non-cash, so a rental often shows a tax loss while cash-flowing — sheltering income. Rental losses are passive: they offset passive income freely, and up to $25,000/yr can offset ordinary (W-2) income if you actively participate and your MAGI is under $100k (phasing out to $0 by $150k); unused losses carry forward. On sale, claimed depreciation is recaptured at up to 25%, and gains may owe capital-gains tax (a 1031 exchange can defer both). Figures are a year-1 estimate at your 24.0% rate — not tax advice; consult a CPA.
Schools (NCES district)
- District
- Dougherty County
- NCES district ID
- 1301830
- Math proficiency
- 12% ▼ -15.00%
- Reading proficiency
- 16% ▼ -9.00%
- Median HH income
- $33,105
- Composite
- 11.31/100
- National rank
- #9716
- State rank
- #163 of 174 in GA
Livability — Albany
- Score
- 60/100
- State rank
- #371
- US rank
- #18903
Category grades
Schools grade is shown separately in the Schools card above.
Census & demographics
- Census place
- Albany, GA
- County
- Dougherty County · 89,040 people
- City population
- 89,040
- Metro
- Albany, GA
- Population (ZIP)
- 22,679
- Household income
- $50,862
- Rent vs Own
- Severe rent burden
- 1572.0
Population outlook (Dougherty County) Hauer SSP2
- Today (2025)
- 84,551 people
- By 2030
- 80,637 · -4.6%
- By 2040
- 72,090 · -14.7%
- By 2050
- 64,056 · -24.2%
- By 2075
- 46,332 · -45.2%
- By 2100
- 33,127 · -60.8%
Race, ethnicity, and origin ACS 2023
- Neighborhood character
- Majority Black (63%)
- Race & ethnicity
- Black 63% White 31% Two or more races 3% Hispanic / Latino 3% Asian 1%
- Common ancestry
- Serbian 1% Iranian 1% Slovak 1%
- Foreign-born
- 2% · Canada
- Languages at home
- 96% English-only · Spanish 2% Other Indo-European 1%
Political lean MEDSL · Dougherty
- 2024 margin
- Solid D (+41.1) · D 70.4% · R 29.3%
- 2008→2024 swing
- +6.2pp toward D · 2008: 35.0pp · 2024: 41.1pp
- All cycles
- 2024: D+41.1 2020: D+40.0 2016: D+38.3 2012: D+39.0 2008: D+35.0
Not yet ingested
- Civics
- —
Market trends
- HPI YoY
- ▼ -130.86%
- Current HPI
- 173.4443
- Rent YoY
- ▲ 9.39%
- Metro
- Albany, GA
- State GDP YoY
- ▲ 2.66%
- F500 in state
- 28
Industry mix (Fortune 500 HQ in GA)
| Industry | F500 HQs | Revenue |
|---|---|---|
| Paper / Packaging | 2 | $29B |
|
||
| Retail | 1 | $160B |
|
||
| Transportation / Logistics | 1 | $91B |
|
||
| Airlines | 1 | $62B |
|
||
| Consumer Goods | 1 | $47B |
|
||
| Utilities | 1 | $25B |
|
||
Price history
1 event — show timeline
- 2026-05-18 Listed $109,900 SWGABOR
Property tax history
+0.9%/yrLatest (2025): $1,033 · +7.1% YoY. Source: county tax records.
Cash-flow waterfall
monthlySold comps — $/sqft
last 12 mo · ≤1 miLoading sold comps…