5304 W 48 Rd · Henderson, MI
Flood risk 1/10 · Minimal
- FEMA flood zone
- —
- Chance of flooding over 30 yrs
- 0.0%
- Est. flood insurance / yr
- —
Fire risk 3/10 · Minor
- Est. fire insurance / yr
- $784 – $1,456
Heat risk 1/10 · Minimal
- Hot days now (above 93°F)
- 7 days/yr
- Hot days in 30 yrs
- 14 days/yr
Wind risk 1/10 · Minimal
- Chance of severe wind over 30 yrs
- —
Air-quality risk 2/10 · Minimal
- Unhealthy air days now
- 1 days/yr
- Unhealthy air days in 30 yrs
- 2 days/yr
Risk factors via First Street. Map © Google.
Why this score? — see what drove the D grade
The composite is a weighted blend of 9 inputs, each scored 0–100. Each bar is that input's sub-score; the figure is the points it added to the 100-point composite (weight × sub-score).
- Cash flow +14.2/30.0
- ARV discount +7.5/15.0
- DSCR +4.3/10.0
- Schools +4.1/10.0
- 1% rule +3.4/10.0
- Livability +3.2/5.0
- Rent growth +2.5/5.0
- Condition / age +2.5/5.0
- Appreciation +0.0/10.0
$187,400
🖨 Deal sheet 📄 Offer letter ✓ Due diligence
Listing remarks MLS
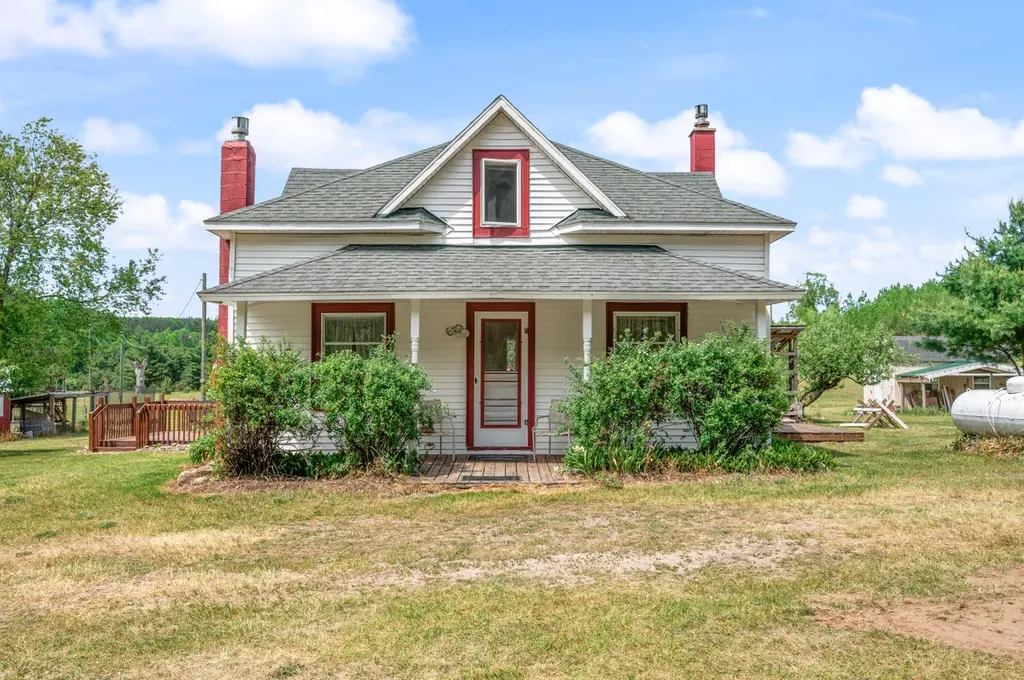
What a location! This 10 acres of rolling hills and woods puts you minutes from Caberfae, commutable to both Manistee and Cadillac, and in the heart of the Manistee National Forest! Over 100,000 acres of endless recreational opportunity starts right across the street. The farmhouse is sturdy, and ready to serve as a year round residence. Multiple outbuildings offer excellent value and potential, including a large garage that is completely finished, and has it's own 220 power. Wildlife enjoy the property like it is theirs, and sturdy outbuildings will make setting up your hobby farm more affordable! Some of the best skiing, snowmobiling, and ATV riding in lower Michigan is at your fingertips. This one won't last, set up your tour today!
Key facts
- Large garage
- Rolling hills
- 10 acres
Tags
Property features AI
Exterior
- Parking: Detached garage; 4-car garage
- Utilities: Well water source
- Home design: Single-family residence; Residential property; Built in 1904
- Construction: Vinyl siding; Shingle roof
- Exterior features: Approximately 9.94-acre lot; Well water
Interior
- Bathrooms: 1 full bathroom
- Heating & cooling: Forced air heating
- Interior features: Total of 10 rooms; Michigan-style basement
Neighborhood map
What this means for you Summary
Snapshot
- This is a 4-bed/1.0-bath single-family listed at $187k.
Deal economics
- At list price, monthly cash flow is $32 ($381/yr) — positive.
- The deal already cash-flows at list — no discount required.
- To meet the 1% rule (rent ≥ 1% of price), the offer needs to be $157k (16.4% below list).
- Recommended offer: $157k (16.4% below list) — sets the bar for 1% rule.
Location & tenants
- Location reads 65/100 on livability (#473 in MI) — a middle-class / working-renter tenant base. Strengths: cost of living A+, housing A+; Watch: schools D-, amenities F, commute F.
- Cadillac Area Public Schools (town): math 45% / reading 53% proficiency, ranked #120 of 540 in MI (top 22%) — families likely to look elsewhere, expect single-tenant / working-renter base with shorter leases.
- Market conditions: 218 active listings in the ZIP; 130 units permitted in Wexford County in 2024 (50 in 5+ unit buildings).
Forward outlook
- Local home prices are declining (-3.0%/yr); year-one equity from $1k of loan paydown is wiped out by about $6k of value loss. Plan a longer hold.
- Wexford County population projected at -15% by 2050 — secular population decline; favor cash flow + early exit over multi-decade hold.
Negotiation context
- Only 13 days on market — expect competitive offers; lowballing is unlikely to land.
- 3 sale attempts with the ask held roughly flat each time — persistent listings suggest the price (not the market) is what's stuck; bring a comps-based counter.
- Current owner paid $90k; list at $187k implies a 108% gain — meaningful room to come down on a strong offer.
Risks & watch-outs
- Watch-outs: built in 1904 — expect roof / HVAC / electrical / plumbing capex.
Questions for the listing agent
- Built in 1904 — when were the roof, HVAC, electrical panel, plumbing, and water heater last replaced?
- Is there a deadline driving the sale (1031 exchange, divorce, estate, relocation)? That informs how much negotiation room exists.
- Schools are D-rated, which usually means shorter tenancies and higher turnover. Who's the typical renter profile here, and what's been the actual vacancy rate?
- The area grade is low — what's the realistic commute time and amenity access for the typical tenant pool here? Any planned neighborhood developments (good or bad) we should know about?
- What's the average days-on-market for RENTAL listings here right now (not sales)? A rising rental-DOM trend means longer vacancies and softer asking-rent achievability than the comps imply.
- What's the recent tenant-quality profile in this submarket — average credit score on applications, eviction rate, late-payment / NSF rate, and stable-employment percentage? A property-management company in the area should have these aggregated.
- How much new for-sale + rental construction is in the pipeline within 1–3 miles? Heavy new supply typically softens prices + rents 12–24 months out; constrained supply supports both.
Investment metrics
- 1% rule
- 0.84% ✗
- Cap rate
- 6.50%
- Cash-on-cash
- 0.73%
- DSCR
- 1.03
- GRM
- 10.0
CMA / ARV
No comps found within radius.
Projected returns pro-forma
-3.0% appreciation · 3.0% rent growth · sell at horizon
- IRR
- -15.2%
- Equity multiple
- 0.46×
- Total profit
- $-28,376
- Equity at exit
- $27,942
- IRR
- -6.6%
- Equity multiple
- 0.58×
- Total profit
- $-22,231
- Equity at exit
- $16,203
Cash invested: $52,472 (down + closing). Projections, not guarantees.
Landlord ↔ Tenant lean methodology
- Overall (STATE)
- 62 Landlord-Friendly
- State Michigan
- 62 Landlord-Friendly · EVEN
- County
- — inherits STATE
- City
- — inherits STATE
ZIP-level market 49601
- Home prices YoY
- -19.9%
- Active inventory
- 218
- Price-to-rent
- 10.0×
Monthly cashflow live
- Estimated rent
- $1,568 medium interval (Pro) →
- Mortgage (P&I)
- −$983
- Tax from tax record
- −$146 /mo · $1,749/yr
- Insurance
- −$78
- HOA
- −$0
- Vacancy / Maint / Mgmt
- −$329
- Net cashflow
- $32
Break-even live
UW: 25.0% down · 7.5% · 30yr · 1.5% tax · 5.0% vac · 8.0% maint · 8.0% mgmt
Financing live
Cash to close
- Down payment
- $46,850
- Closing costs
- $5,622
- Reserves months
- —
- Total cash needed
- —
Loan-product check · same deal, 3 products live
Conventional
25% down · 7.5% · 30yr
- Down + closing
- —
- Monthly P&I
- —
- Monthly cashflow
- —
- DSCR
- —
- Eligible?
- —
Personal DTI + credit; lowest rate.
DSCR
20% down · 8.5% · 30yr
- Down + closing
- —
- Monthly P&I
- —
- Monthly cashflow
- —
- DSCR
- —
- Eligible?
- —
No personal income docs; deal must DSCR.
Hard money
10% down · 12.0% · 12mo
- Down + closing
- —
- Monthly P&I
- —
- Monthly cashflow
- —
- DSCR
- —
- Eligible?
- —
Short-term bridge; refi at stabilization.
Listing history 12 events
-
2026-06-18status $187,400 Pending 13 DOM
-
2026-06-18days on market $187,400 Active 13 DOM
-
2026-06-17days on market $187,400 Active 12 DOM
-
2026-06-16days on market $187,400 Active 11 DOM
-
2026-06-15days on market $187,400 Active 10 DOM
-
2026-06-13days on market $187,400 Active 8 DOM
-
2026-06-12days on market $187,400 Active 7 DOM
-
2026-06-09days on market $187,400 Active 4 DOM
-
2026-06-08days on market $187,400 Active 3 DOM
-
2026-06-07days on market $187,400 Active 2 DOM
-
2026-06-07remarks 699-char remark
-
2026-06-07$187,400 Active 1 DOM
ⓘ Source: listings_history table (triggers on properties + properties_extension) + one-shot
backfill from property_details.listing_events for pre-trigger history.
Tax reassessment forecast MI · Partial reset (capped growth)
- Current annual tax
- $1,749 · $146/mo
- Projected year-2 tax
- $2,318 · $193/mo
- Expected delta
- +$568/yr (+$47/mo · 32.5%)
ⓘ Screening estimate from a state-policy table — verify with the county assessor before closing.
Climate risk First Street
- Flood 1/10 Low 0% chance over 30 yrs
- Wildfire 3/10 Moderate
- Heat 1/10 Low 7 d/yr ≥93°F today · 14 d/yr by 30 yrs out
- Wind 1/10 Low
- Air quality 2/10 Low 1 unhealthy d/yr today · 2 by 30 yrs out
Nearby sold comps map
Loading sold comps map…
Walkable amenities ~0.75 mi
Loading nearby amenities…
Taxation est. · year 1
- Rental income
- $18,810
- − Mortgage interest
- −$10,497
- − Property taxes
- −$1,749
- − Insurance
- −$937
- − Repairs & maintenance
- −$1,505
- − Management
- −$1,505
- − Depreciation
- −$5,452
- Taxable loss
- −$2,835
- Est. tax savings @ 24.0%
- +$680
- After-tax cash flow
- $1,061/yr
For passive investors: Depreciation is non-cash, so a rental often shows a tax loss while cash-flowing — sheltering income. Rental losses are passive: they offset passive income freely, and up to $25,000/yr can offset ordinary (W-2) income if you actively participate and your MAGI is under $100k (phasing out to $0 by $150k); unused losses carry forward. On sale, claimed depreciation is recaptured at up to 25%, and gains may owe capital-gains tax (a 1031 exchange can defer both). Figures are a year-1 estimate at your 24.0% rate — not tax advice; consult a CPA.
Schools (NCES district)
- District
- Cadillac Area Public Schools
- NCES district ID
- 2607590
- Math proficiency
- 45% ▼ -6.00%
- Reading proficiency
- 53% ▼ -4.00%
- Median HH income
- $41,543
- Composite
- 41.12/100
- National rank
- #3562
- State rank
- #120 of 540 in MI
Livability — Henderson
- Score
- 65/100
- State rank
- #473
- US rank
- #13395
Category grades
Schools grade is shown separately in the Schools card above.
Census & demographics
- Population (ZIP)
- 22,121
Population outlook (Wexford County) Hauer SSP2
- Today (2025)
- 32,399 people
- By 2030
- 31,692 · -2.2%
- By 2040
- 29,789 · -8.1%
- By 2050
- 27,473 · -15.2%
- By 2075
- 21,822 · -32.6%
- By 2100
- 15,237 · -53.0%
Race, ethnicity, and origin ACS 2023
- Neighborhood character
- Predominantly White (92%)
- Race & ethnicity
- White 92% Two or more races 5% Hispanic / Latino 2% Black 1%
- Common ancestry
- Iranian 7% Romanian 6% Lithuanian 4%
- Foreign-born
- 2% · Canada
- Languages at home
- 97% English-only · German/W. Germanic 1% Spanish 1%
Political lean MEDSL · Wexford
- 2024 margin
- Solid R (+34.6) · D 32.0% · R 66.6% · Other 1.5%
- 2008→2024 swing
- -30.4pp toward R · 2008: -4.2pp · 2024: -34.6pp
- All cycles
- 2024: R+34.6 2020: R+34.3 2016: R+36.4 2012: R+16.3 2008: R+4.2
Not yet ingested
- Civics
- —
Market trends
- HPI YoY
- ▼ -85.43%
- Current HPI
- 344.1577
- Rent YoY
- —
- Metro
- —
- State GDP YoY
- ▲ 1.37%
- F500 in state
- 28
Industry mix (Fortune 500 HQ in MI)
| Industry | F500 HQs | Revenue |
|---|---|---|
| Automotive Parts | 3 | $48B |
|
||
| Automotive | 2 | $372B |
|
||
| Chemicals | 1 | $45B |
|
||
| Automotive Retail | 1 | $29B |
|
||
| Healthcare / Medical Devices | 1 | $23B |
|
||
| Automotive Technology | 1 | $20B |
|
||
Price history
+1603.6% since first listed7 events — show timeline
- 2026-06-05 Listed $187,400 MiRealSource-MiMLS
- 2026-06-05 Listed $187,400 REALCOMP
- 2026-06-05 Listed $187,400 SW Michigan MLS
- 2015-09-25 Sold (Public Records) $90,000 Public Records
- 2014-09-16 Sold (Public Records) $90,000 Public Records
- 2014-09-16 Sold (MLS) $90,000 WWMLS
- 2010-12-20 Sold (Public Records) $11,000 Public Records
Property tax history
+4.7%/yrLatest (2025): $1,749 · +2.5% YoY. Source: county tax records.
Cash-flow waterfall
monthlySold comps — $/sqft
last 12 mo · ≤1 miLoading sold comps…