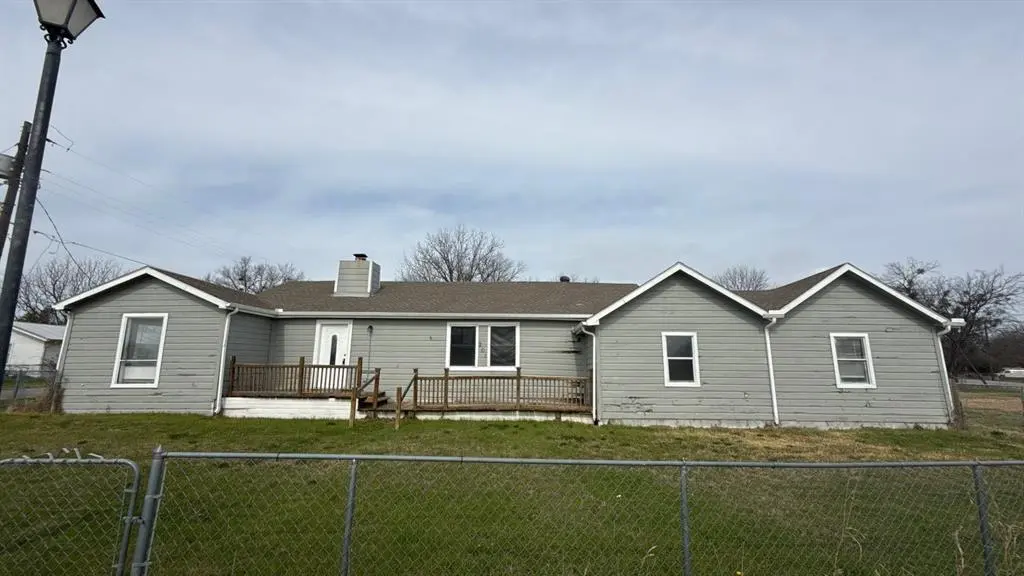
201 E Hubbard St · Josephine, TX
Flood risk 1/10 · Minimal
- FEMA flood zone
- X (unshaded)
- Chance of flooding over 30 yrs
- 0.0%
- Est. flood insurance / yr
- $507 – $1,088
Fire risk 6/10 · Moderate
- Est. fire insurance / yr
- $1,222 – $2,270
Heat risk 7/10 · Major
- Hot days now (above 110°F)
- 7 days/yr
- Hot days in 30 yrs
- 21 days/yr
Wind risk 6/10 · Moderate
- Chance of severe wind over 30 yrs
- 27.0%
Air-quality risk 2/10 · Minimal
- Unhealthy air days now
- 1 days/yr
- Unhealthy air days in 30 yrs
- 1 days/yr
Risk factors via First Street. Map © Google.
Why this score? — see what drove the B+ grade
The composite is a weighted blend of 9 inputs, each scored 0–100. Each bar is that input's sub-score; the figure is the points it added to the 100-point composite (weight × sub-score).
- Cash flow +30.0/30.0
- 1% rule +10.0/10.0
- DSCR +10.0/10.0
- Appreciation +10.0/10.0
- ARV discount +7.5/15.0
- Schools +3.2/10.0
- Livability +3.0/5.0
- Rent growth +2.5/5.0
- Condition / age +2.5/5.0
$124,900
🖨 Deal sheet 📄 Offer letter ✓ Due diligence
Listing remarks MLS
Small-town living at its best! This spacious frame home sits on a .25 acre lot, offering room to spread out, entertain, and enjoy. Inside, you’ll find an oversized family room with a cozy fireplace that flows into a step-down kitchen and sunny breakfast nook—perfect for everyday living and weekend gatherings. The private primary suite is tucked near a second living area or study, while two additional bedrooms are positioned on the opposite side of the home for added privacy. Step outside to a fenced yard, large deck ideal for grilling and relaxing, plus a storage building for all your extras. With space, flexibility, and a hard-to-find oversized lot, this one won’t stay available for long—schedule your showing today! SOLD AS-IS
Key facts
- Large deck
- Step-down kitchen
- Fenced yard
Tags
Neighborhood map
What this means for you Summary
Snapshot
- This is a 3-bed/3.0-bath single-family listed at $125k.
Deal economics
- At list price, monthly cash flow is $786 ($9k/yr) — positive.
- The deal already cash-flows at list — no discount required.
- Meets the 1% rule at list price ($2k rent vs $125k).
- Recommended offer: $114k (9.0% below list) — sets the bar for market timing.
- Cap rate 13.8% vs local median 4.4% in Josephine — top-decile yield for the area; either an underpriced asset or a hidden risk that comps aren't pricing in. Stress-test before assuming the spread holds.
Location & tenants
- Location reads 60/100 on livability (#1,076 in TX) — a middle-class / working-renter tenant base. Strengths: cost of living A+, housing A+, crime A-; Watch: schools F, amenities F, commute F.
- Community ISD (rural): math 30% / reading 38% proficiency, ranked #479 of 826 in TX (top 58%) — families likely to look elsewhere, expect single-tenant / working-renter base with shorter leases.
- Market conditions: 421 active listings in the ZIP; 10 comparable units currently listed for rent nearby; rentals at typical pace (median 25d on market — plan ~3-4 weeks tenant-placement turnaround); 40% of comp listings sitting > 30 days — soft ceiling on asking rent; 19,194 units permitted in Collin County in 2024 (3,988 in 5+ unit buildings).
Forward outlook
- In year one you build about $13k of equity ($864 loan paydown + $12k appreciation (10.0% local appreciation)).
- Collin County population projected at +60% by 2050 — long-run rental-demand tailwind backs the buy-and-hold thesis.
- At projected returns (10.0% appreciation + 3.0% rent growth), your $35k cash investment doubles in ~2 years — after that, you're playing with house money.
- By year 3, paydown + projected appreciation supports a ~$34k cash-out refi (75% LTV) — recoverable capital for the next deal without selling this one.
Negotiation context
- It's been on market 116 days — a 9% lower offer ($114k) is reasonable based on typical stale-listing flexibility.
- 6 sale attempts since 11y ago; this cycle's ask has dropped $20k (14%) from the opening price — seller is motivated, your offer sets the floor, not the list.
Risks & watch-outs
- Watch-outs: property tax is 3.5% of price; built in 1945 — expect roof / HVAC / electrical / plumbing capex.
- Climate carrying-cost: major wind risk, 27% chance of damaging wind over 30y; major wildfire risk; extreme-heat days projected 7→21/yr by 2055 (HVAC capex compounding) — expect insurance premiums to compound above CPI over the hold.
Questions for the listing agent
- It's been on market 116 days. Have you received any prior offers? Is the seller open to a 9% concession, seller financing, or rate buy-down credit?
- Built in 1945 — when were the roof, HVAC, electrical panel, plumbing, and water heater last replaced?
- Property tax is high relative to price — has the assessment been appealed recently, and will the sale trigger a re-assessment?
- Why hasn't it sold? Are there any deal-killer items the seller is aware of (foundation, flood, title, zoning, code violations)?
- Is there a deadline driving the sale (1031 exchange, divorce, estate, relocation)? That informs how much negotiation room exists.
- Schools are F-rated, which usually means shorter tenancies and higher turnover. Who's the typical renter profile here, and what's been the actual vacancy rate?
- What's the average days-on-market for RENTAL listings here right now (not sales)? A rising rental-DOM trend means longer vacancies and softer asking-rent achievability than the comps imply.
- What's the recent tenant-quality profile in this submarket — average credit score on applications, eviction rate, late-payment / NSF rate, and stable-employment percentage? A property-management company in the area should have these aggregated.
- How much new for-sale + rental construction is in the pipeline within 1–3 miles? Heavy new supply typically softens prices + rents 12–24 months out; constrained supply supports both.
Investment metrics
- 1% rule
- 1.89% ✓
- Cap rate
- 13.85%
- Cash-on-cash
- 26.98%
- DSCR
- 2.20
- GRM
- 4.4
CMA / ARV
- ARV (median comp)
- $377,586
- List price
- $124,900
- Delta
- -66.92%
- Verdict
- UNDERPRICED
- Comps
- 20 within 1.0 mi
Show comp detail 11 sales within ~0.75 mi
| Address | Dist | Beds/Ba | Sqft | Sold | Price | $/sf | Match |
|---|---|---|---|---|---|---|---|
| 112 N Greenville Rd | 0.11mi | 4/2.5 (+1) | 2,572 (-8%) | 18mo | $190,000 | $74 | 60 |
| 406 Mercer Dr | 0.40mi | 4/3.0 (+1) | 2,667 (-4%) | 21mo | $399,900 | $150 | 52 |
| 506 Fountain View Ln | 0.61mi | 4/3.0 (+1) | 2,928 (+5%) | 9mo | $295,000 | $101 | 51 |
| 601 Dunhill Rd | 0.71mi | 4/2.5 (+1) | 2,599 (-7%) | 1mo | $357,990 | $138 | 48 |
| 1206 Sugar Pine Dr | 0.42mi | 4/3.0 (+1) | 2,454 (-12%) | 11mo | $330,990 | $135 | 46 |
| 311 Fountain View Ln | 0.55mi | 4/3.0 (+1) | 2,729 (-2%) | 24mo | $359,900 | $132 | 46 |
| 313 Fountain View Ln | 0.55mi | 4/2.0 (+1) | 2,474 (-11%) | 10mo | $339,000 | $137 | 38 |
| 516 Jasmine Cir | 0.71mi | 4/2.0 (+1) | 2,602 (-7%) | 12mo | $345,000 | $133 | 36 |
| 605 Mallard Dr | 0.57mi | 4/2.0 (+1) | 2,502 (-10%) | 14mo | $345,000 | $138 | 36 |
| 411 Jasmine Cir | 0.62mi | 4/2.0 (+1) | 2,502 (-10%) | 13mo | $445,000 | $178 | 34 |
| 918 Lexington Ln | 0.74mi | 4/2.5 (+1) | 2,406 (-14%) | 21mo | $319,990 | $133 | 18 |
Match score weights: distance 35% · size 25% · config 20% · recency 20%. Top-matched comps best support the ARV.
Projected returns pro-forma
10.0% appreciation · 3.0% rent growth · sell at horizon
- IRR
- 44.7%
- Equity multiple
- 4.38×
- Total profit
- $118,262
- Equity at exit
- $112,520
- IRR
- 38.8%
- Equity multiple
- 9.84×
- Total profit
- $309,214
- Equity at exit
- $242,653
Cash invested: $34,972 (down + closing). Projections, not guarantees.
Landlord ↔ Tenant lean methodology
- Overall (STATE)
- 87 Strongly Landlord-Friendly
- State Texas
- 87 Strongly Landlord-Friendly · R+5
- County
- — inherits STATE
- City
- — inherits STATE
ZIP-level market 75173
- Home prices YoY
- 3.1%
- Active inventory
- 421
- Price-to-rent
- 4.4×
Monthly cashflow live
- Estimated rent
- $2,354 high interval (Pro) →
- Mortgage (P&I)
- −$655
- Tax from tax record
- −$367 /mo · $4,401/yr
- Insurance
- −$52
- HOA
- −$0
- Vacancy / Maint / Mgmt
- −$494
- Net cashflow
- $786
Break-even live
UW: 25.0% down · 7.5% · 30yr · 1.5% tax · 5.0% vac · 8.0% maint · 8.0% mgmt
Financing live
Cash to close
- Down payment
- $31,225
- Closing costs
- $3,747
- Reserves months
- —
- Total cash needed
- —
Loan-product check · same deal, 3 products live
Conventional
25% down · 7.5% · 30yr
- Down + closing
- —
- Monthly P&I
- —
- Monthly cashflow
- —
- DSCR
- —
- Eligible?
- —
Personal DTI + credit; lowest rate.
DSCR
20% down · 8.5% · 30yr
- Down + closing
- —
- Monthly P&I
- —
- Monthly cashflow
- —
- DSCR
- —
- Eligible?
- —
No personal income docs; deal must DSCR.
Hard money
10% down · 12.0% · 12mo
- Down + closing
- —
- Monthly P&I
- —
- Monthly cashflow
- —
- DSCR
- —
- Eligible?
- —
Short-term bridge; refi at stabilization.
Rent comps 10 comps
| Address | Beds | Baths | Sqft | Rent | $/sqft | DOM | Units | Dist |
|---|---|---|---|---|---|---|---|---|
| 464 N Greenville St Farmersville, TX | 3.0 | 2.0 | 2000 | $3,000 | $1.50 | 1d | 1 | 0.42mi |
| 315 Pine Hollow Way Josephine, TX | 4.0 | 3.0 | 2212 | $2,300 | $1.04 | 7d | 1 | 0.75mi |
| 717 Cottonwood WAY Josephine, TX | 4.0 | 3.0 | 2073 | $2,125 | $1.03 | 1d | 1 | 0.98mi |
| 813 Cottonwood Way Royse City, TX | 4.0 | 3.0 | 2347 | $2,350 | $1.00 | 12d | 1 | 1.05mi |
| 311 Milo Way Royse City, TX | 4.0 | 2.0 | 2074 | $2,200 | $1.06 | 6d | 1 | 1.05mi |
| 305 Silo Cir Royse City, TX | 4.0 | 2.0 | 2074 | $2,100 | $1.01 | 24d | 1 | 1.10mi |
| 601 Barlow Dr Caddo Mills, TX | 4.0 | 3.0 | 2090 | $2,075 | $0.99 | 43d | 1 | 1.13mi |
| 1208 Riverbrook Ln Caddo Mills, TX | 4.0 | 3.0 | 2088 | $2,095 | $1.00 | 43d | 1 | 1.26mi |
| 503 Saddle Blanket Dr Nevada, TX | 4.0 | 3.0 | 2077 | $2,190 | $1.05 | 43d | 1 | 1.29mi |
| 1307 Community Way Royse City, TX | 4.0 | 2.0 | 2104 | $2,100 | $1.00 | 43d | 1 | 1.40mi |
Listing history 29 events
-
2026-06-18days on market $124,900 Active 116 DOM
-
2026-06-17days on market $124,900 Active 115 DOM
-
2026-06-16days on market $124,900 Active 114 DOM
-
2026-06-15days on market $124,900 Active 113 DOM
-
2026-06-13days on market $124,900 Active 111 DOM
-
2026-06-13days on market $124,900 Active 110 DOM
-
2026-06-09days on market $124,900 Active 107 DOM
-
2026-06-08days on market $124,900 Active 106 DOM
-
2026-06-07days on market $124,900 Active 105 DOM
-
2026-06-04days on market $124,900 Active 102 DOM
-
2026-06-03days on market $124,900 Active 101 DOM
-
2026-06-02days on market $124,900 Active 100 DOM
-
2026-06-01days on market $124,900 Active 99 DOM
-
2026-05-31days on market $124,900 Active 98 DOM
-
2026-04-06price $139,900 761-char remark
Show marketing remark (761 chars)
Small-town living at its best! This spacious frame home sits on a .25 acre lot, offering room to spread out, entertain, and enjoy. Inside, you’ll find an oversized family room with a cozy fireplace that flows into a step-down kitchen and sunny breakfast nook—perfect for everyday living and weekend gatherings. The private primary suite is tucked near a second living area or study, while two additional bedrooms are positioned on the opposite side of the home for added privacy. Step outside to a fenced yard, large deck ideal for grilling and relaxing, plus a storage building for all your extras. With space, flexibility, and a hard-to-find oversized lot, this one won’t stay available for long—schedule your showing today! SOLD AS-IS
-
2026-02-20$144,900 Active 761-char remark
Show marketing remark (761 chars)
Small-town living at its best! This spacious frame home sits on a .25 acre lot, offering room to spread out, entertain, and enjoy. Inside, you’ll find an oversized family room with a cozy fireplace that flows into a step-down kitchen and sunny breakfast nook—perfect for everyday living and weekend gatherings. The private primary suite is tucked near a second living area or study, while two additional bedrooms are positioned on the opposite side of the home for added privacy. Step outside to a fenced yard, large deck ideal for grilling and relaxing, plus a storage building for all your extras. With space, flexibility, and a hard-to-find oversized lot, this one won’t stay available for long—schedule your showing today! SOLD AS-IS
-
2023-12-23price $130,000
-
2023-12-13$149,000 Active
-
2016-07-15historical
-
2016-06-02$109,900 Active
-
2016-05-29historical
-
2016-05-07price $109,000
-
2016-04-08price $119,000
-
2016-03-23status Active
-
2016-03-09historical Active Option Contract
-
2016-03-02$125,000 Active
-
2016-02-09historical
-
2016-02-09price $145,000
-
2015-10-14$155,099 Active
ⓘ Source: listings_history table (triggers on properties + properties_extension) + one-shot
backfill from property_details.listing_events for pre-trigger history.
Tax reassessment forecast TX · Resets to sale price
- Current annual tax
- $4,401 · $367/mo
- Projected year-2 tax
- $4,401 · $367/mo
- Expected delta
- $0/yr ($0/mo · 0.0%)
ⓘ Screening estimate from a state-policy table — verify with the county assessor before closing.
Climate risk First Street
- Flood 1/10 Low FEMA zone X (unshaded) · 0% chance over 30 yrs
- Wildfire 6/10 Major
- Heat 7/10 Severe 7 d/yr ≥110°F today · 21 d/yr by 30 yrs out
- Wind 6/10 Major 27% chance of damaging wind over 30 yrs
- Air quality 2/10 Low 1 unhealthy d/yr today · 1 by 30 yrs out
Nearby sold comps map
Loading sold comps map…
Walkable amenities ~0.75 mi
Loading nearby amenities…
Taxation est. · year 1
- Rental income
- $28,253
- − Mortgage interest
- −$6,996
- − Property taxes
- −$4,401
- − Insurance
- −$624
- − Repairs & maintenance
- −$2,260
- − Management
- −$2,260
- − Depreciation
- −$3,633
- Taxable income
- $8,077
- Est. tax owed @ 24.0%
- −$1,939
- After-tax cash flow
- $7,496/yr
For passive investors: Depreciation is non-cash, so a rental often shows a tax loss while cash-flowing — sheltering income. Rental losses are passive: they offset passive income freely, and up to $25,000/yr can offset ordinary (W-2) income if you actively participate and your MAGI is under $100k (phasing out to $0 by $150k); unused losses carry forward. On sale, claimed depreciation is recaptured at up to 25%, and gains may owe capital-gains tax (a 1031 exchange can defer both). Figures are a year-1 estimate at your 24.0% rate — not tax advice; consult a CPA.
Schools (NCES district)
- District
- Community ISD
- NCES district ID
- 4814850
- Math proficiency
- 30% ▼ -23.00%
- Reading proficiency
- 38% ▼ -11.00%
- Median HH income
- $71,841
- Composite
- 31.58/100
- National rank
- #5951
- State rank
- #479 of 826 in TX
Livability — Josephine
- Score
- 60/100
- State rank
- #1076
- US rank
- #19105
Category grades
Schools grade is shown separately in the Schools card above.
Census & demographics
- Census place
- Josephine, TX
- Population (ZIP)
- 9,284
Population outlook (Collin County) Hauer SSP2
- Today (2025)
- 1,210,074 people
- By 2030
- 1,358,201 · +12.2%
- By 2040
- 1,654,061 · +36.7%
- By 2050
- 1,937,359 · +60.1%
- By 2075
- 2,567,039 · +112.1%
- By 2100
- 2,952,048 · +144.0%
Race, ethnicity, and origin ACS 2023
- Neighborhood character
- Majority White (65%)
- Race & ethnicity
- White 65% Hispanic / Latino 28% Two or more races 15% Black 2% Native American 1%
- Hispanic origin (detail)
- Mexican 26%
- Common ancestry
- Slovak 2% Serbian 1% Iranian 1%
- Foreign-born
- 17% · Canada, Jamaica
- Languages at home
- 74% English-only · Spanish 24% Arabic 1%
Political lean MEDSL · Collin
- 2024 margin
- R (+11.1) · D 43.1% · R 54.3% · Other 2.6%
- 2008→2024 swing
- +14.4pp toward D · 2008: -25.6pp · 2024: -11.1pp
- All cycles
- 2024: R+11.1 2020: R+4.3 2016: R+17.0 2012: R+31.6 2008: R+25.6
Not yet ingested
- Civics
- —
Market trends
- HPI YoY
- ▲ 10.09%
- Current HPI
- 331.12
- Rent YoY
- —
- Metro
- —
- State GDP YoY
- ▲ 3.95%
- F500 in state
- 110
Industry mix (Fortune 500 HQ in TX)
| Industry | F500 HQs | Revenue |
|---|---|---|
| Energy | 16 | $1,198B |
|
||
| Technology | 5 | $198B |
|
||
| Engineering / Construction | 4 | $72B |
|
||
| Energy Services | 3 | $60B |
|
||
| Utilities | 3 | $41B |
|
||
| Healthcare | 2 | $330B |
|
||
Price history
-9.8% since first listed15 events — show timeline
- 2026-04-06 Price Changed $139,900 NTREIS
- 2026-02-20 Listed $144,900 NTREIS
- 2023-12-23 Price Changed $130,000 NTREIS
- 2023-12-13 Listed $149,000 NTREIS
- 2016-07-15 Listing Removed — NTREIS
- 2016-06-02 Listed $109,900 NTREIS
- 2016-05-29 Listing Removed — NTREIS
- 2016-05-07 Price Changed $109,000 NTREIS
- 2016-04-08 Price Changed $119,000 NTREIS
- 2016-03-23 Relisted — NTREIS
- 2016-03-09 Contingent — NTREIS
- 2016-03-02 Listed $125,000 NTREIS
- 2016-02-09 Listing Removed — NTREIS
- 2016-02-09 Price Changed $145,000 NTREIS
- 2015-10-14 Listed $155,099 NTREIS
Property tax history
+8.3%/yrLatest (2025): $4,401 · -2.6% YoY. Source: county tax records.
Cash-flow waterfall
monthlySold comps — $/sqft
last 12 mo · ≤1 miLoading sold comps…