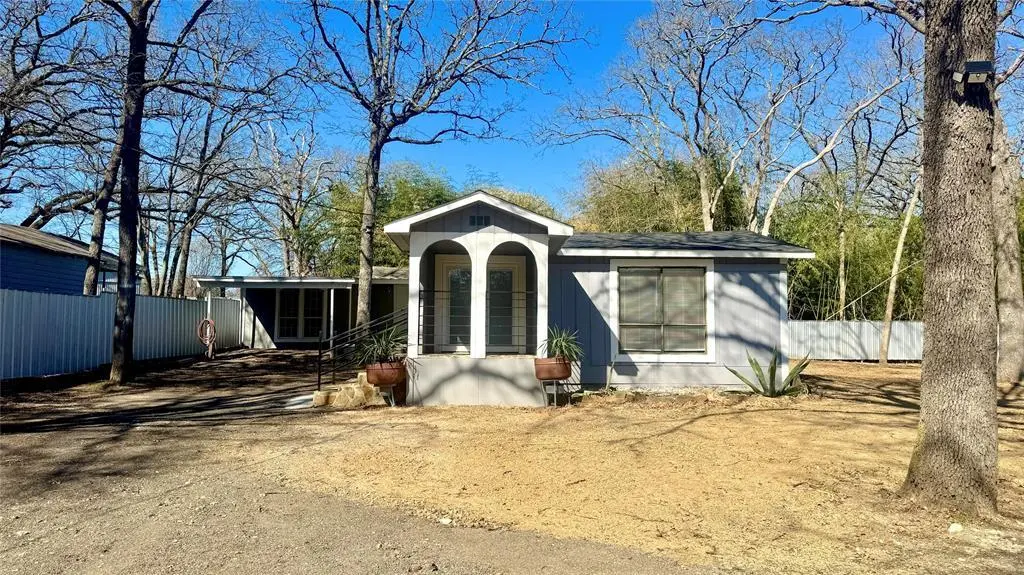
2618 Lakewood Dr · West Tawakoni, TX
Flood risk 1/10 · Minimal
- FEMA flood zone
- X (unshaded)
- Chance of flooding over 30 yrs
- 0.0%
- Est. flood insurance / yr
- $507 – $1,088
Fire risk 3/10 · Minor
- Est. fire insurance / yr
- $1,222 – $2,270
Heat risk 7/10 · Major
- Hot days now (above 110°F)
- 7 days/yr
- Hot days in 30 yrs
- 23 days/yr
Wind risk 6/10 · Moderate
- Chance of severe wind over 30 yrs
- 27.0%
Air-quality risk 2/10 · Minimal
- Unhealthy air days now
- 1 days/yr
- Unhealthy air days in 30 yrs
- 1 days/yr
Risk factors via First Street. Map © Google.
Why this score? — see what drove the D+ grade
The composite is a weighted blend of 9 inputs, each scored 0–100. Each bar is that input's sub-score; the figure is the points it added to the 100-point composite (weight × sub-score).
- Cash flow +23.2/30.0
- DSCR +7.5/10.0
- 1% rule +5.7/10.0
- Livability +2.8/5.0
- Schools +2.6/10.0
- Rent growth +2.5/5.0
- Condition / age +2.5/5.0
- ARV discount +0.0/15.0
- Appreciation +0.0/10.0
$175,000
🖨 Deal sheet 📄 Offer letter ✓ Due diligence
Listing remarks MLS
Recently renovated 2.1 home located near Lake Tawakoni. Property features many mature trees, a 20' storage container with electricity, covered parking, and an attached 450sf bonus area that could be upgraded into additional living quarters.
Key facts
- 0.32 acre lot
- 2 parking spots
- Built 1980
Neighborhood map
What this means for you Summary
Snapshot
- This is a 2-bed/2.0-bath single-family listed at $175k.
Deal economics
- At list price, monthly cash flow is $318 ($4k/yr) — positive.
- The deal already cash-flows at list — no discount required.
- Meets the 1% rule at list price ($2k rent vs $175k).
- Recommended offer: $154k (12.0% below list) — sets the bar for market timing.
- Cap rate 8.5% vs local median 4.6% in West Tawakoni — top-decile yield for the area; either an underpriced asset or a hidden risk that comps aren't pricing in. Stress-test before assuming the spread holds.
Location & tenants
- Location reads 56/100 on livability (#1,337 in TX) — a working-class tenant base; expect higher turnover. Strengths: cost of living A+, housing A+, crime A-; Watch: schools F, amenities F, commute F.
- Quinlan ISD (rural): math 27% / reading 34% proficiency, ranked #610 of 826 in TX (top 74%) — families likely to look elsewhere, expect single-tenant / working-renter base with shorter leases.
- Market conditions: 284 active listings in the ZIP; 2 comparable units currently listed for rent nearby; 1,289 units permitted in Hunt County in 2024 (527 in 5+ unit buildings).
Forward outlook
- Local home prices are declining (-3.0%/yr); year-one equity from $1k of loan paydown is wiped out by about $5k of value loss. Plan a longer hold.
- Hunt County population projected at +15% by 2050 — modest demand growth; plan on rents tracking national, not racing it.
Negotiation context
- It's been on market 122 days — a 12% lower offer ($154k) is reasonable based on typical stale-listing flexibility.
- 2 sale attempts since 12y ago; this cycle's ask has dropped $15k (8%) from the opening price — seller is motivated, your offer sets the floor, not the list.
Risks & watch-outs
- Climate carrying-cost: major wind risk, 27% chance of damaging wind over 30y; extreme-heat days projected 7→23/yr by 2055 (HVAC capex compounding) — expect insurance premiums to compound above CPI over the hold.
Questions for the listing agent
- It's been on market 122 days. Have you received any prior offers? Is the seller open to a 12% concession, seller financing, or rate buy-down credit?
- Why hasn't it sold? Are there any deal-killer items the seller is aware of (foundation, flood, title, zoning, code violations)?
- Is there a deadline driving the sale (1031 exchange, divorce, estate, relocation)? That informs how much negotiation room exists.
- Schools are F-rated, which usually means shorter tenancies and higher turnover. Who's the typical renter profile here, and what's been the actual vacancy rate?
- The area grade is low — what's the realistic commute time and amenity access for the typical tenant pool here? Any planned neighborhood developments (good or bad) we should know about?
- What's the average days-on-market for RENTAL listings here right now (not sales)? A rising rental-DOM trend means longer vacancies and softer asking-rent achievability than the comps imply.
- What's the recent tenant-quality profile in this submarket — average credit score on applications, eviction rate, late-payment / NSF rate, and stable-employment percentage? A property-management company in the area should have these aggregated.
- How much new for-sale + rental construction is in the pipeline within 1–3 miles? Heavy new supply typically softens prices + rents 12–24 months out; constrained supply supports both.
Investment metrics
- 1% rule
- 1.07% ✓
- Cap rate
- 8.47%
- Cash-on-cash
- 7.78%
- DSCR
- 1.35
- GRM
- 7.8
CMA / ARV
- ARV (median comp)
- $125,901
- List price
- $175,000
- Delta
- 39.00%
- Verdict
- OVERPRICED
- Comps
- 11 within 1.0 mi
Show comp detail 4 sales within ~0.75 mi
| Address | Dist | Beds/Ba | Sqft | Sold | Price | $/sf | Match |
|---|---|---|---|---|---|---|---|
| 4525 County Road 3706 | 0.64mi | 3/2.0 (+1) | 1,440 (+7%) | 4mo | $40,000 | $28 | 51 |
| 2549 Bass Dr | 0.26mi | 3/2.0 (+1) | 1,216 (-10%) | 22mo | $119,900 | $99 | 48 |
| 2841 Honey Bee Ln | 0.72mi | 3/1.0 (+1) | 1,220 (-10%) | 5mo | $199,999 | $164 | 38 |
| 879 Vz County Road 3822 | 0.72mi | 3/1.5 (+1) | 1,246 (-8%) | 23mo | $250,000 | $201 | 28 |
Match score weights: distance 35% · size 25% · config 20% · recency 20%. Top-matched comps best support the ARV.
Projected returns pro-forma
-3.0% appreciation · 3.0% rent growth · sell at horizon
- IRR
- -4.4%
- Equity multiple
- 0.83×
- Total profit
- $-8,121
- Equity at exit
- $26,093
- IRR
- 5.2%
- Equity multiple
- 1.39×
- Total profit
- $18,990
- Equity at exit
- $15,131
Cash invested: $49,000 (down + closing). Projections, not guarantees.
Landlord ↔ Tenant lean methodology
- Overall (STATE)
- 87 Strongly Landlord-Friendly
- State Texas
- 87 Strongly Landlord-Friendly · R+5
- County
- — inherits STATE
- City
- — inherits STATE
ZIP-level market 75169
- Home prices YoY
- -15.4%
- Active inventory
- 284
- Price-to-rent
- 7.8×
Monthly cashflow live
- Estimated rent
- $1,878 medium interval (Pro) →
- Mortgage (P&I)
- −$918
- Tax from tax record
- −$175 /mo · $2,099/yr
- Insurance
- −$73
- HOA
- −$0
- Vacancy / Maint / Mgmt
- −$394
- Net cashflow
- $318
Break-even live
UW: 25.0% down · 7.5% · 30yr · 1.5% tax · 5.0% vac · 8.0% maint · 8.0% mgmt
Financing live
Cash to close
- Down payment
- $43,750
- Closing costs
- $5,250
- Reserves months
- —
- Total cash needed
- —
Loan-product check · same deal, 3 products live
Conventional
25% down · 7.5% · 30yr
- Down + closing
- —
- Monthly P&I
- —
- Monthly cashflow
- —
- DSCR
- —
- Eligible?
- —
Personal DTI + credit; lowest rate.
DSCR
20% down · 8.5% · 30yr
- Down + closing
- —
- Monthly P&I
- —
- Monthly cashflow
- —
- DSCR
- —
- Eligible?
- —
No personal income docs; deal must DSCR.
Hard money
10% down · 12.0% · 12mo
- Down + closing
- —
- Monthly P&I
- —
- Monthly cashflow
- —
- DSCR
- —
- Eligible?
- —
Short-term bridge; refi at stabilization.
Rent comps 2 comps
| Address | Beds | Baths | Sqft | Rent | $/sqft | DOM | Units | Dist |
|---|---|---|---|---|---|---|---|---|
| 10895 Catfish Dr E Wills Point, TX | 3.0 | 2.0 | 1036 | $1,700 | $1.64 | 12d | 1 | 0.38mi |
| 10081 Jacobs Ln Wills Point, TX | 3.0 | 2.0 | 1824 | $2,390 | $1.31 | 1d | 1 | 1.05mi |
Listing history 19 events
-
2026-06-18days on market $175,000 Active 122 DOM
-
2026-06-17days on market $175,000 Active 121 DOM
-
2026-06-16days on market $175,000 Active 120 DOM
-
2026-06-15days on market $175,000 Active 119 DOM
-
2026-06-13days on market $175,000 Active 117 DOM
-
2026-06-09days on market $175,000 Active 113 DOM
-
2026-06-08days on market $175,000 Active 112 DOM
-
2026-06-07days on market $175,000 Active 111 DOM
-
2026-06-04days on market $175,000 Active 108 DOM
-
2026-06-03days on market $175,000 Active 107 DOM
-
2026-06-02days on market $175,000 Active 106 DOM
-
2026-06-01days on market $175,000 Active 105 DOM
-
2026-05-31days on market $175,000 Active 104 DOM
-
2026-05-01price $175,000 240-char remark
Show marketing remark (240 chars)
Recently renovated 2.1 home located near Lake Tawakoni. Property features many mature trees, a 20' storage container with electricity, covered parking, and an attached 450sf bonus area that could be upgraded into additional living quarters.
-
2026-02-16$189,900 Active 240-char remark
Show marketing remark (240 chars)
Recently renovated 2.1 home located near Lake Tawakoni. Property features many mature trees, a 20' storage container with electricity, covered parking, and an attached 450sf bonus area that could be upgraded into additional living quarters.
-
2015-11-25soldstatus
-
2014-06-16soldstatus Closed 179-char remark
Show marketing remark (179 chars)
House has been reduced to a shell, most everything has been stripped out of it. There is a water hook-up, septic, and power. Rehab project for someone willing to work on property.
-
2014-06-13soldstatus
-
2014-05-12$9,900 Active 179-char remark
Show marketing remark (179 chars)
House has been reduced to a shell, most everything has been stripped out of it. There is a water hook-up, septic, and power. Rehab project for someone willing to work on property.
ⓘ Source: listings_history table (triggers on properties + properties_extension) + one-shot
backfill from property_details.listing_events for pre-trigger history.
Tax reassessment forecast TX · Resets to sale price
- Current annual tax
- $2,099 · $175/mo
- Projected year-2 tax
- $3,202 · $267/mo
- Expected delta
- +$1,103/yr (+$92/mo · 52.5%)
ⓘ Screening estimate from a state-policy table — verify with the county assessor before closing.
Climate risk First Street
- Flood 1/10 Low FEMA zone X (unshaded) · 0% chance over 30 yrs
- Wildfire 3/10 Moderate
- Heat 7/10 Severe 7 d/yr ≥110°F today · 23 d/yr by 30 yrs out
- Wind 6/10 Major 27% chance of damaging wind over 30 yrs
- Air quality 2/10 Low 1 unhealthy d/yr today · 1 by 30 yrs out
Nearby sold comps map
Loading sold comps map…
Walkable amenities ~0.75 mi
Loading nearby amenities…
Taxation est. · year 1
- Rental income
- $22,531
- − Mortgage interest
- −$9,803
- − Property taxes
- −$2,099
- − Insurance
- −$875
- − Repairs & maintenance
- −$1,802
- − Management
- −$1,802
- − Depreciation
- −$5,091
- Taxable income
- $1,058
- Est. tax owed @ 24.0%
- −$254
- After-tax cash flow
- $3,559/yr
For passive investors: Depreciation is non-cash, so a rental often shows a tax loss while cash-flowing — sheltering income. Rental losses are passive: they offset passive income freely, and up to $25,000/yr can offset ordinary (W-2) income if you actively participate and your MAGI is under $100k (phasing out to $0 by $150k); unused losses carry forward. On sale, claimed depreciation is recaptured at up to 25%, and gains may owe capital-gains tax (a 1031 exchange can defer both). Figures are a year-1 estimate at your 24.0% rate — not tax advice; consult a CPA.
Schools (NCES district)
- District
- Quinlan ISD
- NCES district ID
- 4836240
- Math proficiency
- 27% ▼ -10.00%
- Reading proficiency
- 34% ▼ -2.00%
- Median HH income
- $45,461
- Composite
- 26.16/100
- National rank
- #7271
- State rank
- #610 of 826 in TX
Livability — West Tawakoni
- Score
- 56/100
- State rank
- #1337
- US rank
- #23022
Category grades
Schools grade is shown separately in the Schools card above.
Census & demographics
- Population (ZIP)
- 15,744
Population outlook (Hunt County) Hauer SSP2
- Today (2025)
- 97,090 people
- By 2030
- 100,452 · +3.5%
- By 2040
- 106,544 · +9.7%
- By 2050
- 111,218 · +14.6%
- By 2075
- 121,695 · +25.3%
- By 2100
- 123,683 · +27.4%
Race, ethnicity, and origin ACS 2023
- Neighborhood character
- Predominantly White (78%)
- Race & ethnicity
- White 78% Hispanic / Latino 15% Two or more races 7% Black 4%
- Hispanic origin (detail)
- Mexican 15%
- Common ancestry
- Slovak 2% Italian 1% Lithuanian 1%
- Foreign-born
- 4% · Canada
- Languages at home
- 92% English-only · Spanish 8%
Political lean MEDSL · Hunt
- 2024 margin
- Solid R (+55.5) · D 21.9% · R 77.4%
- 2008→2024 swing
- -14.9pp toward R · 2008: -40.6pp · 2024: -55.5pp
- All cycles
- 2024: R+55.5 2020: R+52.5 2016: R+56.3 2012: R+51.2 2008: R+40.6
Not yet ingested
- Civics
- —
Market trends
- HPI YoY
- ▼ -45.68%
- Current HPI
- 250.2271
- Rent YoY
- —
- Metro
- —
- State GDP YoY
- ▲ 3.95%
- F500 in state
- 110
Industry mix (Fortune 500 HQ in TX)
| Industry | F500 HQs | Revenue |
|---|---|---|
| Energy | 16 | $1,198B |
|
||
| Technology | 5 | $198B |
|
||
| Engineering / Construction | 4 | $72B |
|
||
| Energy Services | 3 | $60B |
|
||
| Utilities | 3 | $41B |
|
||
| Healthcare | 2 | $330B |
|
||
Price history
+1667.7% since first listed6 events — show timeline
- 2026-05-01 Price Changed $175,000 NTREIS
- 2026-02-16 Listed $189,900 NTREIS
- 2015-11-25 Sold (Public Records) — Public Records
- 2014-06-16 Sold (MLS) — NTREIS
- 2014-06-13 Sold (Public Records) — Public Records
- 2014-05-12 Listed $9,900 NTREIS
Property tax history
+15.0%/yrLatest (2025): $2,099 · +19.8% YoY. Source: county tax records.
Cash-flow waterfall
monthlySold comps — $/sqft
last 12 mo · ≤1 miLoading sold comps…