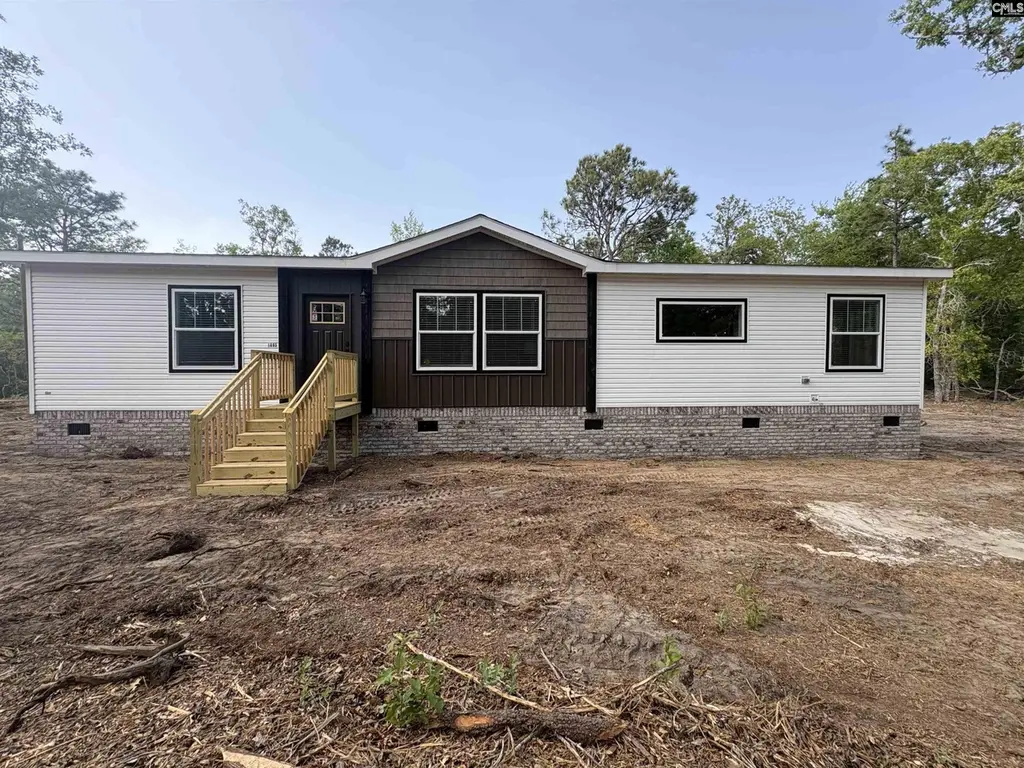
1895 Quattlebaum Rd · Fairview Crossroads, SC
Flood risk No data
- FEMA flood zone
- —
- Chance of flooding over 30 yrs
- —
- Est. flood insurance / yr
- —
Fire risk No data
- Est. fire insurance / yr
- —
Heat risk No data
- Hot days now (above threshold)
- —
- Hot days in 30 yrs
- —
Wind risk No data
- Chance of severe wind over 30 yrs
- —
Air-quality risk No data
- Unhealthy air days now
- —
- Unhealthy air days in 30 yrs
- —
Risk factors via First Street. Map © Google.
Why this score? — see what drove the D- grade
The composite is a weighted blend of 9 inputs, each scored 0–100. Each bar is that input's sub-score; the figure is the points it added to the 100-point composite (weight × sub-score).
- Appreciation +10.0/10.0
- ARV discount +7.5/15.0
- Cash flow +6.1/30.0
- Schools +4.2/10.0
- Rent growth +2.5/5.0
- Livability +2.5/5.0
- Condition / age +2.5/5.0
- 1% rule +1.4/10.0
- DSCR +0.5/10.0
$250,000
🖨 Deal sheet (PDF) 📄 Offer letter ✓ Due diligence
Listing remarks
Home is fantastic looking with a large Family room that flows into big open Kitchen with glass from ceiling to floor large island with seats one side. Reset lights and pin lights over island. Large laundry room with folding shelf, sink and storage great for washing pets. Large master bathroom with Garden tub and standup separate shower with two heads Disclaimer: CMLS has not reviewed and, therefore, does not endorse vendors who may appear in listings.
Key facts
- Laundry room
- Family room
- Large island
Tags
Property features AI
Finance
- Other:
- Financial info:
- HOA & community:
Exterior
- Parking:
- Security:
- Utilities: Well water; Septic sewer; Storm doors and storm windows
- Home design: Single-story home
- Construction: Crawlspace foundation
- Exterior features: Vinyl exterior finish; Dirt road access
Interior
- Kitchen: Eat-in kitchen with island; Formica countertops and painted cabinets; Built-in microwave; Dishwasher; Refrigerator; Icemaker; Free-standing smooth-surface range
- Bedrooms: Master suite on the main level with double vanity, garden tub, private bath, separate shower, walk-in closet and spa/multiple-head shower; Two additional bedrooms on the main level, each with ceiling fans
- Flooring: Luxury vinyl plank in main living areas and kitchen; Carpet in bedroom areas; Vinyl flooring in some areas
- Bathrooms: Two full bathrooms
- Heating & cooling: Central cooling; Central electric heating
- Interior features: Ceiling fans throughout; Smoke detector; Electric fireplace; Fireplace with molding and recessed lights in the living area; Recessed lighting
- Laundry & utility: Main-level mud room laundry
Neighborhood map
What this means for you Summary
Snapshot
- This is a 3-bed/2.0-bath manufactured listed at $250k.
Deal economics
- At list price, monthly cash flow is $-464 ($-6k/yr) — negative.
- To cash-flow at today's rent, offer at most $183k (26.8% below list).
- To meet the 1% rule (rent ≥ 1% of price), the offer needs to be $160k (36.0% below list).
- Recommended offer: $160k (36.0% below list) — sets the bar for 1% rule.
Location & tenants
- Location reads: area grade D — affects rentability + tenant quality, not the cash-flow math above.
- Lexington 01 (suburban): math 42% / reading 53% proficiency, ranked #11 of 80 in SC (top 14%) — families likely to look elsewhere, expect single-tenant / working-renter base with shorter leases.
- Zoned schools: Gilbert Elementary (math 33% / reading 26%, grade F, #399 of 597 statewide, top 69%, 768 students, 45% FRL); Gilbert Middle (math 26% / reading 36%, grade F, #128 of 229 statewide, top 58%, 822 students, 40% FRL); Gilbert High (math 37% / reading 83%, grade C+, #109 of 196 statewide, top 55%, 1,118 students, 38% FRL).
- Market conditions: 170 active listings in the ZIP; 1 comparable units currently listed for rent nearby; 1,712 units permitted in Lexington County in 2024 (0 in 5+ unit buildings).
Forward outlook
- In year one you build about $27k of equity ($2k loan paydown + $25k appreciation (10.0% local appreciation)).
- Lexington County population projected at +26% by 2050 — long-run rental-demand tailwind backs the buy-and-hold thesis.
- By year 2, paydown + projected appreciation supports a ~$43k cash-out refi (75% LTV) — recoverable capital for the next deal without selling this one.
Negotiation context
- Only 13 days on market — expect competitive offers; lowballing is unlikely to land.
Questions for the listing agent
- What do current leases actually rent for vs. the listed asking? Can we see a recent rent roll and the last 12 months of T-12 income?
- Is there a deadline driving the sale (1031 exchange, divorce, estate, relocation)? That informs how much negotiation room exists.
- The area grade is low — what's the realistic commute time and amenity access for the typical tenant pool here? Any planned neighborhood developments (good or bad) we should know about?
- What's the average days-on-market for RENTAL listings here right now (not sales)? A rising rental-DOM trend means longer vacancies and softer asking-rent achievability than the comps imply.
- What's the recent tenant-quality profile in this submarket — average credit score on applications, eviction rate, late-payment / NSF rate, and stable-employment percentage? A property-management company in the area should have these aggregated.
- How much new for-sale + rental construction is in the pipeline within 1–3 miles? Heavy new supply typically softens prices + rents 12–24 months out; constrained supply supports both.
Investment metrics
- 1% rule
- 0.64% ✗
- Cap rate
- 4.07%
- Cash-on-cash
- -7.95%
- DSCR
- 0.65
- GRM
- 13.0
CMA / ARV
No comps found within radius.
Projected returns pro-forma
10.0% appreciation · 3.0% rent growth · sell at horizon
- IRR
- 18.7%
- Equity multiple
- 2.52×
- Total profit
- $106,648
- Equity at exit
- $225,220
- IRR
- 17.3%
- Equity multiple
- 5.82×
- Total profit
- $337,333
- Equity at exit
- $485,695
Cash invested: $70,000 (down + closing). Projections, not guarantees.
Landlord ↔ Tenant lean methodology
- Overall (STATE)
- 90 Strongly Landlord-Friendly
- State South Carolina
- 90 Strongly Landlord-Friendly · R+6
- County
- — inherits STATE
- City
- — inherits STATE
ZIP-level market 29070
- Home prices YoY
- 3.2%
- Active inventory
- 170
- Price-to-rent
- 13.0×
Monthly cashflow live
- Estimated rent
- $1,600 medium interval (Pro) →
- Mortgage (P&I)
- −$1,311
- Tax est. 1.5%
- −$312 /mo · $3,750/yr
- Insurance
- −$104
- HOA
- −$0
- Vacancy / Maint / Mgmt
- −$336
- Net cashflow
- $-464
Break-even live
Sensitivity live
| Price | -10% $-291 | -5% $-377 | +0% $-464 | +5% $-550 | +10% $-636 |
|---|---|---|---|---|---|
| Rent | -10% $-590 | -5% $-527 | +0% $-464 | +5% $-400 | +10% $-337 |
| Rate | -1.0pp $-338 | -0.5pp $-400 | base $-464 | +0.5pp $-528 | +1.0pp $-594 |
UW: 25.0% down · 7.5% · 30yr · 1.5% tax · 5.0% vac · 8.0% maint · 8.0% mgmt
Financing live
Cash to close
- Down payment
- $62,500
- Closing costs
- $7,500
- Reserves months
- —
- Total cash needed
- —
Loan-product check · same deal, 3 products live
Conventional
25% down · 7.5% · 30yr
- Down + closing
- —
- Monthly P&I
- —
- Monthly cashflow
- —
- DSCR
- —
- Eligible?
- —
Personal DTI + credit; lowest rate.
DSCR
20% down · 8.5% · 30yr
- Down + closing
- —
- Monthly P&I
- —
- Monthly cashflow
- —
- DSCR
- —
- Eligible?
- —
No personal income docs; deal must DSCR.
Hard money
10% down · 12.0% · 12mo
- Down + closing
- —
- Monthly P&I
- —
- Monthly cashflow
- —
- DSCR
- —
- Eligible?
- —
Short-term bridge; refi at stabilization.
Rent comps 1 comps
| Address | Beds | Baths | Sqft | Rent | $/sqft | DOM | Units | Dist |
|---|---|---|---|---|---|---|---|---|
| 1994 Neely Wingard Rd Gilbert, SC | 3.0 | 2.0 | 1792 | $1,600 | $0.89 | 5d | 1 | 1.03mi |
Listing history 2 events
-
2026-05-12status Pending
-
2026-04-27$250,000 Active
ⓘ Source: listings_history table (triggers on properties + properties_extension) + one-shot
backfill from property_details.listing_events for pre-trigger history.
Nearby sold comps map
Loading sold comps map…
Walkable amenities ~0.75 mi
Loading nearby amenities…
Taxation est. · year 1
- Rental income
- $19,200
- − Mortgage interest
- −$14,004
- − Property taxes
- −$3,750
- − Insurance
- −$1,250
- − Repairs & maintenance
- −$1,536
- − Management
- −$1,536
- − Depreciation
- −$7,273
- Taxable loss
- −$10,149
- Est. tax savings @ 24.0%
- +$2,436
- After-tax cash flow
- $-3,129/yr
For passive investors: Depreciation is non-cash, so a rental often shows a tax loss while cash-flowing — sheltering income. Rental losses are passive: they offset passive income freely, and up to $25,000/yr can offset ordinary (W-2) income if you actively participate and your MAGI is under $100k (phasing out to $0 by $150k); unused losses carry forward. On sale, claimed depreciation is recaptured at up to 25%, and gains may owe capital-gains tax (a 1031 exchange can defer both). Figures are a year-1 estimate at your 24.0% rate — not tax advice; consult a CPA.
Schools (NCES district)
- District
- Lexington 01
- NCES district ID
- 4502700
- Math proficiency
- 42% ▼ -12.00%
- Reading proficiency
- 53% ▼ -2.00%
- Median HH income
- $61,298
- Composite
- 41.75/100
- National rank
- #3399
- State rank
- #11 of 80 in SC
Livability — Fairview Crossroads
No livability data for this city. (Only ~50 U.S. cities are tracked.)
Census & demographics
- Population (ZIP)
- 15,528
Population outlook (Lexington County) Hauer SSP2
- Today (2025)
- 322,999 people
- By 2030
- 342,356 · +6.0%
- By 2040
- 377,715 · +16.9%
- By 2050
- 406,984 · +26.0%
- By 2075
- 465,447 · +44.1%
- By 2100
- 485,674 · +50.4%
Race, ethnicity, and origin ACS 2023
- Neighborhood character
- Predominantly White (76%)
- Race & ethnicity
- White 76% Black 12% Hispanic / Latino 7% Two or more races 6%
- Hispanic origin (detail)
- Mexican 5%
- Common ancestry
- Lithuanian 1% Slovak 1% Italian 1%
- Foreign-born
- 4% · Canada
- Languages at home
- 92% English-only · Spanish 6% Other Indo-European 1%
Political lean MEDSL · Lexington
- 2024 margin
- Solid R (+33.5) · D 32.5% · R 66.0% · Other 1.4%
- 2008→2024 swing
- +4.6pp toward D · 2008: -38.0pp · 2024: -33.5pp
- All cycles
- 2024: R+33.5 2020: R+30.1 2016: R+36.7 2012: R+37.8 2008: R+38.0
Not yet ingested
- Civics
- —
Market trends
- HPI YoY
- ▲ 13.72%
- Current HPI
- 439.77
- Rent YoY
- —
- Metro
- —
- State GDP YoY
- ▲ 4.51%
- F500 in state
- 2
Industry mix (Fortune 500 HQ in SC)
| Industry | F500 HQs | Revenue |
|---|---|---|
| Packaging | 1 | $7B |
|
||
Price history
2 events — show timeline
- 2026-05-12 Pending — Consolidated MLS
- 2026-04-27 Listed $250,000 Consolidated MLS
Cash-flow waterfall
monthlySold comps — $/sqft
last 12 mo · ≤1 miLoading sold comps…