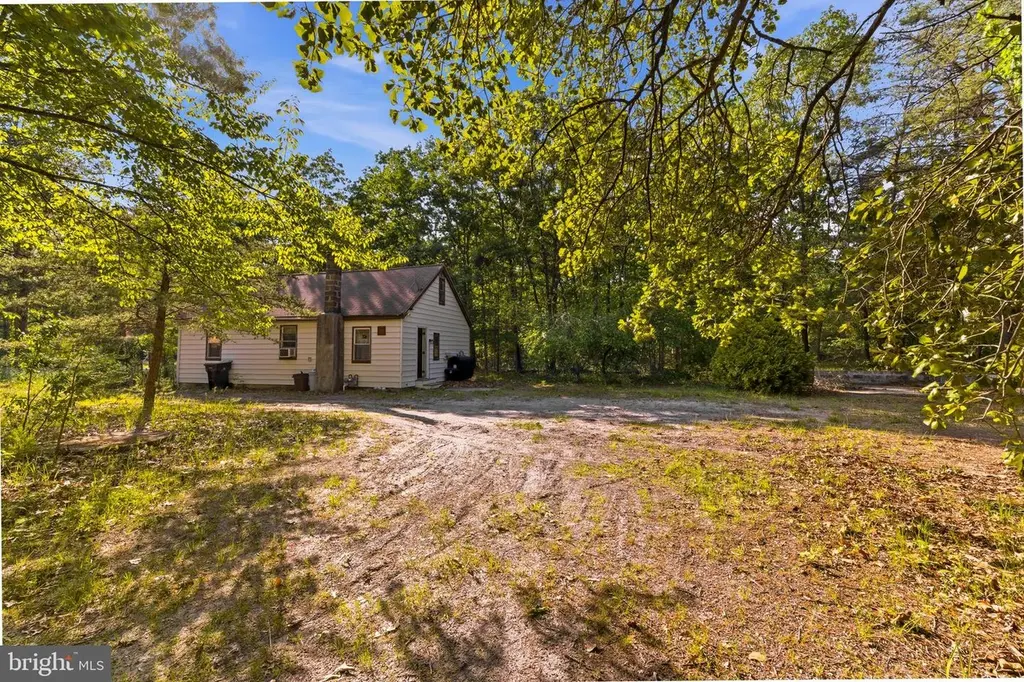
988 New Brooklyn Rd · Sicklerville, NJ
Flood risk 3/10 · Minor
- FEMA flood zone
- X (unshaded)
- Chance of flooding over 30 yrs
- 0.2%
- Est. flood insurance / yr
- $507 – $1,088
Fire risk 4/10 · Minor
- Est. fire insurance / yr
- $526 – $976
Heat risk 6/10 · Moderate
- Hot days now (above 103°F)
- 7 days/yr
- Hot days in 30 yrs
- 15 days/yr
Wind risk 6/10 · Moderate
- Chance of severe wind over 30 yrs
- 61.0%
Air-quality risk 3/10 · Minor
- Unhealthy air days now
- 3 days/yr
- Unhealthy air days in 30 yrs
- 3 days/yr
Risk factors via First Street. Map © Google.
Why this score? — see what drove the B- grade
The composite is a weighted blend of 9 inputs, each scored 0–100. Each bar is that input's sub-score; the figure is the points it added to the 100-point composite (weight × sub-score).
- Cash flow +28.9/30.0
- DSCR +10.0/10.0
- 1% rule +8.5/10.0
- ARV discount +7.5/15.0
- Rent growth +3.4/5.0
- Schools +2.6/10.0
- Livability +2.5/5.0
- Condition / age +2.5/5.0
- Appreciation +0.0/10.0
$179,900
🖨 Deal sheet 📄 Offer letter ✓ Due diligence
Listing remarks MLS
Attention investors and developers! Rare opportunity to transform this property situated on over an acre of land with endless potential for redevelopment, expansion, or a complete custom renovation. Whether you’re looking for your next investment project or the perfect site to build new, this property offers the space and flexibility to bring your vision to life. Conveniently located near major roadways, shopping, dining, and local amenities, this is a prime chance to capitalize on a large parcel in a desirable location. Property being sold strictly as-is. Building materials in home cabinets etc. come with sale. Buyer responsible for all inspections, certifications, and due diligence. Sewer is available on the street.
Key facts
- Desirable location
- Over an acre of land
- 1.3 acre lot
Tags
Property features AI
Finance
- Other: Fee simple ownership; Year built source: Assessor; Above-grade finished area approximately 1,300 (estimated); Below-grade area reported as 0; Land and improvement assessed values reported
Exterior
- Parking: Driveway
- Utilities: Well water; Septic system
- Home design: Frame construction
- Construction: Frame construction; Other foundation; Detached structure
- Exterior features: Detached property; Other structures above and below grade; No tidal water
Interior
- Bedrooms: Two bedrooms on the main level; One bedroom on the upper level
- Bathrooms: One full bathroom on the main level; One full bathroom total
- Heating & cooling: Oil heating; Oil hot water
- Interior features: Estimated living area; Full basement
Neighborhood map
What this means for you Summary
Snapshot
- This is a 3-bed/1.0-bath single-family listed at $180k.
Deal economics
- At list price, monthly cash flow is $609 ($7k/yr) — positive.
- The deal already cash-flows at list — no discount required.
- Meets the 1% rule at list price ($2k rent vs $180k).
- Recommended offer: $177k (1.5% below list) — sets the bar for market timing.
- Cap rate 10.4% vs local median 4.7% in Sicklerville — top-decile yield for the area; either an underpriced asset or a hidden risk that comps aren't pricing in. Stress-test before assuming the spread holds.
Location & tenants
- Location reads: area grade B — affects rentability + tenant quality, not the cash-flow math above.
- Gloucester Township Public Schools (suburban): math 14% / reading 41% proficiency, ranked #351 of 472 in NJ (top 74%) — low school quality limits family demand, transient renter base, plan for 1-2y turnover.
- Market conditions: Rents rising (+3.4%/yr); 329 active listings in the ZIP; solid renter incomes; 1,018 units permitted in Camden County in 2024 (509 in 5+ unit buildings).
Forward outlook
- Local home prices are declining (-3.0%/yr); year-one equity from $1k of loan paydown is wiped out by about $5k of value loss. Plan a longer hold.
- Camden County population projected to shrink 8% by 2050 — rents likely to lag national; underwrite the cash flow, not the appreciation.
- At projected returns (-3.0% appreciation + 3.4% rent growth), your $50k cash investment doubles in ~8 years — after that, you're playing with house money.
Negotiation context
- It's been on market 28 days — a 2% lower offer ($177k) is reasonable based on typical stale-listing flexibility.
- 6 sale attempts since 26y ago; this cycle's ask has dropped $21k (10%) from the opening price — seller is motivated, your offer sets the floor, not the list.
- Current owner paid $65k; list at $180k implies a 177% gain — meaningful room to come down on a strong offer.
Risks & watch-outs
- Watch-outs: built in 1947 — expect roof / HVAC / electrical / plumbing capex.
- Climate carrying-cost: major wind risk, 61% chance of damaging wind over 30y; extreme-heat days projected 7→15/yr by 2055 (HVAC capex compounding) — expect insurance premiums to compound above CPI over the hold.
Questions for the listing agent
- Built in 1947 — when were the roof, HVAC, electrical panel, plumbing, and water heater last replaced?
- Is there a deadline driving the sale (1031 exchange, divorce, estate, relocation)? That informs how much negotiation room exists.
- What's the average days-on-market for RENTAL listings here right now (not sales)? A rising rental-DOM trend means longer vacancies and softer asking-rent achievability than the comps imply.
- What's the recent tenant-quality profile in this submarket — average credit score on applications, eviction rate, late-payment / NSF rate, and stable-employment percentage? A property-management company in the area should have these aggregated.
- How much new for-sale + rental construction is in the pipeline within 1–3 miles? Heavy new supply typically softens prices + rents 12–24 months out; constrained supply supports both.
Investment metrics
- 1% rule
- 1.35% ✓
- Cap rate
- 10.36%
- Cash-on-cash
- 14.51%
- DSCR
- 1.65
- GRM
- 6.2
CMA / ARV
No comps found within radius.
Projected returns pro-forma
-3.0% appreciation · 3.41% rent growth · sell at horizon
- IRR
- 5.5%
- Equity multiple
- 1.21×
- Total profit
- $10,736
- Equity at exit
- $26,824
- IRR
- 15.3%
- Equity multiple
- 2.27×
- Total profit
- $63,814
- Equity at exit
- $15,554
Cash invested: $50,372 (down + closing). Projections, not guarantees.
Landlord ↔ Tenant lean methodology
- Overall (STATE)
- 21 Tenant-Leaning
- State New Jersey
- 21 Tenant-Leaning · D+6
- County
- — inherits STATE
- City
- — inherits STATE
ZIP-level market 08081
- Rents YoY
- 3.4%
- Active inventory
- 329
- Price-to-rent
- 6.2×
Monthly cashflow live
- Estimated rent
- $2,437 medium interval (Pro) →
- Mortgage (P&I)
- −$943
- Tax from tax record
- −$298 /mo · $3,571/yr
- Insurance
- −$75
- HOA
- −$0
- Vacancy / Maint / Mgmt
- −$512
- Net cashflow
- $609
Break-even live
UW: 25.0% down · 7.5% · 30yr · 1.5% tax · 5.0% vac · 8.0% maint · 8.0% mgmt
Financing live
Cash to close
- Down payment
- $44,975
- Closing costs
- $5,397
- Reserves months
- —
- Total cash needed
- —
Loan-product check · same deal, 3 products live
Conventional
25% down · 7.5% · 30yr
- Down + closing
- —
- Monthly P&I
- —
- Monthly cashflow
- —
- DSCR
- —
- Eligible?
- —
Personal DTI + credit; lowest rate.
DSCR
20% down · 8.5% · 30yr
- Down + closing
- —
- Monthly P&I
- —
- Monthly cashflow
- —
- DSCR
- —
- Eligible?
- —
No personal income docs; deal must DSCR.
Hard money
10% down · 12.0% · 12mo
- Down + closing
- —
- Monthly P&I
- —
- Monthly cashflow
- —
- DSCR
- —
- Eligible?
- —
Short-term bridge; refi at stabilization.
Listing history 25 events
-
2026-06-18days on market $179,900 Active 28 DOM
-
2026-06-17days on market $179,900 Active 27 DOM
-
2026-06-16days on market $179,900 Active 26 DOM
-
2026-06-15days on market $179,900 Active 25 DOM
-
2026-06-13days on market $179,900 Active 23 DOM
-
2026-06-13pricedays on market $179,900 Active 22 DOM
-
2026-06-09days on market $190,000 Active 19 DOM
-
2026-06-08days on market $190,000 Active 18 DOM
-
2026-06-07days on market $190,000 Active 17 DOM
-
2026-06-04pricedays on market $190,000 Active 14 DOM
-
2026-06-03days on market $200,900 Active 13 DOM
-
2026-06-02days on market $200,900 Active 12 DOM
-
2026-06-01days on market $200,900 Active 11 DOM
-
2026-05-31days on market $200,900 Active 10 DOM
-
2026-05-22$200,900 Active 735-char remark
Show marketing remark (735 chars)
Attention investors and developers! Rare opportunity to transform this property situated on over an acre of land with endless potential for redevelopment, expansion, or a complete custom renovation. Whether you’re looking for your next investment project or the perfect site to build new, this property offers the space and flexibility to bring your vision to life. Conveniently located near major roadways, shopping, dining, and local amenities, this is a prime chance to capitalize on a large parcel in a desirable location. Property being sold strictly as-is. Building materials in home cabinets etc. come with sale. Buyer responsible for all inspections, certifications, and due diligence. Sewer is available on the street.
-
2026-05-21$200,900 Active
-
2011-12-07soldstatus $65,000
-
2010-10-01historical
-
2009-07-31$72,000
-
2009-02-28historical
-
2008-08-30$90,000
-
2003-10-15historical
-
2003-04-14$90,000
-
2001-10-30historical
-
2000-04-28$86,900
ⓘ Source: listings_history table (triggers on properties + properties_extension) + one-shot
backfill from property_details.listing_events for pre-trigger history.
Tax reassessment forecast NJ · Partial reset (capped growth)
- Current annual tax
- $3,571 · $298/mo
- Projected year-2 tax
- $4,025 · $335/mo
- Expected delta
- +$454/yr (+$38/mo · 12.7%)
ⓘ Screening estimate from a state-policy table — verify with the county assessor before closing.
Climate risk First Street
- Flood 3/10 Moderate FEMA zone X (unshaded) · 20% chance over 30 yrs
- Wildfire 4/10 Moderate
- Heat 6/10 Major 7 d/yr ≥103°F today · 15 d/yr by 30 yrs out
- Wind 6/10 Major 61% chance of damaging wind over 30 yrs
- Air quality 3/10 Moderate 3 unhealthy d/yr today · 3 by 30 yrs out
Nearby sold comps map
Loading sold comps map…
Walkable amenities ~0.75 mi
Loading nearby amenities…
Taxation est. · year 1
- Rental income
- $29,243
- − Mortgage interest
- −$10,077
- − Property taxes
- −$3,571
- − Insurance
- −$900
- − Repairs & maintenance
- −$2,339
- − Management
- −$2,339
- − Depreciation
- −$5,233
- Taxable income
- $4,782
- Est. tax owed @ 24.0%
- −$1,148
- After-tax cash flow
- $6,162/yr
For passive investors: Depreciation is non-cash, so a rental often shows a tax loss while cash-flowing — sheltering income. Rental losses are passive: they offset passive income freely, and up to $25,000/yr can offset ordinary (W-2) income if you actively participate and your MAGI is under $100k (phasing out to $0 by $150k); unused losses carry forward. On sale, claimed depreciation is recaptured at up to 25%, and gains may owe capital-gains tax (a 1031 exchange can defer both). Figures are a year-1 estimate at your 24.0% rate — not tax advice; consult a CPA.
Schools (NCES district)
- District
- Gloucester Township Public Schools
- NCES district ID
- 3406030
- Math proficiency
- 14% ▼ -28.00%
- Reading proficiency
- 41% ▼ -13.00%
- Median HH income
- $72,539
- Composite
- 26.18/100
- National rank
- #7269
- State rank
- #351 of 472 in NJ
Livability — Sicklerville
No livability data for this city. (Only ~50 U.S. cities are tracked.)
Census & demographics
- Census place
- Sicklerville, NJ
- County
- Camden County · 407,624 people
- City population
- 50,264
- Metro
- Philadelphia-Camden-Wilmington, PA-NJ-DE-MD
- Population (ZIP)
- 50,264
- Household income
- $105,800
- Rent vs Own
- Severe rent burden
- 979.0
Population outlook (Camden County) Hauer SSP2
- Today (2025)
- 507,964 people
- By 2030
- 502,182 · -1.1%
- By 2040
- 485,602 · -4.4%
- By 2050
- 465,630 · -8.3%
- By 2075
- 419,986 · -17.3%
- By 2100
- 369,492 · -27.3%
Race, ethnicity, and origin ACS 2023
- Neighborhood character
- Diverse neighborhood (Simpson 0.65)
- Race & ethnicity
- White 47% Black 34% Two or more races 9% Hispanic / Latino 9% Asian 4%
- Hispanic origin (detail)
- Puerto Rican 5%
- Common ancestry
- Romanian 6% Slovak 2% Iranian 1%
- Foreign-born
- 8% · Canada, China, South Korea
- Languages at home
- 90% English-only · Spanish 4% Other Indo-European 1% Tagalog/Filipino 1%
Political lean MEDSL · Camden
- 2024 margin
- Strong D (+27.4) · D 63.0% · R 35.5% · Other 1.5%
- 2008→2024 swing
- -8.8pp toward R · 2008: 36.2pp · 2024: 27.4pp
- All cycles
- 2024: D+27.4 2020: D+33.5 2016: D+32.4 2012: D+36.6 2008: D+36.2
Not yet ingested
- Civics
- —
Market trends
- HPI YoY
- ▼ -176.48%
- Current HPI
- 303.1017
- Rent YoY
- ▲ 3.41%
- Metro
- Philadelphia-Camden-Wilmington, PA-NJ-DE-MD
- State GDP YoY
- ▲ 2.05%
- F500 in state
- 34
Industry mix (Fortune 500 HQ in NJ)
| Industry | F500 HQs | Revenue |
|---|---|---|
| Consumer Goods | 3 | $31B |
|
||
| Pharmaceuticals | 2 | $153B |
|
||
| Technology | 2 | $21B |
|
||
| Insurance | 2 | $20B |
|
||
| Healthcare | 2 | $19B |
|
||
| Financial Services | 1 | $70B |
|
||
Price history
+131.2% since first listed11 events — show timeline
- 2026-05-22 Listed $200,900 BRIGHT MLS
- 2026-05-21 Listed $200,900 BRIGHT MLS
- 2011-12-07 Sold (Public Records) $65,000 Public Records
- 2010-10-01 Listing Removed — BRIGHT MLS
- 2009-07-31 Listed $72,000 BRIGHT MLS
- 2009-02-28 Listing Removed — BRIGHT MLS
- 2008-08-30 Listed $90,000 BRIGHT MLS
- 2003-10-15 Listing Removed — BRIGHT MLS
- 2003-04-14 Listed $90,000 BRIGHT MLS
- 2001-10-30 Listing Removed — BRIGHT MLS
- 2000-04-28 Listed $86,900 BRIGHT MLS
Property tax history
+1.1%/yrLatest (2025): $3,571 · +1.9% YoY. Source: county tax records.
Cash-flow waterfall
monthlySold comps — $/sqft
last 12 mo · ≤1 miLoading sold comps…