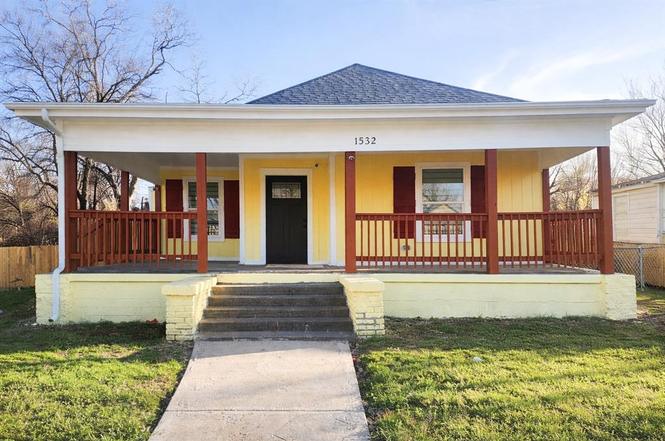
1532 E Myrtle St · Fort Worth, TX
Flood risk 1/10 · Minimal
- FEMA flood zone
- X (unshaded)
- Chance of flooding over 30 yrs
- 0.0%
- Est. flood insurance / yr
- $507 – $1,088
Fire risk 1/10 · Minimal
- Est. fire insurance / yr
- $1,222 – $2,270
Heat risk 8/10 · Major
- Hot days now (above 109°F)
- 7 days/yr
- Hot days in 30 yrs
- 23 days/yr
Wind risk 4/10 · Minor
- Chance of severe wind over 30 yrs
- 24.0%
Air-quality risk 3/10 · Minor
- Unhealthy air days now
- 3 days/yr
- Unhealthy air days in 30 yrs
- 4 days/yr
Risk factors via First Street. Map © Google.
Why this score? — see what drove the D grade
The composite is a weighted blend of 9 inputs, each scored 0–100. Each bar is that input's sub-score; the figure is the points it added to the 100-point composite (weight × sub-score).
- Cash flow +15.8/30.0
- ARV discount +8.5/15.0
- DSCR +4.9/10.0
- Livability +4.0/5.0
- 1% rule +3.8/10.0
- Rent growth +2.5/5.0
- Condition / age +2.5/5.0
- Schools +2.0/10.0
- Appreciation +0.0/10.0
$184,990
🖨 Deal sheet 📄 Offer letter ✓ Due diligence
Listing remarks
Completely remodeled. Welcome yourself to this beautiful 1100 sq feet home, featuring 10ft ceilings, new vinyl flooring, granite counter tops, white tile backsplash, new window and blinds, with the perfect walk-in shower. New fence has been installed to allow you privacy in the backyard while the front covered patio porch delivers space and warmth to this home. This wonderful 2-bedroom 1 bath is a complete turn-key home. Text agent for quicker response.
Key facts
- Remodeled
- Vinyl flooring
- Walk-in shower
Tags
Property features AI
Finance
- Other: Listing broker: Coldwell Banker Realty; Listing agent: Lisa Lee; Photos available
- Financial info: Listing terms: Cash, Conventional, FHA, VA; Listing agreement: Exclusive right to sell; Transaction type: For sale; Special listing conditions: Standard; Possession at closing/funding
- HOA & community: No HOA / association
Exterior
- Parking: Asphalt parking
- Security: Audio and video recording permitted on premises
- Utilities: City water; City sewer; No municipal utility district
- Home design: Single family residence; One story; Interior lot; Subdivision: Lakeview Add; Restrictions: Deed
- Construction: Built in 1925; Siding exterior; Composition roof; Preowned
- Exterior features: Private yard; Back yard fencing (chain link); Covered patio/porch; Deck; Front porch; Cleared vegetation; Clay soil
Interior
- Kitchen: Electric cooktop; Electric oven
- Bedrooms: 2 bedrooms (both on the main level)
- Flooring: Vinyl flooring
- Bathrooms: 1 full bathroom
- Heating & cooling: Central heating; Central air; Ceiling fan(s)
- Interior features: Open floorplan; Eat-in kitchen; Granite counters; Pantry; One living area; One dining area; Room count: 4
- Laundry & utility: Utility room with full-size washer/dryer area
Neighborhood map
What this means for you Summary
Snapshot
- This is a 3-bed/1.0-bath single-family listed at $185k.
Deal economics
- At list price, monthly cash flow is $86 ($1k/yr) — positive.
- The deal already cash-flows at list — no discount required.
- To meet the 1% rule (rent ≥ 1% of price), the offer needs to be $164k (11.6% below list).
- Recommended offer: $164k (11.6% below list) — sets the bar for 1% rule.
- Cap rate 6.9% vs local median 3.9% in Fort Worth — top-decile yield for the area; either an underpriced asset or a hidden risk that comps aren't pricing in. Stress-test before assuming the spread holds.
Location & tenants
- Location reads 80/100 on livability (#49 in TX, #1,954 nationally) — a professional / high-income tenant draw. Strengths: amenities A+, cost of living A+, housing A+; Watch: schools D+, crime F.
- Fort Worth ISD (urban): math 18% / reading 28% proficiency, ranked #742 of 826 in TX (top 90%) — low school quality limits family demand, transient renter base, plan for 1-2y turnover; 73% free/reduced lunch — lower-income household profile, screen leases tightly.
- Market conditions: Rents flat; 172 active listings in the ZIP; 40 comparable units currently listed for rent nearby; rentals at typical pace (median 24d on market — plan ~3-4 weeks tenant-placement turnaround); 42% of comp listings sitting > 30 days — soft ceiling on asking rent; 18,938 units permitted in Tarrant County in 2024 (8,336 in 5+ unit buildings).
- This rent runs 32% of the median local income ($62k/yr) — at the standard rent-burdened threshold; future hikes will face affordability resistance.
Forward outlook
- Local home prices are declining (-3.0%/yr); year-one equity from $1k of loan paydown is wiped out by about $6k of value loss. Plan a longer hold.
- Tarrant County population projected at +41% by 2050 — long-run rental-demand tailwind backs the buy-and-hold thesis.
Negotiation context
- It's been on market 63 days — a 6% lower offer ($174k) is reasonable based on typical stale-listing flexibility.
Risks & watch-outs
- Watch-outs: built in 1925 — expect roof / HVAC / electrical / plumbing capex.
- Climate carrying-cost: extreme-heat days projected 7→23/yr by 2055 (HVAC capex compounding) — expect insurance premiums to compound above CPI over the hold.
Questions for the listing agent
- It's been on market 63 days. Have you received any prior offers? Is the seller open to a 12% concession, seller financing, or rate buy-down credit?
- Built in 1925 — when were the roof, HVAC, electrical panel, plumbing, and water heater last replaced?
- Why hasn't it sold? Are there any deal-killer items the seller is aware of (foundation, flood, title, zoning, code violations)?
- Is there a deadline driving the sale (1031 exchange, divorce, estate, relocation)? That informs how much negotiation room exists.
- Schools are D-rated, which usually means shorter tenancies and higher turnover. Who's the typical renter profile here, and what's been the actual vacancy rate?
- Crime grade is F in this area — have there been break-ins, vandalism, or insurance claims at this property in the last 3 years? What carrier currently insures it and at what premium?
- The area grade is low — what's the realistic commute time and amenity access for the typical tenant pool here? Any planned neighborhood developments (good or bad) we should know about?
- What's the average days-on-market for RENTAL listings here right now (not sales)? A rising rental-DOM trend means longer vacancies and softer asking-rent achievability than the comps imply.
- What's the recent tenant-quality profile in this submarket — average credit score on applications, eviction rate, late-payment / NSF rate, and stable-employment percentage? A property-management company in the area should have these aggregated.
- How much new for-sale + rental construction is in the pipeline within 1–3 miles? Heavy new supply typically softens prices + rents 12–24 months out; constrained supply supports both.
Investment metrics
- 1% rule
- 0.88% ✗
- Cap rate
- 6.85%
- Cash-on-cash
- 1.99%
- DSCR
- 1.09
- GRM
- 9.4
CMA / ARV
- ARV (on-the-fly)
- $189,200
- Comps found
- 12
Show comp detail 12 sales within ~0.75 mi
| Address | Dist | Beds/Ba | Sqft | Sold | Price | $/sf | Match |
|---|---|---|---|---|---|---|---|
| 1532 E Myrtle St | 0.00mi | 2/1.0 (-1) | 1,100 (0%) | 1mo | $184,990 | $168 | 94 |
| 1507 E Maddox Ave | 0.04mi | 3/2.5 | 1,120 (+2%) | 5mo | $199,000 | $178 | 85 |
| 1431 E Baltimore Ave | 0.34mi | 3/2.0 | 1,032 (-6%) | 6mo | $165,000 | $160 | 65 |
| 1917 Avenue B | 0.56mi | 2/1.0 (-1) | 1,102 (+0%) | 6mo | $204,900 | $186 | 63 |
| 1315 Stewart St | 0.72mi | 3/1.5 | 1,065 (-3%) | 1mo | $190,000 | $178 | 58 |
| 1423 E Davis Ave | 0.47mi | 3/1.0 | 1,000 (-9%) | 7mo | $229,000 | $229 | 58 |
| 1101 Freeman St | 0.42mi | 3/2.0 | 1,222 (+11%) | 8mo | $227,500 | $186 | 52 |
| 943 E Richmond Ave | 0.72mi | 2/1.0 (-1) | 1,046 (-5%) | 2mo | $175,000 | $167 | 51 |
| 1415 E Terrell Ave | 0.57mi | 2/2.0 (-1) | 1,008 (-8%) | 2mo | $170,000 | $169 | 49 |
| 941 E Baltimore Ave | 0.75mi | 2/1.0 (-1) | 1,008 (-8%) | 0mo | $100,000 | $99 | 46 |
| 1420 Driess St | 0.68mi | 3/2.0 | 1,213 (+10%) | 7mo | $200,000 | $165 | 41 |
| 1601 E Cannon St | 0.67mi | 3/2.0 | 1,250 (+14%) | 6mo | $214,999 | $172 | 37 |
Match score weights: distance 35% · size 25% · config 20% · recency 20%. Top-matched comps best support the ARV.
Projected returns pro-forma
-3.0% appreciation · 0.05% rent growth · sell at horizon
- IRR
- -16.3%
- Equity multiple
- 0.44×
- Total profit
- $-29,230
- Equity at exit
- $27,583
- IRR
- -14.1%
- Equity multiple
- 0.29×
- Total profit
- $-36,715
- Equity at exit
- $15,995
Cash invested: $51,797 (down + closing). Projections, not guarantees.
Landlord ↔ Tenant lean methodology
- Overall (STATE)
- 87 Strongly Landlord-Friendly
- State Texas
- 87 Strongly Landlord-Friendly · R+5
- County
- — inherits STATE
- City
- — inherits STATE
ZIP-level market 76104
- Home prices YoY
- -11.6%
- Rents YoY
- 0.1%
- Active inventory
- 172
- Price-to-rent
- 9.4×
Monthly cashflow live
- Estimated rent
- $1,635 high interval (Pro) →
- Mortgage (P&I)
- −$970
- Tax from tax record
- −$159 /mo · $1,903/yr
- Insurance
- −$77
- HOA
- −$0
- Vacancy / Maint / Mgmt
- −$343
- Net cashflow
- $86
Break-even live
UW: 25.0% down · 7.5% · 30yr · 1.5% tax · 5.0% vac · 8.0% maint · 8.0% mgmt
Financing live
Cash to close
- Down payment
- $46,248
- Closing costs
- $5,550
- Reserves months
- —
- Total cash needed
- —
Loan-product check · same deal, 3 products live
Conventional
25% down · 7.5% · 30yr
- Down + closing
- —
- Monthly P&I
- —
- Monthly cashflow
- —
- DSCR
- —
- Eligible?
- —
Personal DTI + credit; lowest rate.
DSCR
20% down · 8.5% · 30yr
- Down + closing
- —
- Monthly P&I
- —
- Monthly cashflow
- —
- DSCR
- —
- Eligible?
- —
No personal income docs; deal must DSCR.
Hard money
10% down · 12.0% · 12mo
- Down + closing
- —
- Monthly P&I
- —
- Monthly cashflow
- —
- DSCR
- —
- Eligible?
- —
Short-term bridge; refi at stabilization.
Rent comps 40 comps
| Address | Beds | Baths | Sqft | Rent | $/sqft | DOM | Units | Dist |
|---|---|---|---|---|---|---|---|---|
| 1516 E Maddox Ave Fort Worth, TX | 3.0 | 2.0 | 1485 | $1,895 | $1.28 | 22d | 1 | 0.09mi |
| 1605 E Morphy St Fort Worth, TX | 3.0 | 2.0 | 1090 | $1,425 | $1.31 | 2d | 1 | 0.09mi |
| 1327 E Baltimore Ave Fort Worth, TX | 3.0 | 2.0 | 1426 | $1,650 | $1.16 | 24d | 1 | 0.40mi |
| 2104 Daniel St Fort Worth, TX | 3.0 | 2.0 | 1440 | $1,675 | $1.16 | 43d | 1 | 0.44mi |
| 1601 E Leuda St Fort Worth, TX | 3.0 | 2.0 | 1197 | $1,750 | $1.46 | 43d | 1 | 0.61mi |
| 1718 E Powell Ave Fort Worth, TX | 2.0 | 1.5 | 930 | $1,655 | $1.78 | 43d | 1 | 0.66mi |
| 1521 E Cannon St Fort Worth, TX | 2.0 | 2.0 | 1140 | $1,600 | $1.40 | 43d | 1 | 0.66mi |
| 1228 E Leuda St Fort Worth, TX | 3.0 | 2.0 | 1388 | $2,100 | $1.51 | 43d | 1 | 0.67mi |
| 1016 E Arlington Ave Unit C Fort Worth, TX | 2.0 | 1.0 | 918 | $995 | $1.08 | 16d | 1 | 0.73mi |
| 1017 E Humbolt St Fort Worth, TX | 2.0 | 2.0 | 1400 | $1,550 | $1.11 | 43d | 1 | 0.74mi |
| 612 Luxton St Unit 202 Fort Worth, TX | 2.0 | 1.0 | 900 | $1,095 | $1.22 | 43d | 1 | 0.78mi |
| 1429 E Robert St Fort Worth, TX | 3.0 | 2.0 | 1050 | $1,350 | $1.29 | 22d | 1 | 0.89mi |
| 940 E Hattie St Unit 202 Fort Worth, TX | 2.0 | 1.0 | 825 | $900 | $1.09 | 43d | 1 | 0.93mi |
| 1608 E Robert St Fort Worth, TX | 3.0 | 2.0 | 1028 | $1,525 | $1.48 | 6d | 1 | 0.93mi |
| 1011 Marion Ave Fort Worth, TX | 2.0 | 1.0 | 1000 | $1,400 | $1.40 | 43d | 1 | 0.97mi |
| 2645 Canberra Ct Fort Worth, TX | 2.0 | 1.0 | 750 | $1,150 | $1.53 | 43d | 1 | 0.99mi |
| 2640 Berryhill Dr Fort Worth, TX | 2.0 | 1.0 | 1478 | $1,299 | $0.88 | 24d | 1 | 1.02mi |
| 921 E Ramsey Ave Fort Worth, TX | 2.0 | 1.0 | 828 | $1,450 | $1.75 | 24d | 1 | 1.03mi |
| 1108 E Robert St Fort Worth, TX | 3.0 | 1.0 | 1444 | $1,825 | $1.26 | 22d | 1 | 1.05mi |
| 1037 Colvin St Fort Worth, TX | 2.0 | 1.0 | 1092 | $1,500 | $1.37 | 19d | 1 | 1.10mi |
| 2705 Belzise Ter Fort Worth, TX | 2.0 | 2.0 | 1160 | $1,450 | $1.25 | 43d | 1 | 1.11mi |
| 901 Bessie St Fort Worth, TX | 2.0 | 1.0 | 710 | $1,149 | $1.62 | 22d | 2 | 1.13mi |
| 1310 Crawford St Fort Worth, TX | 2.0 | 2.0 | 938 | $1,393 | $1.49 | 6d | 1 | 1.14mi |
| 2837 Avenue J Unit J Fort Worth, TX | 3.0 | 1.5 | 1000 | $1,455 | $1.46 | 24d | 1 | 1.24mi |
| 2839 Avenue J Unit J Fort Worth, TX | 3.0 | 1.5 | 1000 | $1,455 | $1.46 | 24d | 1 | 1.24mi |
| 1016 Bryan Ave Unit 102 Fort Worth, TX | 2.0 | 2.5 | 1400 | $2,500 | $1.79 | 24d | 1 | 1.24mi |
| 501A Parkdale Ave Fort Worth, TX | 2.0 | 1.0 | 950 | $1,500 | $1.58 | 43d | 1 | 1.25mi |
| 2909 Avenue K Fort Worth, TX | 3.0 | 2.0 | 1490 | $700 | $0.47 | 43d | 1 | 1.29mi |
| 2912 Avenue K Fort Worth, TX | 3.0 | 1.5 | 1200 | $1,600 | $1.33 | 43d | 1 | 1.30mi |
| 1212 Lowden Cir Fort Worth, TX | 2.0 | 1.0 | 890 | $970 | $1.09 | 43d | 1 | 1.32mi |
| 1516 Chama Dr Fort Worth, TX | 3.0 | 2.0 | 1332 | $1,695 | $1.27 | 20d | 1 | 1.32mi |
| 2825 Bideker Ave Fort Worth, TX | 3.0 | 1.0 | 900 | $1,500 | $1.67 | 24d | 1 | 1.34mi |
| 1925 Saint Louis Ave Fort Worth, TX | 3.0 | 1.0 | 1219 | $1,695 | $1.39 | 43d | 1 | 1.38mi |
| 220 E Broadway Ave Unit 2121 Fort Worth, TX | 2.0 | 2.0 | 1151 | $1,946 | $1.69 | 3d | 1 | 1.39mi |
| 220 E Broadway Ave Unit 257 Fort Worth, TX | 2.0 | 2.0 | 1082 | $1,944 | $1.80 | 43d | 1 | 1.39mi |
| 315 W Magnolia Ave Fort Worth, TX | 2.0 | 1.0–2.0 | 827 | $2,118 | $2.56 | 2d | 40 | 1.39mi |
| 650 S Main St Unit 707 Fort Worth, TX | 2.0 | 2.0 | 1068 | $1,619 | $1.52 | 15d | 1 | 1.40mi |
| 650 S Main St Unit 510 Fort Worth, TX | 2.0 | 2.0 | 1068 | $1,614 | $1.51 | 14d | 1 | 1.40mi |
| 3100 Avenue G Unit 200 Fort Worth, TX | 2.0 | 1.0 | 1000 | $750 | $0.75 | 12d | 1 | 1.41mi |
| 320 E Broadway Ave Fort Worth, TX | 2.0 | 1.0–2.0 | 861 | $2,089 | $2.42 | 1d | 30 | 1.41mi |
Listing history 6 events
-
2026-05-08status Pending
-
2026-04-27historical Active Option Contract
-
2026-03-06$184,990 Active
-
2018-10-09soldstatus
-
2005-05-03soldstatus
-
2001-07-31soldstatus
ⓘ Source: listings_history table (triggers on properties + properties_extension) + one-shot
backfill from property_details.listing_events for pre-trigger history.
Tax reassessment forecast TX · Resets to sale price
- Current annual tax
- $1,903 · $159/mo
- Projected year-2 tax
- $3,385 · $282/mo
- Expected delta
- +$1,482/yr (+$124/mo · 77.9%)
ⓘ Screening estimate from a state-policy table — verify with the county assessor before closing.
Climate risk First Street
- Flood 1/10 Low FEMA zone X (unshaded) · 0% chance over 30 yrs
- Wildfire 1/10 Low
- Heat 8/10 Severe 7 d/yr ≥109°F today · 23 d/yr by 30 yrs out
- Wind 4/10 Moderate 24% chance of damaging wind over 30 yrs
- Air quality 3/10 Moderate 3 unhealthy d/yr today · 4 by 30 yrs out
Nearby sold comps map
Loading sold comps map…
Walkable amenities ~0.75 mi
Loading nearby amenities…
Taxation est. · year 1
- Rental income
- $19,623
- − Mortgage interest
- −$10,362
- − Property taxes
- −$1,903
- − Insurance
- −$925
- − Repairs & maintenance
- −$1,570
- − Management
- −$1,570
- − Depreciation
- −$5,382
- Taxable loss
- −$2,089
- Est. tax savings @ 24.0%
- +$501
- After-tax cash flow
- $1,534/yr
For passive investors: Depreciation is non-cash, so a rental often shows a tax loss while cash-flowing — sheltering income. Rental losses are passive: they offset passive income freely, and up to $25,000/yr can offset ordinary (W-2) income if you actively participate and your MAGI is under $100k (phasing out to $0 by $150k); unused losses carry forward. On sale, claimed depreciation is recaptured at up to 25%, and gains may owe capital-gains tax (a 1031 exchange can defer both). Figures are a year-1 estimate at your 24.0% rate — not tax advice; consult a CPA.
Schools (NCES district)
- District
- Fort Worth ISD
- NCES district ID
- 4819700
- Math proficiency
- 18% ▼ -16.00%
- Reading proficiency
- 28% ▼ -6.00%
- Median HH income
- $42,109
- Composite
- 19.61/100
- National rank
- #8753
- State rank
- #742 of 826 in TX
Livability — Fort Worth
- Score
- 80/100
- State rank
- #49
- US rank
- #1954
Category grades
Schools grade is shown separately in the Schools card above.
Census & demographics
- Census place
- Fort Worth, TX
- County
- Tarrant County · 2,033,669 people
- City population
- 911,619
- Metro
- Dallas-Fort Worth-Arlington, TX
- Population (ZIP)
- 20,443
- Household income
- $61,658
- Rent vs Own
- Severe rent burden
- 1060.0
Population outlook (Tarrant County) Hauer SSP2
- Today (2025)
- 2,380,417 people
- By 2030
- 2,578,900 · +8.3%
- By 2040
- 2,974,995 · +25.0%
- By 2050
- 3,350,489 · +40.8%
- By 2075
- 4,216,909 · +77.2%
- By 2100
- 4,741,527 · +99.2%
Race, ethnicity, and origin ACS 2023
- Neighborhood character
- Diverse neighborhood (Simpson 0.67)
- Race & ethnicity
- Hispanic / Latino 45% Black 28% White 21% Two or more races 17% Asian 2%
- Hispanic origin (detail)
- Mexican 41% Cuban 1%
- Common ancestry
- Lithuanian 1% Italian 1% Arab 1%
- Foreign-born
- 21% · Canada, Vietnam, Philippines
- Languages at home
- 58% English-only · Spanish 37% Arabic 1% Other Indo-European 1%
Political lean MEDSL · Tarrant
- 2024 margin
- Lean R (+5.1) · D 46.7% · R 51.9% · Other 1.4%
- 2008→2024 swing
- +6.6pp toward D · 2008: -11.7pp · 2024: -5.1pp
- All cycles
- 2024: R+5.1 2020: D+0.2 2016: R+8.7 2012: R+15.7 2008: R+11.7
Not yet ingested
- Civics
- —
Market trends
- HPI YoY
- ▼ -36.10%
- Current HPI
- 276.383
- Rent YoY
- ▬ 0.05%
- Metro
- Dallas-Fort Worth-Arlington, TX
- State GDP YoY
- ▲ 3.95%
- F500 in state
- 110
Industry mix (Fortune 500 HQ in TX)
| Industry | F500 HQs | Revenue |
|---|---|---|
| Energy | 16 | $1,198B |
|
||
| Technology | 5 | $198B |
|
||
| Engineering / Construction | 4 | $72B |
|
||
| Energy Services | 3 | $60B |
|
||
| Utilities | 3 | $41B |
|
||
| Healthcare | 2 | $330B |
|
||
Price history
6 events — show timeline
- 2026-05-08 Pending — NTREIS
- 2026-04-27 Contingent — NTREIS
- 2026-03-06 Listed $184,990 NTREIS
- 2018-10-09 Sold (Public Records) — Public Records
- 2005-05-03 Sold (Public Records) — Public Records
- 2001-07-31 Sold (Public Records) — Public Records
Property tax history
+10.0%/yrLatest (2025): $1,903 · -2.4% YoY. Source: county tax records.
Cash-flow waterfall
monthlySold comps — $/sqft
last 12 mo · ≤1 miLoading sold comps…