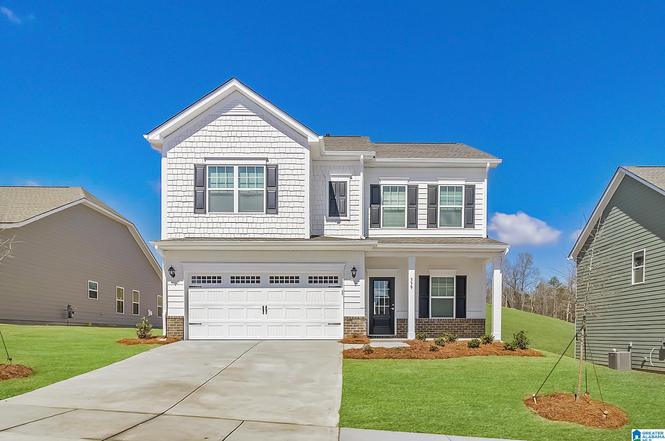
5376 Tailwinds Dr · Bessemer, AL
Flood risk No data
- FEMA flood zone
- —
- Chance of flooding over 30 yrs
- —
- Est. flood insurance / yr
- —
Fire risk No data
- Est. fire insurance / yr
- —
Heat risk No data
- Hot days now (above threshold)
- —
- Hot days in 30 yrs
- —
Wind risk No data
- Chance of severe wind over 30 yrs
- —
Air-quality risk No data
- Unhealthy air days now
- —
- Unhealthy air days in 30 yrs
- —
Risk factors via First Street. Map © Google.
Why this score? — see what drove the D- grade
The composite is a weighted blend of 9 inputs, each scored 0–100. Each bar is that input's sub-score; the figure is the points it added to the 100-point composite (weight × sub-score).
- Cash flow +12.0/30.0
- ARV discount +6.8/15.0
- Rent growth +5.0/5.0
- DSCR +3.5/10.0
- 1% rule +3.4/10.0
- Livability +3.0/5.0
- Condition / age +2.5/5.0
- Schools +0.8/10.0
- Appreciation +0.0/10.0
$285,945
🖨 Deal sheet 📄 Offer letter ✓ Due diligence
Listing remarks
PROPOSED CONSTRUCTION! The Coleman greets you with a covered front porch entry that opens to a welcoming dining room, or study if you prefer. Expansive sight lines across the back of the home connect the family room, breakfast nook, and kitchen with an optional center island. Upstairs you'll find four bedrooms including an owner's suite with a large walk-in closet, a secondary bathroom with compartmentalized space that allows for multiple people to use it at the same time, and a convenient, central laundry room. Pictures are of a similar home. Features will vary
Key facts
- 2 garage spots
- Built 2026
Neighborhood map
What this means for you Summary
Snapshot
- This is a 4-bed/2.5-bath single-family listed at $286k.
Deal economics
- At list price, monthly cash flow is $-69 ($-826/yr) — negative.
- To cash-flow at today's rent, offer at most $276k (3.5% below list).
- To meet the 1% rule (rent ≥ 1% of price), the offer needs to be $241k (15.6% below list).
- Recommended offer: $241k (15.6% below list) — sets the bar for 1% rule.
Location & tenants
- Location reads 59/100 on livability (#331 in AL) — a working-class tenant base; expect higher turnover. Strengths: commute A+, cost of living A+, housing A; Watch: crime F, amenities F, employment F.
- Bessemer City (suburban): math 3% / reading 19% proficiency, ranked #120 of 129 in AL (top 93%) — low school quality limits family demand, transient renter base, plan for 1-2y turnover; 87% free/reduced lunch — lower-income household profile, screen leases tightly.
- Zoned schools: Greenwood Elementary School (math 2% / reading 27%, grade F, #508 of 627 statewide, top 84%, 286 students, 77% FRL); Bessemer City High School (math 2% / reading 8%, grade F, #276 of 305 statewide, top 95%, 850 students, 61% FRL) — zoned schools average 69% FRL vs 87% district-wide (18 pts lower); this property's tenant base skews higher-income than the district average.
- Market conditions: Rents rising fast (+14.8%/yr); 311 active listings in the ZIP; 5 comparable units currently listed for rent nearby; rentals at typical pace (median 16d on market — plan ~3-4 weeks tenant-placement turnaround); solid renter incomes; 2,114 units permitted in Jefferson County in 2024 (556 in 5+ unit buildings).
- This rent runs 35% of the median local income ($82k/yr) — at the standard rent-burdened threshold; future hikes will face affordability resistance.
Forward outlook
- Local home prices are declining (-3.0%/yr); year-one equity from $2k of loan paydown is wiped out by about $9k of value loss. Plan a longer hold.
- Jefferson County population projected to shrink 4% by 2050 — rents likely to lag national; underwrite the cash flow, not the appreciation.
Negotiation context
- Only 0 days on market — expect competitive offers; lowballing is unlikely to land.
Questions for the listing agent
- What do current leases actually rent for vs. the listed asking? Can we see a recent rent roll and the last 12 months of T-12 income?
- Is there a deadline driving the sale (1031 exchange, divorce, estate, relocation)? That informs how much negotiation room exists.
- Schools are D-rated, which usually means shorter tenancies and higher turnover. Who's the typical renter profile here, and what's been the actual vacancy rate?
- Crime grade is F in this area — have there been break-ins, vandalism, or insurance claims at this property in the last 3 years? What carrier currently insures it and at what premium?
- The area grade is low — what's the realistic commute time and amenity access for the typical tenant pool here? Any planned neighborhood developments (good or bad) we should know about?
- What's the average days-on-market for RENTAL listings here right now (not sales)? A rising rental-DOM trend means longer vacancies and softer asking-rent achievability than the comps imply.
- What's the recent tenant-quality profile in this submarket — average credit score on applications, eviction rate, late-payment / NSF rate, and stable-employment percentage? A property-management company in the area should have these aggregated.
- How much new for-sale + rental construction is in the pipeline within 1–3 miles? Heavy new supply typically softens prices + rents 12–24 months out; constrained supply supports both.
Investment metrics
- 1% rule
- 0.84% ✗
- Cap rate
- 6.00%
- Cash-on-cash
- -1.03%
- DSCR
- 0.95
- GRM
- 9.9
CMA / ARV
- ARV (on-the-fly)
- $281,261
- Comps found
- 12
Show comp detail 12 sales within ~0.75 mi
| Address | Dist | Beds/Ba | Sqft | Sold | Price | $/sf | Match |
|---|---|---|---|---|---|---|---|
| 5380 Tailwinds Dr | 0.00mi | 3/2.5 (-1) | 1,933 (-6%) | 0mo | $293,010 | $152 | 85 |
| 5384 Tailwinds Dr | 0.00mi | 3/2.5 (-1) | 1,933 (-6%) | 1mo | $303,175 | $157 | 85 |
| 5393 Tailwinds Dr | 0.06mi | 3/2.5 (-1) | 1,933 (-6%) | 1mo | $288,435 | $149 | 82 |
| 5457 Headwinds Ln | 0.08mi | 3/2.5 (-1) | 1,933 (-6%) | 3mo | $282,850 | $146 | 79 |
| 5452 Headwinds Ln | 0.08mi | 3/2.5 (-1) | 2,231 (+9%) | 3mo | $297,320 | $133 | 74 |
| 5445 Headwinds Ln | 0.08mi | 3/2.5 (-1) | 2,231 (+9%) | 3mo | $315,360 | $141 | 74 |
| 5461 Headwinds Ln | 0.08mi | 3/2.5 (-1) | 2,231 (+9%) | 4mo | $306,030 | $137 | 74 |
| 5465 Headwinds Ln | 0.08mi | 3/2.5 (-1) | 2,231 (+9%) | 4mo | $288,440 | $129 | 73 |
| 5472 Headwinds Ln | 0.08mi | 3/2.5 (-1) | 2,231 (+9%) | 4mo | $288,685 | $129 | 73 |
| 87 Carriage House Rd | 0.33mi | 4/2.0 | 1,926 (-6%) | 3mo | $218,000 | $113 | 69 |
| 79 Carriage House Rd | 0.35mi | 4/2.0 | 1,926 (-6%) | 4mo | $215,000 | $112 | 68 |
| 13 Royal Coach Cir | 0.71mi | 4/2.0 | 1,900 (-8%) | 4mo | $244,000 | $128 | 49 |
Match score weights: distance 35% · size 25% · config 20% · recency 20%. Top-matched comps best support the ARV.
Projected returns pro-forma
-3.0% appreciation · 8.0% rent growth · sell at horizon
- IRR
- -12.5%
- Equity multiple
- 0.53×
- Total profit
- $-37,922
- Equity at exit
- $42,635
- IRR
- 2.8%
- Equity multiple
- 1.24×
- Total profit
- $19,555
- Equity at exit
- $24,723
Cash invested: $80,065 (down + closing). Projections, not guarantees.
Landlord ↔ Tenant lean methodology
- Overall (STATE)
- 90 Strongly Landlord-Friendly
- State Alabama
- 90 Strongly Landlord-Friendly · R+15
- County
- — inherits STATE
- City
- — inherits STATE
ZIP-level market 35022
- Home prices YoY
- -20.2%
- Rents YoY
- 14.8%
- Active inventory
- 311
- Price-to-rent
- 9.9×
Monthly cashflow live
- Estimated rent
- $2,414 high interval (Pro) →
- Mortgage (P&I)
- −$1,500
- Tax est. 1.5%
- −$357 /mo · $4,289/yr
- Insurance
- −$119
- HOA
- −$0
- Vacancy / Maint / Mgmt
- −$507
- Net cashflow
- $-69
Break-even live
UW: 25.0% down · 7.5% · 30yr · 1.5% tax · 5.0% vac · 8.0% maint · 8.0% mgmt
Financing live
Cash to close
- Down payment
- $71,486
- Closing costs
- $8,578
- Reserves months
- —
- Total cash needed
- —
Loan-product check · same deal, 3 products live
Conventional
25% down · 7.5% · 30yr
- Down + closing
- —
- Monthly P&I
- —
- Monthly cashflow
- —
- DSCR
- —
- Eligible?
- —
Personal DTI + credit; lowest rate.
DSCR
20% down · 8.5% · 30yr
- Down + closing
- —
- Monthly P&I
- —
- Monthly cashflow
- —
- DSCR
- —
- Eligible?
- —
No personal income docs; deal must DSCR.
Hard money
10% down · 12.0% · 12mo
- Down + closing
- —
- Monthly P&I
- —
- Monthly cashflow
- —
- DSCR
- —
- Eligible?
- —
Short-term bridge; refi at stabilization.
Rent comps 5 comps
| Address | Beds | Baths | Sqft | Rent | $/sqft | DOM | Units | Dist |
|---|---|---|---|---|---|---|---|---|
| 5475 Cedar Creek Dr Bessemer, AL | 4.0 | 2.5 | 2565 | $2,650 | $1.03 | 23d | 1 | 0.24mi |
| 63 Carriage House Rd SW Bessemer, AL | 3.0 | 2.0 | 1802 | $1,780 | $0.99 | 16d | 1 | 0.43mi |
| 505 Westchester Dr Bessemer, AL | 4.0 | 2.0 | 1706 | $1,850 | $1.08 | 43d | 1 | 0.71mi |
| 4737 Rosser Loop Dr Bessemer, AL | 3.0 | 2.0 | 1638 | $1,886 | $1.15 | 1d | 1 | 1.14mi |
| 5725 Riverbirch Dr Bessemer, AL | 3.0 | 2.0 | 1620 | $2,050 | $1.27 | 1d | 1 | 1.32mi |
Listing history 1 events
-
2026-01-22$285,945
ⓘ Source: listings_history table (triggers on properties + properties_extension) + one-shot
backfill from property_details.listing_events for pre-trigger history.
Nearby sold comps map
Loading sold comps map…
Walkable amenities ~0.75 mi
Loading nearby amenities…
Taxation est. · year 1
- Rental income
- $28,972
- − Mortgage interest
- −$16,017
- − Property taxes
- −$4,289
- − Insurance
- −$1,430
- − Repairs & maintenance
- −$2,318
- − Management
- −$2,318
- − Depreciation
- −$8,318
- Taxable loss
- −$5,719
- Est. tax savings @ 24.0%
- +$1,372
- After-tax cash flow
- $547/yr
For passive investors: Depreciation is non-cash, so a rental often shows a tax loss while cash-flowing — sheltering income. Rental losses are passive: they offset passive income freely, and up to $25,000/yr can offset ordinary (W-2) income if you actively participate and your MAGI is under $100k (phasing out to $0 by $150k); unused losses carry forward. On sale, claimed depreciation is recaptured at up to 25%, and gains may owe capital-gains tax (a 1031 exchange can defer both). Figures are a year-1 estimate at your 24.0% rate — not tax advice; consult a CPA.
Schools (NCES district)
- District
- Bessemer City
- NCES district ID
- 0100330
- Math proficiency
- 3% ▼ -18.00%
- Reading proficiency
- 19% ▼ -3.00%
- Median HH income
- $29,721
- Composite
- 8.45/100
- National rank
- #9905
- State rank
- #120 of 129 in AL
Livability — Bessemer
- Score
- 59/100
- State rank
- #331
- US rank
- #20078
Category grades
Schools grade is shown separately in the Schools card above.
Census & demographics
- Census place
- Bessemer, AL
- County
- Jefferson County · 527,445 people
- City population
- 48,018
- Metro
- Birmingham-Hoover, AL
- Population (ZIP)
- 23,126
- Household income
- $81,846
- Rent vs Own
- Severe rent burden
- 554.0
Population outlook (Jefferson County) Hauer SSP2
- Today (2025)
- 669,185 people
- By 2030
- 669,694 · +0.1%
- By 2040
- 661,388 · -1.2%
- By 2050
- 643,086 · -3.9%
- By 2075
- 577,267 · -13.7%
- By 2100
- 474,758 · -29.1%
Race, ethnicity, and origin ACS 2023
- Neighborhood character
- Diverse neighborhood (Simpson 0.56)
- Race & ethnicity
- Black 53% White 41% Hispanic / Latino 3% Two or more races 2% Asian 1%
- Common ancestry
- Italian 1% Slovak 1% Iranian 1%
- Foreign-born
- 4% · Canada, China
- Languages at home
- 96% English-only · Spanish 3% Chinese 1%
Political lean MEDSL · Jefferson
- 2024 margin
- D (+10.4) · D 54.6% · R 44.2% · Other 1.2%
- 2008→2024 swing
- +5.4pp toward D · 2008: 5.1pp · 2024: 10.4pp
- All cycles
- 2024: D+10.4 2020: D+13.2 2016: D+7.2 2012: D+6.0 2008: D+5.1
Not yet ingested
- Civics
- —
Market trends
- HPI YoY
- ▼ -55.40%
- Current HPI
- 219.3839
- Rent YoY
- ▲ 14.80%
- Metro
- Birmingham-Hoover, AL
- State GDP YoY
- ▲ 2.94%
- F500 in state
- 4
Industry mix (Fortune 500 HQ in AL)
| Industry | F500 HQs | Revenue |
|---|---|---|
| Financial Services | 1 | $8B |
|
||
| Healthcare | 1 | $5B |
|
||
Price history
1 event — show timeline
- 2026-01-22 Listed $285,945 Greater Alabama MLS
Cash-flow waterfall
monthlySold comps — $/sqft
last 12 mo · ≤1 miLoading sold comps…