 32-Plex
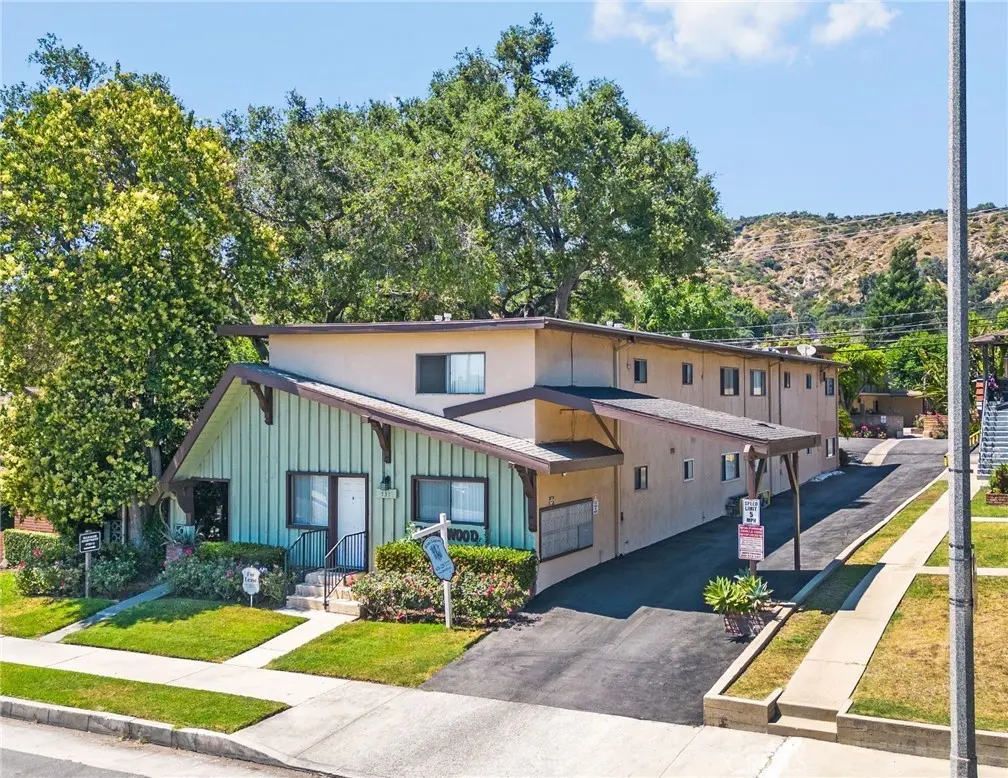
729 W Foothill Blvd · Monrovia, CA
Flood risk 1/10 · Minimal
- FEMA flood zone
- X (unshaded)
- Chance of flooding over 30 yrs
- 0.0%
- Est. flood insurance / yr
- $507 – $1,088
Fire risk 6/10 · Moderate
- Est. fire insurance / yr
- $659 – $1,223
Heat risk 7/10 · Major
- Hot days now (above 98°F)
- 7 days/yr
- Hot days in 30 yrs
- 20 days/yr
Wind risk 1/10 · Minimal
- Chance of severe wind over 30 yrs
- —
Air-quality risk 9/10 · Severe
- Unhealthy air days now
- 21 days/yr
- Unhealthy air days in 30 yrs
- 23 days/yr
Risk factors via First Street. Map © Google.
Why this score? — see what drove the C+ grade
The composite is a weighted blend of 9 inputs, each scored 0–100. Each bar is that input's sub-score; the figure is the points it added to the 100-point composite (weight × sub-score).
- Cash flow +30.0/30.0
- 1% rule +10.0/10.0
- DSCR +10.0/10.0
- Schools +3.9/10.0
- Rent growth +3.3/5.0
- Livability +2.6/5.0
- Condition / age +2.5/5.0
- ARV discount +1.8/15.0
- Appreciation +0.0/10.0
$7,600,000
🖨 Deal sheet (PDF) 📄 Offer letter ✓ Due diligence
Multi-family units
County records classify this as Multi-Family (5+ Unit). Listing-text estimate: 32 units. confirmed
5+ unit building — per-unit beds/baths from public records are typically unavailable; the breakdown below (if shown) is an estimate from the listing text.
Listing remarks MLS
We are proud to present Ridgewood Apartments, a pristinely maintained 32-unit asset located at 729 W Foothill Boulevard in Monrovia, California. Situated North of the 210 Freeway, this pride-of-ownership property benefits from a supply-constrained submarket, excellent schools, and consistent high occupancy levels. Monrovia’s growing population and the property’s historical stability make this is an ideal investment choice for steady rental income and long-term appreciation. The Ridgewood Apartments is a 32-unit property originally built in 1958, featuring a total building size of ±20,160 SF situated on a ±44,854 SF lot (±1.03 Acres). The property features an excellent unit mix of one and two-bedroom units averaging 633 SF. Meticulously cared for, the asset features a communal laundry facility, mature lush landscaping with a courtyard, and ample carport and surface parking. Most units have been upgraded with vinyl plank flooring, stainless steel appliances, and wall AC/heating. This opportunity features favorable debt to assume at a 2.95% interest-only rate until November 2030. This rare financing allows a new investor to realize a 7.40% Cash-on-Cash return on current income, with the potential to reach a 10.03% return on pro forma income. The property currently operates at a 5.37% Cap Rate, with a clear path to a 6.80% Cap Rate at market rents. The city of Monrovia is ideally located within Southern California offering easy access to the 210, 605, 134, 10 and 5 freeways connecting to all of Los Angeles County, Ventura County, San Bernardino and beyond. Its location offers convenient access to neighboring cities within the San Gabriel Valley. Significant local landmarks within a 20- mile radius include: Santa Anita Park, Los Angeles County Arboretum, The Huntington Library, City of Hope Hospital, The Rose Bowl, Dodger Stadium, Crypto.com Arena, Griffith Observatory, Los Angeles Zoo, Hollywood Walk of Fame, Hollywood Bowl, Universal Studios and more. Ridgewood Apartments in the city of Monrovia is a premier income-producing asset with a compelling 16% rental upside, presenting a stable and lucrative opportunity for 1031 exchange buyers and seasoned investors alike.
Key facts
- Courtyard
- Vinyl plank flooring
- 1.03 acre lot
Tags
Neighborhood map
What this means for you Summary
Snapshot
- This is a 32 × 39-bed/32.0-bath units multifamily listed at $7.60M.
Deal economics
- At list price, monthly cash flow is $46k ($552k/yr) — positive. Per door: $1k/mo.
- The deal already cash-flows at list — no discount required.
- Meets the 1% rule at list price ($117k rent vs $7.60M).
- Recommended offer: $6.69M (12.0% below list) — sets the bar for market timing.
- Cap rate 13.6% vs local median 2.0% in Monrovia — top-decile yield for the area; either an underpriced asset or a hidden risk that comps aren't pricing in. Stress-test before assuming the spread holds.
Location & tenants
- Location reads 52/100 on livability (#993 in CA) — a working-class tenant base; expect higher turnover. Strengths: employment A+, health & safety A-; Watch: crime C-, amenities F, commute F.
- Monrovia Unified (suburban): math 39% / reading 48% proficiency, ranked #182 of 517 in CA (top 35%) — families likely to look elsewhere, expect single-tenant / working-renter base with shorter leases.
- Zoned schools: Mayflower Elementary (math 66% / reading 62%, grade B, #197 of 1,571 statewide, top 13%, 502 students, 35% FRL); Clifton Middle (math 42% / reading 56%, grade C-, #107 of 498 statewide, top 22%, 589 students, 42% FRL); Monrovia High (math 35% / reading 58%, grade D-, #408 of 1,170 statewide, top 35%, 1,538 students, 48% FRL) — zoned schools at 42% FRL track the district average.
- Market conditions: Rents rising (+3.4%/yr); 76 active listings in the ZIP; solid renter incomes; 19,697 units permitted in Los Angeles County in 2024 (9,426 in 5+ unit buildings).
Forward outlook
- Local home prices are declining (-3.0%/yr); year-one equity from $53k of loan paydown is wiped out by about $228k of value loss. Plan a longer hold.
- Los Angeles County population projected at +9% by 2050 — modest demand growth; plan on rents tracking national, not racing it.
- At projected returns (-3.0% appreciation + 3.4% rent growth), your $2.13M cash investment doubles in ~5 years — after that, you're playing with house money.
Negotiation context
- It's been on market 131 days — a 12% lower offer ($6.69M) is reasonable based on typical stale-listing flexibility.
- 6 sale attempts since 2y ago with the ask held roughly flat each time — persistent listings suggest the price (not the market) is what's stuck; bring a comps-based counter.
- Current owner paid $1.57M; list at $7.60M implies a 383% gain — meaningful room to come down on a strong offer.
Risks & watch-outs
- Watch-outs: built in 1958 — expect roof / HVAC / electrical / plumbing capex.
- Climate carrying-cost: major wildfire risk; extreme-heat days projected 7→20/yr by 2055 (HVAC capex compounding) — expect insurance premiums to compound above CPI over the hold.
Questions for the listing agent
- It's been on market 131 days. Have you received any prior offers? Is the seller open to a 12% concession, seller financing, or rate buy-down credit?
- Can we see the unit-by-unit rent roll, current vacancy, and any below-market leases? What's the average tenancy length?
- What capital expenditures (roof, boiler, parking lot, exteriors) have been made in the last 5 years, and what's planned in the next 2?
- Built in 1958 — when were the roof, HVAC, electrical panel, plumbing, and water heater last replaced?
- Why hasn't it sold? Are there any deal-killer items the seller is aware of (foundation, flood, title, zoning, code violations)?
- Is there a deadline driving the sale (1031 exchange, divorce, estate, relocation)? That informs how much negotiation room exists.
- What's the average days-on-market for RENTAL listings here right now (not sales)? A rising rental-DOM trend means longer vacancies and softer asking-rent achievability than the comps imply.
- What's the recent tenant-quality profile in this submarket — average credit score on applications, eviction rate, late-payment / NSF rate, and stable-employment percentage? A property-management company in the area should have these aggregated.
- How much new apartment / multifamily construction is in the pipeline within 1–3 miles? Heavy new supply (>2% of stock underway) typically softens rents 12–24 months out; light construction supports rent growth.
Investment metrics
- 1% rule
- 1.54% ✓
- Cap rate
- 13.56%
- Cash-on-cash
- 25.94%
- DSCR
- 2.15
- GRM
- 5.4
CMA / ARV
- ARV (median comp)
- $6,745,439
- List price
- $7,600,000
- Delta
- 12.67%
- Verdict
- OVERPRICED
- Comps
- 1 within 2.0 mi
Projected returns pro-forma
-3.0% appreciation · 3.36% rent growth · sell at horizon
- IRR
- 20.0%
- Equity multiple
- 1.82×
- Total profit
- $1,738,494
- Equity at exit
- $1,133,185
- IRR
- 28.4%
- Equity multiple
- 3.56×
- Total profit
- $5,454,029
- Equity at exit
- $657,109
Cash invested: $2,128,000 (down + closing). Projections, not guarantees.
Landlord ↔ Tenant lean methodology
- Overall (STATE)
- 18 Strongly Tenant-Friendly
- State California
- 18 Strongly Tenant-Friendly · D+13
- County
- — inherits STATE
- City
- — inherits STATE
ZIP-level market 91016
- Rents YoY
- 3.4%
- Active inventory
- 76
- Price-to-rent
- 173.1×
Monthly cashflow live
- Estimated rent
- $117,100 medium interval (Pro) →
- Mortgage (P&I)
- −$39,855
- Tax from tax record
- −$3,493 /mo · $41,918/yr
- Insurance
- −$3,167
- HOA
- −$0
- Vacancy / Maint / Mgmt
- −$24,591
- Net cashflow
- $45,994
Break-even live
Sensitivity live
| Price | -10% $50,296 | -5% $48,145 | +0% $45,994 | +5% $43,843 | +10% $41,692 |
|---|---|---|---|---|---|
| Rent | -10% $36,743 | -5% $41,368 | +0% $45,994 | +5% $50,619 | +10% $55,245 |
| Rate | -1.0pp $49,821 | -0.5pp $47,927 | base $45,994 | +0.5pp $44,025 | +1.0pp $42,021 |
32-unit breakdown (identical units grouped — click to expand)
| Units | Beds | Baths | Est. rent |
|---|---|---|---|
| 32× units | 39 | 32 | $117,088 |
| #1 | 39 | 32 | $3,659 |
| #2 | 39 | 32 | $3,659 |
| #3 | 39 | 32 | $3,659 |
| #4 | 39 | 32 | $3,659 |
| #5 | 39 | 32 | $3,659 |
| #6 | 39 | 32 | $3,659 |
| #7 | 39 | 32 | $3,659 |
| #8 | 39 | 32 | $3,659 |
| #9 | 39 | 32 | $3,659 |
| #10 | 39 | 32 | $3,659 |
| #11 | 39 | 32 | $3,659 |
| #12 | 39 | 32 | $3,659 |
| #13 | 39 | 32 | $3,659 |
| #14 | 39 | 32 | $3,659 |
| #15 | 39 | 32 | $3,659 |
| #16 | 39 | 32 | $3,659 |
| #17 | 39 | 32 | $3,659 |
| #18 | 39 | 32 | $3,659 |
| #19 | 39 | 32 | $3,659 |
| #20 | 39 | 32 | $3,659 |
| #21 | 39 | 32 | $3,659 |
| #22 | 39 | 32 | $3,659 |
| #23 | 39 | 32 | $3,659 |
| #24 | 39 | 32 | $3,659 |
| #25 | 39 | 32 | $3,659 |
| #26 | 39 | 32 | $3,659 |
| #27 | 39 | 32 | $3,659 |
| #28 | 39 | 32 | $3,659 |
| #29 | 39 | 32 | $3,659 |
| #30 | 39 | 32 | $3,659 |
| #31 | 39 | 32 | $3,659 |
| #32 | 39 | 32 | $3,659 |
| Total (32 units) | $117,100 | ||
UW: 25.0% down · 7.5% · 30yr · 1.5% tax · 5.0% vac · 8.0% maint · 8.0% mgmt
Financing live
Cash to close
- Down payment
- $1,900,000
- Closing costs
- $228,000
- Reserves months
- —
- Total cash needed
- —
Loan-product check · same deal, 3 products live
Conventional
25% down · 7.5% · 30yr
- Down + closing
- —
- Monthly P&I
- —
- Monthly cashflow
- —
- DSCR
- —
- Eligible?
- —
Personal DTI + credit; lowest rate.
DSCR
20% down · 8.5% · 30yr
- Down + closing
- —
- Monthly P&I
- —
- Monthly cashflow
- —
- DSCR
- —
- Eligible?
- —
No personal income docs; deal must DSCR.
Hard money
10% down · 12.0% · 12mo
- Down + closing
- —
- Monthly P&I
- —
- Monthly cashflow
- —
- DSCR
- —
- Eligible?
- —
Short-term bridge; refi at stabilization.
Listing history 30 events
-
2026-06-21days on market $7,600,000 Active 131 DOM
-
2026-06-18days on market $7,600,000 Active 128 DOM
-
2026-06-17days on market $7,600,000 Active 127 DOM
-
2026-06-16days on market $7,600,000 Active 126 DOM
-
2026-06-15days on market $7,600,000 Active 125 DOM
-
2026-06-13days on market $7,600,000 Active 123 DOM
-
2026-06-13days on market $7,600,000 Active 122 DOM
-
2026-06-09days on market $7,600,000 Active 119 DOM
-
2026-06-08days on market $7,600,000 Active 118 DOM
-
2026-06-07days on market $7,600,000 Active 117 DOM
-
2026-06-04days on market $7,600,000 Active 114 DOM
-
2026-06-03days on market $7,600,000 Active 113 DOM
-
2026-06-02days on market $7,600,000 Active 112 DOM
-
2026-06-01days on market $7,600,000 Active 111 DOM
-
2026-05-31days on market $7,600,000 Active 110 DOM
-
2026-02-10$7,600,000 Active 2234-char remark
Show marketing remark (2234 chars)
We are proud to present Ridgewood Apartments, a pristinely maintained 32-unit asset located at 729 W Foothill Boulevard in Monrovia, California. Situated North of the 210 Freeway, this pride-of-ownership property benefits from a supply-constrained submarket, excellent schools, and consistent high occupancy levels. Monrovia’s growing population and the property’s historical stability make this is an ideal investment choice for steady rental income and long-term appreciation. The Ridgewood Apartments is a 32-unit property originally built in 1958, featuring a total building size of ±20,160 SF situated on a ±44,854 SF lot (±1.03 Acres). The property features an excellent unit mix of one and two-bedroom units averaging 633 SF. Meticulously cared for, the asset features a communal laundry facility, mature lush landscaping with a courtyard, and ample carport and surface parking. Most units have been upgraded with vinyl plank flooring, stainless steel appliances, and wall AC/heating. This opportunity features favorable debt to assume at a 2.95% interest-only rate until November 2030. This rare financing allows a new investor to realize a 7.40% Cash-on-Cash return on current income, with the potential to reach a 10.03% return on pro forma income. The property currently operates at a 5.37% Cap Rate, with a clear path to a 6.80% Cap Rate at market rents. The city of Monrovia is ideally located within Southern California offering easy access to the 210, 605, 134, 10 and 5 freeways connecting to all of Los Angeles County, Ventura County, San Bernardino and beyond. Its location offers convenient access to neighboring cities within the San Gabriel Valley. Significant local landmarks within a 20- mile radius include: Santa Anita Park, Los Angeles County Arboretum, The Huntington Library, City of Hope Hospital, The Rose Bowl, Dodger Stadium, Crypto.com Arena, Griffith Observatory, Los Angeles Zoo, Hollywood Walk of Fame, Hollywood Bowl, Universal Studios and more. Ridgewood Apartments in the city of Monrovia is a premier income-producing asset with a compelling 16% rental upside, presenting a stable and lucrative opportunity for 1031 exchange buyers and seasoned investors alike.
-
2025-05-13historical $1,850
-
2025-05-09$1,850
-
2025-04-30historical $1,850
-
2025-04-17$1,850
-
2025-04-17historical $1,795
-
2025-04-07historical
-
2025-03-08$1,795
-
2024-10-30historical $1,795
-
2024-10-26price $1,795
-
2024-10-11$8,100,000 Active
-
2024-09-27price $1,850
-
2024-09-14$1,895
-
2000-08-09soldstatus $1,575,000
-
1986-12-17soldstatus $1,355,000
ⓘ Source: listings_history table (triggers on properties + properties_extension) + one-shot
backfill from property_details.listing_events for pre-trigger history.
Tax reassessment forecast CA · Resets to sale price
- Current annual tax
- $41,918 · $3,493/mo
- Projected year-2 tax
- $57,760 · $4,813/mo
- Expected delta
- +$15,842/yr (+$1,320/mo · 37.8%)
ⓘ Screening estimate from a state-policy table — verify with the county assessor before closing.
Climate risk First Street
- Flood 1/10 Low FEMA zone X (unshaded) · 0% chance over 30 yrs
- Wildfire 6/10 Major
- Heat 7/10 Severe 7 d/yr ≥98°F today · 20 d/yr by 30 yrs out
- Wind 1/10 Low
- Air quality 9/10 Extreme 21 unhealthy d/yr today · 23 by 30 yrs out
Nearby sold comps map
Loading sold comps map…
Walkable amenities ~0.75 mi
Loading nearby amenities…
Taxation est. · year 1
- Rental income
- $1,405,200
- − Mortgage interest
- −$425,718
- − Property taxes
- −$41,918
- − Insurance
- −$38,000
- − Repairs & maintenance
- −$112,416
- − Management
- −$112,416
- − Depreciation
- −$221,091
- Taxable income
- $453,641
- Est. tax owed @ 24.0%
- −$108,874
- After-tax cash flow
- $443,053/yr
For passive investors: Depreciation is non-cash, so a rental often shows a tax loss while cash-flowing — sheltering income. Rental losses are passive: they offset passive income freely, and up to $25,000/yr can offset ordinary (W-2) income if you actively participate and your MAGI is under $100k (phasing out to $0 by $150k); unused losses carry forward. On sale, claimed depreciation is recaptured at up to 25%, and gains may owe capital-gains tax (a 1031 exchange can defer both). Figures are a year-1 estimate at your 24.0% rate — not tax advice; consult a CPA.
Schools (NCES district)
- District
- Monrovia Unified
- NCES district ID
- 0625320
- Math proficiency
- 39% ▼ -4.00%
- Reading proficiency
- 48% ▼ -10.00%
- Median HH income
- $69,032
- Composite
- 39.18/100
- National rank
- #4022
- State rank
- #182 of 517 in CA
Livability — Monrovia
- Score
- 52/100
- State rank
- #993
- US rank
- #24760
Category grades
Schools grade is shown separately in the Schools card above.
Census & demographics
- Census place
- Monrovia, CA
- County
- Los Angeles County · 9,444,647 people
- City population
- 41,140
- Metro
- Los Angeles-Long Beach-Anaheim, CA
- Population (ZIP)
- 41,140
- Household income
- $96,540
- Rent vs Own
- Severe rent burden
- 2134.0
Population outlook (Los Angeles County) Hauer SSP2
- Today (2025)
- 10,940,515 people
- By 2030
- 11,256,481 · +2.9%
- By 2040
- 11,729,929 · +7.2%
- By 2050
- 11,948,407 · +9.2%
- By 2075
- 11,818,114 · +8.0%
- By 2100
- 10,842,928 · -0.9%
Race, ethnicity, and origin ACS 2023
- Neighborhood character
- Diverse neighborhood (Simpson 0.70)
- Race & ethnicity
- Hispanic / Latino 43% White 30% Two or more races 21% Asian 16% Black 6%
- Hispanic origin (detail)
- Mexican 33% Puerto Rican 1%
- Common ancestry
- Italian 1% Slovak 1% Lithuanian 1%
- Foreign-born
- 24% · Canada, China, Vietnam
- Languages at home
- 58% English-only · Spanish 27% Chinese 7% Tagalog/Filipino 2%
Political lean MEDSL · Los Angeles
- 2024 margin
- Solid D (+32.9) · D 64.8% · R 31.9% · Other 3.3%
- 2008→2024 swing
- -7.4pp toward R · 2008: 40.4pp · 2024: 32.9pp
- All cycles
- 2024: D+32.9 2020: D+44.2 2016: D+48.0 2012: D+40.0 2008: D+40.4
Not yet ingested
- Civics
- —
Market trends
- HPI YoY
- ▼ -1140.27%
- Current HPI
- 390.9169
- Rent YoY
- ▲ 3.36%
- Metro
- Los Angeles-Long Beach-Anaheim, CA
- State GDP YoY
- ▲ 3.21%
- F500 in state
- 116
Industry mix (Fortune 500 HQ in CA)
| Industry | F500 HQs | Revenue |
|---|---|---|
| Technology | 27 | $1,492B |
|
||
| Financial Services | 3 | $174B |
|
||
| Retail | 3 | $44B |
|
||
| Insurance | 3 | $26B |
|
||
| Media / Entertainment | 2 | $115B |
|
||
| Pharmaceuticals / Biotech | 2 | $62B |
|
||
Price history
+460.9% since first listed15 events — show timeline
- 2026-02-10 Listed $7,600,000 CRMLS
- 2025-05-13 Rental Removed $1,850 RENTALBEAST
- 2025-05-09 Listed for Rent $1,850 RENTALBEAST
- 2025-04-30 Rental Removed $1,850 RENTALBEAST
- 2025-04-17 Listed for Rent $1,850 RENTALBEAST
- 2025-04-17 Rental Removed $1,795 RENTALBEAST
- 2025-04-07 Listing Removed — CRMLS
- 2025-03-08 Listed for Rent $1,795 RENTALBEAST
- 2024-10-30 Rental Removed $1,795 RENTALBEAST
- 2024-10-26 Price Changed $1,795 RENTALBEAST
- 2024-10-11 Listed $8,100,000 CRMLS
- 2024-09-27 Price Changed $1,850 RENTALBEAST
- 2024-09-14 Listed for Rent $1,895 RENTALBEAST
- 2000-08-09 Sold (Public Records) $1,575,000 Public Records
- 1986-12-17 Sold (Public Records) $1,355,000 Public Records
Property tax history
+1.9%/yrLatest (2025): $41,918 · +2.6% YoY. Source: county tax records.
Cash-flow waterfall
monthlySold comps — $/sqft
last 12 mo · ≤1 miLoading sold comps…