 Triplex
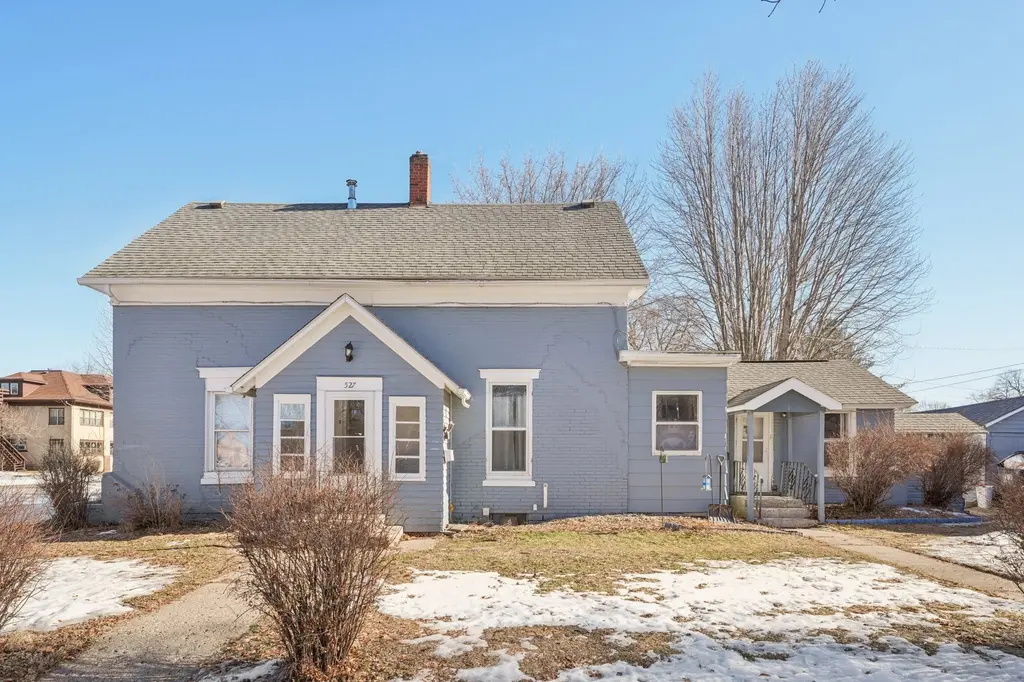
527 6th Ave NW · Faribault, MN
Flood risk 3/10 · Minor
- FEMA flood zone
- X (unshaded)
- Chance of flooding over 30 yrs
- 0.1%
- Est. flood insurance / yr
- $473 – $860
Fire risk 1/10 · Minimal
- Est. fire insurance / yr
- $888 – $1,650
Heat risk 2/10 · Minimal
- Hot days now (above 99°F)
- 7 days/yr
- Hot days in 30 yrs
- 15 days/yr
Wind risk 2/10 · Minimal
- Chance of severe wind over 30 yrs
- —
Air-quality risk 1/10 · Minimal
- Unhealthy air days now
- 0 days/yr
- Unhealthy air days in 30 yrs
- 0 days/yr
Risk factors via First Street. Map © Google.
Why this score? — see what drove the C+ grade
The composite is a weighted blend of 9 inputs, each scored 0–100. Each bar is that input's sub-score; the figure is the points it added to the 100-point composite (weight × sub-score).
- Cash flow +27.4/30.0
- DSCR +9.6/10.0
- ARV discount +7.5/15.0
- 1% rule +6.7/10.0
- Livability +3.8/5.0
- Rent growth +2.5/5.0
- Condition / age +2.5/5.0
- Schools +2.3/10.0
- Appreciation +0.0/10.0
$349,900
🖨 Deal sheet 📄 Offer letter ✓ Due diligence
Multi-family units
County records classify this as Multi-Family (2-4 Unit). Listing-text estimate: 3 units. confirmed
Listing remarks MLS
Triplex investment opportunity at 527 6th Ave NW in Faribault featuring three 2-bedroom, 1-bath units. Each unit offers a practical floor plan with comfortable living spaces and consistent layouts throughout. The property presents strong rental appeal (Unit 1 rent $1310 month, Unit 2 $1100 Month, Unit 3 $1250 month) and is well positioned for long-term income potential in an established neighborhood. A solid option for investors seeking a multi-unit property with dependable demand.
Key facts
- Practical floor plan
- Multi-unit property
- Strong rental appeal
Tags
Neighborhood map
What this means for you Summary
Snapshot
- This is a 3 × 2-bed/1.0-bath units multifamily listed at $350k.
Deal economics
- At list price, monthly cash flow is $1k ($12k/yr) — positive. Per door: $342/mo.
- The deal already cash-flows at list — no discount required.
- Meets the 1% rule at list price ($4k rent vs $350k).
- Recommended offer: $318k (9.0% below list) — sets the bar for market timing.
- Cap rate 9.8% vs local median 4.1% in Faribault — top-decile yield for the area; either an underpriced asset or a hidden risk that comps aren't pricing in. Stress-test before assuming the spread holds.
Location & tenants
- Location reads 76/100 on livability (#158 in MN, #3,440 nationally) — a middle-class / working-renter tenant base. Strengths: cost of living A+, housing A+, health & safety A+; Watch: schools C-, employment C-, commute F.
- Faribault Public School District (town): math 17% / reading 34% proficiency, ranked #275 of 301 in MN (top 91%) — low school quality limits family demand, transient renter base, plan for 1-2y turnover.
- Market conditions: 165 active listings in the ZIP; 93 units permitted in Rice County in 2024 (0 in 5+ unit buildings).
- At $4,083/mo this rent would consume 71% of the median local household income ($69k/yr) (locally 755% of renters already pay >50% of income on rent) — very limited rent-growth headroom before tenants either downsize or default.
Forward outlook
- Local home prices are declining (-3.0%/yr); year-one equity from $2k of loan paydown is wiped out by about $10k of value loss. Plan a longer hold.
- At projected returns (-3.0% appreciation + 3.0% rent growth), your $98k cash investment doubles in ~10 years — after that, you're playing with house money.
Negotiation context
- It's been on market 117 days — a 9% lower offer ($318k) is reasonable based on typical stale-listing flexibility.
- 12 sale attempts since 25y ago with the ask held roughly flat each time — persistent listings suggest the price (not the market) is what's stuck; bring a comps-based counter.
Risks & watch-outs
- Watch-outs: built in 1880 — expect roof / HVAC / electrical / plumbing capex.
Questions for the listing agent
- It's been on market 117 days. Have you received any prior offers? Is the seller open to a 9% concession, seller financing, or rate buy-down credit?
- Can we see the unit-by-unit rent roll, current vacancy, and any below-market leases? What's the average tenancy length?
- What capital expenditures (roof, boiler, parking lot, exteriors) have been made in the last 5 years, and what's planned in the next 2?
- Built in 1880 — when were the roof, HVAC, electrical panel, plumbing, and water heater last replaced?
- Why hasn't it sold? Are there any deal-killer items the seller is aware of (foundation, flood, title, zoning, code violations)?
- Is there a deadline driving the sale (1031 exchange, divorce, estate, relocation)? That informs how much negotiation room exists.
- What's the average days-on-market for RENTAL listings here right now (not sales)? A rising rental-DOM trend means longer vacancies and softer asking-rent achievability than the comps imply.
- What's the recent tenant-quality profile in this submarket — average credit score on applications, eviction rate, late-payment / NSF rate, and stable-employment percentage? A property-management company in the area should have these aggregated.
- How much new apartment / multifamily construction is in the pipeline within 1–3 miles? Heavy new supply (>2% of stock underway) typically softens rents 12–24 months out; light construction supports rent growth.
Investment metrics
- 1% rule
- 1.17% ✓
- Cap rate
- 9.82%
- Cash-on-cash
- 12.58%
- DSCR
- 1.56
- GRM
- 7.1
CMA / ARV
- ARV (median comp)
- $146,840
- List price
- $349,900
- Delta
- 138.29%
- Verdict
- OVERPRICED
- Comps
- 1 within 2.0 mi
Projected returns pro-forma
-3.0% appreciation · 3.0% rent growth · sell at horizon
- IRR
- 2.3%
- Equity multiple
- 1.09×
- Total profit
- $8,651
- Equity at exit
- $52,171
- IRR
- 11.9%
- Equity multiple
- 1.93×
- Total profit
- $91,477
- Equity at exit
- $30,253
Cash invested: $97,972 (down + closing). Projections, not guarantees.
Landlord ↔ Tenant lean methodology
- Overall (STATE)
- 46 Balanced
- State Minnesota
- 46 Balanced · D+2
- County
- — inherits STATE
- City
- — inherits STATE
ZIP-level market 55021
- Home prices YoY
- -26.9%
- Active inventory
- 165
- Price-to-rent
- 21.4×
Monthly cashflow live
- Estimated rent
- $4,083 high interval (Pro) →
- Mortgage (P&I)
- −$1,835
- Tax from tax record
- −$218 /mo · $2,612/yr
- Insurance
- −$146
- HOA
- −$0
- Vacancy / Maint / Mgmt
- −$857
- Net cashflow
- $1,027
Break-even live
3-unit breakdown (identical units grouped — click to expand)
| Units | Beds | Baths | Est. rent |
|---|---|---|---|
| 3× units | 2 | 1 | $4,083 |
| #1 | 2 | 1 | $1,361 |
| #2 | 2 | 1 | $1,361 |
| #3 | 2 | 1 | $1,361 |
| Total (3 units) | $4,083 | ||
UW: 25.0% down · 7.5% · 30yr · 1.5% tax · 5.0% vac · 8.0% maint · 8.0% mgmt
Financing live
Cash to close
- Down payment
- $87,475
- Closing costs
- $10,497
- Reserves months
- —
- Total cash needed
- —
Loan-product check · same deal, 3 products live
Conventional
25% down · 7.5% · 30yr
- Down + closing
- —
- Monthly P&I
- —
- Monthly cashflow
- —
- DSCR
- —
- Eligible?
- —
Personal DTI + credit; lowest rate.
DSCR
20% down · 8.5% · 30yr
- Down + closing
- —
- Monthly P&I
- —
- Monthly cashflow
- —
- DSCR
- —
- Eligible?
- —
No personal income docs; deal must DSCR.
Hard money
10% down · 12.0% · 12mo
- Down + closing
- —
- Monthly P&I
- —
- Monthly cashflow
- —
- DSCR
- —
- Eligible?
- —
Short-term bridge; refi at stabilization.
Listing history 34 events
-
2026-05-18status Pending 486-char remark
Show marketing remark (486 chars)
Triplex investment opportunity at 527 6th Ave NW in Faribault featuring three 2-bedroom, 1-bath units. Each unit offers a practical floor plan with comfortable living spaces and consistent layouts throughout. The property presents strong rental appeal (Unit 1 rent $1310 month, Unit 2 $1100 Month, Unit 3 $1250 month) and is well positioned for long-term income potential in an established neighborhood. A solid option for investors seeking a multi-unit property with dependable demand.
-
2026-01-21$349,900 Active 486-char remark
Show marketing remark (486 chars)
Triplex investment opportunity at 527 6th Ave NW in Faribault featuring three 2-bedroom, 1-bath units. Each unit offers a practical floor plan with comfortable living spaces and consistent layouts throughout. The property presents strong rental appeal (Unit 1 rent $1310 month, Unit 2 $1100 Month, Unit 3 $1250 month) and is well positioned for long-term income potential in an established neighborhood. A solid option for investors seeking a multi-unit property with dependable demand.
-
2025-02-01historical $1,250
-
2025-01-28$1,250
-
2025-01-13soldstatus $315,200 Sold 402-char remark
Show marketing remark (402 chars)
Take advantage of this fantastic investment opportunity with this fully remodeled triplex in Faribault. This property features three spacious 2-bedroom units, all recently updated to offer modern amenities while preserving the charm of the building. With tenants responsible for their own heat and electric, this property offers a great potential for steady cash flow and low maintenance for the owner.
-
2024-12-31status Pending 402-char remark
Show marketing remark (402 chars)
Take advantage of this fantastic investment opportunity with this fully remodeled triplex in Faribault. This property features three spacious 2-bedroom units, all recently updated to offer modern amenities while preserving the charm of the building. With tenants responsible for their own heat and electric, this property offers a great potential for steady cash flow and low maintenance for the owner.
-
2024-12-05historical Contingent - Inspection 402-char remark
Show marketing remark (402 chars)
Take advantage of this fantastic investment opportunity with this fully remodeled triplex in Faribault. This property features three spacious 2-bedroom units, all recently updated to offer modern amenities while preserving the charm of the building. With tenants responsible for their own heat and electric, this property offers a great potential for steady cash flow and low maintenance for the owner.
-
2024-11-18$309,900 Active 402-char remark
Show marketing remark (402 chars)
Take advantage of this fantastic investment opportunity with this fully remodeled triplex in Faribault. This property features three spacious 2-bedroom units, all recently updated to offer modern amenities while preserving the charm of the building. With tenants responsible for their own heat and electric, this property offers a great potential for steady cash flow and low maintenance for the owner.
-
2018-02-06soldstatus $85,000
-
2018-01-22soldstatus $85,000 Sold
-
2017-11-21status Pending
-
2017-08-14price $89,000
-
2017-03-09$95,000 Active
-
2017-03-08historical
-
2016-03-08$99,000 Active
-
2016-03-01historical
-
2015-04-30$105,000 Active
-
2015-03-25historical
-
2014-07-28$113,000 Active
-
2014-04-05historical
-
2014-02-26$122,000 Active
-
2012-12-12historical
-
2012-06-30$149,900
-
2012-06-27historical
-
2011-06-27$149,900
-
2003-03-17soldstatus $153,000
-
2003-01-30soldstatus $153,000
-
2002-11-19historical
-
2002-11-04$153,900
-
2002-01-31soldstatus $98,500
-
2002-01-03historical
-
2001-12-27$99,900
-
1999-10-13soldstatus $72,500
-
1999-10-13soldstatus $100,700
ⓘ Source: listings_history table (triggers on properties + properties_extension) + one-shot
backfill from property_details.listing_events for pre-trigger history.
Tax reassessment forecast MN · Partial reset (capped growth)
- Current annual tax
- $2,612 · $218/mo
- Projected year-2 tax
- $3,265 · $272/mo
- Expected delta
- +$653/yr (+$54/mo · 25.0%)
ⓘ Screening estimate from a state-policy table — verify with the county assessor before closing.
Climate risk First Street
- Flood 3/10 Moderate FEMA zone X (unshaded) · 10% chance over 30 yrs
- Wildfire 1/10 Low
- Heat 2/10 Low 7 d/yr ≥99°F today · 15 d/yr by 30 yrs out
- Wind 2/10 Low
- Air quality 1/10 Low 0 unhealthy d/yr today · 0 by 30 yrs out
Nearby sold comps map
Loading sold comps map…
Walkable amenities ~0.75 mi
Loading nearby amenities…
Taxation est. · year 1
- Rental income
- $48,996
- − Mortgage interest
- −$19,600
- − Property taxes
- −$2,612
- − Insurance
- −$1,750
- − Repairs & maintenance
- −$3,920
- − Management
- −$3,920
- − Depreciation
- −$10,179
- Taxable income
- $7,016
- Est. tax owed @ 24.0%
- −$1,684
- After-tax cash flow
- $10,642/yr
For passive investors: Depreciation is non-cash, so a rental often shows a tax loss while cash-flowing — sheltering income. Rental losses are passive: they offset passive income freely, and up to $25,000/yr can offset ordinary (W-2) income if you actively participate and your MAGI is under $100k (phasing out to $0 by $150k); unused losses carry forward. On sale, claimed depreciation is recaptured at up to 25%, and gains may owe capital-gains tax (a 1031 exchange can defer both). Figures are a year-1 estimate at your 24.0% rate — not tax advice; consult a CPA.
Schools (NCES district)
- District
- Faribault Public School District
- NCES district ID
- 2711760
- Math proficiency
- 17% ▼ -18.00%
- Reading proficiency
- 34% ▼ -8.00%
- Median HH income
- $54,584
- Composite
- 22.85/100
- National rank
- #8011
- State rank
- #275 of 301 in MN
Livability — Faribault
- Score
- 76/100
- State rank
- #158
- US rank
- #3440
Category grades
Schools grade is shown separately in the Schools card above.
Census & demographics
- Census place
- Faribault, MN
- County
- Rice County · 56,558 people
- City population
- 30,908
- Metro
- Faribault-Northfield, MN
- Population (ZIP)
- 30,908
- Household income
- $68,820
- Rent vs Own
- Severe rent burden
- 755.0
Population outlook (Rice County) Hauer SSP2
- Today (2025)
- 66,716 people
- By 2030
- 67,352 · +1.0%
- By 2040
- 67,595 · +1.3%
- By 2050
- 67,074 · +0.5%
- By 2075
- 66,641 · -0.1%
- By 2100
- 66,205 · -0.8%
Race, ethnicity, and origin ACS 2023
- Neighborhood character
- Predominantly White (71%)
- Race & ethnicity
- White 71% Black 13% Hispanic / Latino 12% Two or more races 6% Asian 1%
- Hispanic origin (detail)
- Mexican 9%
- Common ancestry
- Portuguese 9% Lithuanian 3% Romanian 2%
- Foreign-born
- 11% · Canada
- Languages at home
- 82% English-only · Spanish 9% Other Asian/Pacific 1%
Political lean MEDSL · Rice
- 2024 margin
- Toss-up / Even · D 47.8% · R 50.3% · Other 1.8%
- 2008→2024 swing
- -14.0pp toward R · 2008: 11.5pp · 2024: -2.5pp
- All cycles
- 2024: R+2.5 2020: R+0.2 2016: R+3.1 2012: D+8.3 2008: D+11.5
Not yet ingested
- Civics
- —
Market trends
- HPI YoY
- ▼ -93.12%
- Current HPI
- 253.3996
- Rent YoY
- —
- Metro
- Faribault-Northfield, MN
- State GDP YoY
- ▲ 2.41%
- F500 in state
- 34
Industry mix (Fortune 500 HQ in MN)
| Industry | F500 HQs | Revenue |
|---|---|---|
| Healthcare | 2 | $407B |
|
||
| Retail | 2 | $150B |
|
||
| Consumer Goods | 2 | $32B |
|
||
| Industrial Machinery | 2 | $6B |
|
||
| Agriculture | 1 | $40B |
|
||
| Healthcare / Medical Devices | 1 | $32B |
|
||
Price history
+382.6% since first listed34 events — show timeline
- 2026-05-18 Pending — NORTHSTARMLS as Distributed by MLS Grid
- 2026-01-21 Listed $349,900 NORTHSTARMLS as Distributed by MLS Grid
- 2025-02-01 Rental Removed $1,250 REDFIN
- 2025-01-28 Listed for Rent $1,250 REDFIN
- 2025-01-13 Sold (MLS) $315,200 NORTHSTARMLS as Distributed by MLS Grid
- 2024-12-31 Pending — NORTHSTARMLS as Distributed by MLS Grid
- 2024-12-05 Contingent — NORTHSTARMLS as Distributed by MLS Grid
- 2024-11-18 Listed $309,900 NORTHSTARMLS as Distributed by MLS Grid
- 2018-02-06 Sold (Public Records) $85,000 Public Records
- 2018-01-22 Sold (MLS) $85,000 NORTHSTARMLS as Distributed by MLS Grid
- 2017-11-21 Pending — NORTHSTARMLS as Distributed by MLS Grid
- 2017-08-14 Price Changed $89,000 NORTHSTARMLS as Distributed by MLS Grid
- 2017-03-09 Listed $95,000 NORTHSTARMLS as Distributed by MLS Grid
- 2017-03-08 Listing Removed — NORTHSTARMLS as Distributed by MLS Grid
- 2016-03-08 Listed $99,000 NORTHSTARMLS as Distributed by MLS Grid
- 2016-03-01 Listing Removed — NORTHSTARMLS as Distributed by MLS Grid
- 2015-04-30 Listed $105,000 NORTHSTARMLS as Distributed by MLS Grid
- 2015-03-25 Listing Removed — NORTHSTARMLS as Distributed by MLS Grid
- 2014-07-28 Listed $113,000 NORTHSTARMLS as Distributed by MLS Grid
- 2014-04-05 Listing Removed — NORTHSTARMLS as Distributed by MLS Grid
- 2014-02-26 Listed $122,000 NORTHSTARMLS as Distributed by MLS Grid
- 2012-12-12 Listing Removed — NORTHSTARMLS as Distributed by MLS Grid
- 2012-06-30 Listed $149,900 NORTHSTARMLS as Distributed by MLS Grid
- 2012-06-27 Listing Removed — NORTHSTARMLS as Distributed by MLS Grid
- 2011-06-27 Listed $149,900 NORTHSTARMLS as Distributed by MLS Grid
- 2003-03-17 Sold (Public Records) $153,000 Public Records
- 2003-01-30 Sold (MLS) $153,000 NORTHSTARMLS as Distributed by MLS Grid
- 2002-11-19 Listing Removed — NORTHSTARMLS as Distributed by MLS Grid
- 2002-11-04 Listed $153,900 NORTHSTARMLS as Distributed by MLS Grid
- 2002-01-31 Sold (MLS) $98,500 NORTHSTARMLS as Distributed by MLS Grid
- 2002-01-03 Listing Removed — NORTHSTARMLS as Distributed by MLS Grid
- 2001-12-27 Listed $99,900 NORTHSTARMLS as Distributed by MLS Grid
- 1999-10-13 Sold (Public Records) $100,700 Public Records
- 1999-10-13 Sold (Public Records) $72,500 Public Records
Property tax history
+5.0%/yrLatest (2025): $2,612 · +13.2% YoY. Source: county tax records.
Cash-flow waterfall
monthlySold comps — $/sqft
last 12 mo · ≤1 miLoading sold comps…