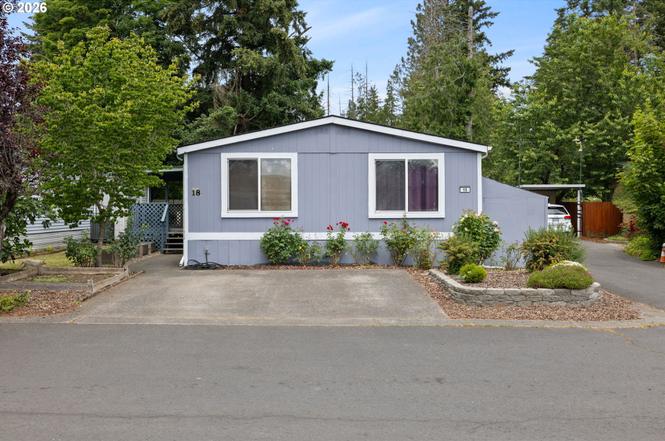
13141 SE Powell Blvd #18 · Portland, OR
Flood risk 1/10 · Minimal
- FEMA flood zone
- X (unshaded)
- Chance of flooding over 30 yrs
- 0.0%
- Est. flood insurance / yr
- $507 – $1,088
Fire risk 3/10 · Minor
- Est. fire insurance / yr
- $498 – $926
Heat risk 3/10 · Minor
- Hot days now (above 92°F)
- 7 days/yr
- Hot days in 30 yrs
- 15 days/yr
Wind risk 1/10 · Minimal
- Chance of severe wind over 30 yrs
- —
Air-quality risk 10/10 · Severe
- Unhealthy air days now
- 23 days/yr
- Unhealthy air days in 30 yrs
- 27 days/yr
Risk factors via First Street. Map © Google.
Why this score? — see what drove the B+ grade
The composite is a weighted blend of 9 inputs, each scored 0–100. Each bar is that input's sub-score; the figure is the points it added to the 100-point composite (weight × sub-score).
- Cash flow +30.0/30.0
- ARV discount +15.0/15.0
- 1% rule +10.0/10.0
- DSCR +10.0/10.0
- Livability +3.9/5.0
- Schools +3.7/10.0
- Rent growth +2.9/5.0
- Condition / age +2.5/5.0
- Appreciation +0.0/10.0
$125,000
🖨 Deal sheet 📄 Offer letter ✓ Due diligence
Listing remarks
Lovely well- maintained home with open floor plan in the home located in a friendly neighborhood park. Accessible to shopping and restaurants, highways. Located on a plot that offers a back yard.
Key facts
- Open floor plan
- Back yard
- Built 1987
Tags
Property features AI
Finance
- Financial info: Land lease on the space (monthly lot rent); land lease expires January 31, 2027
- HOA & community: Park Place Mobile Home Park community; Pet restrictions: contact the park
Exterior
- Parking: Driveway and off-street parking; Carport
- Utilities: Electric service and electric fuel; Public water; Public sewer; Internet: Cable and DSL
- Home design: Manufactured home in a park (Tamarak model by Tamarak/Champion Homes); Single-story / one level; City, park/greenbelt and trees/woods views
- Construction: Built in 1987; Skirting foundation; Composition roof
- Exterior features: Covered deck and deck; Yard; T-111 siding; Trees on the lot; Located on leased land in a mobile home park; Road access includes gravel and paved surfaces
Interior
- Kitchen: Dishwasher; Free‑standing range; Microwave
- Bedrooms: Primary bedroom on the main level; Second bedroom on the main level; Third bedroom on the main level
- Bathrooms: Two full bathrooms, both on the main level
- Heating & cooling: Heat pump heating; Hot water heating; Heat pump cooling
- Interior features: Accessible home with main-floor bedroom and bath; Accessible bathroom cabinets; One-level layout; Double-pane windows; Crawl space and storage space in the foundation
- Laundry & utility: Electric tank hot water
Neighborhood map
What this means for you Summary
Snapshot
- This is a 3-bed/2.0-bath manufactured listed at $125k.
Deal economics
- At list price, monthly cash flow is $965 ($12k/yr) — positive.
- The deal already cash-flows at list — no discount required.
- Meets the 1% rule at list price ($2k rent vs $125k).
- Cap rate 15.6% vs local median 2.2% in Portland — top-decile yield for the area; either an underpriced asset or a hidden risk that comps aren't pricing in. Stress-test before assuming the spread holds.
Location & tenants
- Location reads 77/100 on livability (#72 in OR, #3,256 nationally) — a middle-class / working-renter tenant base. Strengths: amenities A+, commute A+, health & safety A+; Watch: crime F, cost of living F.
- David Douglas SD 40 (urban): math 34% / reading 49% proficiency, ranked #99 of 183 in OR (top 54%) — families likely to look elsewhere, expect single-tenant / working-renter base with shorter leases; 68% free/reduced lunch — lower-income household profile, screen leases tightly.
- Zoned schools: Lincoln Park Elementary School (465 students, 82% FRL); Ron Russell Middle School (770 students, 77% FRL); David Douglas High School (2,698 students, 73% FRL).
- Market conditions: Rents rising (+1.6%/yr); 204 active listings in the ZIP; 30 comparable units currently listed for rent nearby; rentals at typical pace (median 24d on market — plan ~3-4 weeks tenant-placement turnaround); 43% of comp listings sitting > 30 days — soft ceiling on asking rent; solid renter incomes; 2,041 units permitted in Multnomah County in 2024 (905 in 5+ unit buildings).
- This rent runs 37% of the median local income ($75k/yr) — at the standard rent-burdened threshold; future hikes will face affordability resistance.
Forward outlook
- Local home prices are declining (-3.0%/yr); year-one equity from $864 of loan paydown is wiped out by about $4k of value loss. Plan a longer hold.
- Multnomah County population projected at +33% by 2050 — long-run rental-demand tailwind backs the buy-and-hold thesis.
- At projected returns (-3.0% appreciation + 1.6% rent growth), your $35k cash investment doubles in ~4 years — after that, you're playing with house money.
Negotiation context
- Only 4 days on market — expect competitive offers; lowballing is unlikely to land.
Questions for the listing agent
- Is there a deadline driving the sale (1031 exchange, divorce, estate, relocation)? That informs how much negotiation room exists.
- Crime grade is F in this area — have there been break-ins, vandalism, or insurance claims at this property in the last 3 years? What carrier currently insures it and at what premium?
- What's the average days-on-market for RENTAL listings here right now (not sales)? A rising rental-DOM trend means longer vacancies and softer asking-rent achievability than the comps imply.
- What's the recent tenant-quality profile in this submarket — average credit score on applications, eviction rate, late-payment / NSF rate, and stable-employment percentage? A property-management company in the area should have these aggregated.
- How much new for-sale + rental construction is in the pipeline within 1–3 miles? Heavy new supply typically softens prices + rents 12–24 months out; constrained supply supports both.
Investment metrics
- 1% rule
- 1.85% ✓
- Cap rate
- 15.55%
- Cash-on-cash
- 33.07%
- DSCR
- 2.47
- GRM
- 4.5
CMA / ARV
- ARV (on-the-fly)
- $162,624
- Comps found
- 1
Show comp detail 1 sale within ~0.75 mi
| Address | Dist | Beds/Ba | Sqft | Sold | Price | $/sf | Match |
|---|---|---|---|---|---|---|---|
| 13443 SE Pardee Dr #3 | 0.65mi | 3/2.0 | 1,620 (-12%) | 2mo | $142,000 | $88 | 48 |
Match score weights: distance 35% · size 25% · config 20% · recency 20%. Top-matched comps best support the ARV.
Projected returns pro-forma
-3.0% appreciation · 1.64% rent growth · sell at horizon
- IRR
- 26.7%
- Equity multiple
- 2.09×
- Total profit
- $38,090
- Equity at exit
- $18,638
- IRR
- 33.5%
- Equity multiple
- 3.86×
- Total profit
- $99,941
- Equity at exit
- $10,808
Cash invested: $35,000 (down + closing). Projections, not guarantees.
Landlord ↔ Tenant lean methodology
- Overall (CITY)
- 0 Strongly Tenant-Friendly
- State Oregon
- 28 Tenant-Leaning · D+6
- County
- — inherits STATE
- City Portland
- 0 Strongly Tenant-Friendly · D+39
ZIP-level market 97236
- Rents YoY
- 1.6%
- Active inventory
- 204
- Price-to-rent
- 4.5×
Monthly cashflow live
- Estimated rent
- $2,314 high interval (Pro) →
- Mortgage (P&I)
- −$656
- Tax est. 1.5%
- −$156 /mo · $1,875/yr
- Insurance
- −$52
- HOA
- −$0
- Vacancy / Maint / Mgmt
- −$486
- Net cashflow
- $965
Break-even live
UW: 25.0% down · 7.5% · 30yr · 1.5% tax · 5.0% vac · 8.0% maint · 8.0% mgmt
Financing live
Cash to close
- Down payment
- $31,250
- Closing costs
- $3,750
- Reserves months
- —
- Total cash needed
- —
Loan-product check · same deal, 3 products live
Conventional
25% down · 7.5% · 30yr
- Down + closing
- —
- Monthly P&I
- —
- Monthly cashflow
- —
- DSCR
- —
- Eligible?
- —
Personal DTI + credit; lowest rate.
DSCR
20% down · 8.5% · 30yr
- Down + closing
- —
- Monthly P&I
- —
- Monthly cashflow
- —
- DSCR
- —
- Eligible?
- —
No personal income docs; deal must DSCR.
Hard money
10% down · 12.0% · 12mo
- Down + closing
- —
- Monthly P&I
- —
- Monthly cashflow
- —
- DSCR
- —
- Eligible?
- —
Short-term bridge; refi at stabilization.
Rent comps 30 comps
| Address | Beds | Baths | Sqft | Rent | $/sqft | DOM | Units | Dist |
|---|---|---|---|---|---|---|---|---|
| 3315 SE 127th Pl Unit 1 Portland, OR | 2.0 | 1.0 | 1346 | $1,595 | $1.18 | 11d | 1 | 0.27mi |
| 12550 SE Powell Blvd Portland, OR | 1.0–3.0 | 1.0–2.0 | 1075 | $2,300 | $2.14 | 3d | 2 | 0.28mi |
| 3745-3749 SE 127th Pl Unit 3749 Portland, OR | 3.0 | 2.5 | 1467 | $2,195 | $1.50 | 8d | 1 | 0.32mi |
| 3883 SE 136th Ave Portland, OR | 4.0 | 2.5 | 1660 | $2,400 | $1.45 | 44d | 1 | 0.32mi |
| 12616 SE Taggart St Portland, OR | 3.0 | 1.5 | 1329 | $2,295 | $1.73 | 8d | 1 | 0.35mi |
| 2658 SE 125th Ave Unit 2654 Portland, OR | 3.0 | 2.5 | 1378 | $2,195 | $1.59 | 3d | 1 | 0.42mi |
| 13448 SE Division St Portland, OR | 4.0 | 2.0 | 1450 | $2,550 | $1.76 | 3d | 1 | 0.43mi |
| 13450 SE Division St Portland, OR | 4.0 | 2.0 | 1450 | $2,550 | $1.76 | 44d | 1 | 0.44mi |
| 3223 SE 122nd Ave Unit A-B Portland, OR | 4.0 | 2.5 | 1572 | $2,495 | $1.59 | 44d | 1 | 0.50mi |
| 12625 SE Division St Unit B Portland, OR | 3.0 | 2.5 | 1420 | $2,395 | $1.69 | 24d | 1 | 0.56mi |
| 13515 SE Holgate Blvd Portland, OR | 3.0 | 2.0 | 2160 | $2,495 | $1.16 | 44d | 1 | 0.64mi |
| 3810 SE 117th Pl Portland, OR | 3.0 | 2.5 | 1378 | $2,445 | $1.77 | 24d | 1 | 0.72mi |
| 4632 SE 122nd Ave Unit D Portland, OR | 4.0 | 2.0 | 2500 | $2,800 | $1.12 | 44d | 1 | 0.80mi |
| 4904 SE 122nd Ave Portland, OR | 3.0 | 3.0 | 1504 | $4,400 | $2.93 | 44d | 1 | 0.91mi |
| 14915 SE Woodward St Portland, OR | 4.0 | 2.0 | 1608 | $2,850 | $1.77 | 2d | 1 | 0.92mi |
| 12220 SE Mill St Portland, OR | 3.0 | 2.0 | 1573 | $2,550 | $1.62 | 24d | 1 | 0.92mi |
| 15075 SE Powell Blvd Apt 4 Portland, OR | 3.0 | 3.5 | 1500 | $2,395 | $1.60 | 44d | 1 | 0.98mi |
| 15075 SE Powell Blvd Portland, OR | 3.0 | 3.5 | 1500 | $2,295 | $1.53 | 4d | 3 | 0.98mi |
| 5329 SE 137th Ave Portland, OR | 3.0 | 2.5 | 1559 | $2,250 | $1.44 | 24d | 1 | 0.98mi |
| 5344 SE 137th Ave Portland, OR | 3.0 | 2.5 | 1600 | $2,395 | $1.50 | 18d | 1 | 0.99mi |
| 11938 SE Market St Portland, OR | 3.0 | 2.5 | 1578 | $2,500 | $1.58 | 44d | 1 | 1.09mi |
| 5524 SE 140th Pl Portland, OR | 4.0 | 3.0 | 1584 | $3,050 | $1.93 | 17d | 1 | 1.15mi |
| 11795 SE Market St Unit 11795 Portland, OR | 2.0 | 1.5 | 1250 | $1,800 | $1.44 | 44d | 1 | 1.18mi |
| 13726 SE Reedway St Portland, OR | 3.0 | 2.5 | 1817 | $2,295 | $1.26 | 44d | 1 | 1.18mi |
| 2623 SE 109th Ave Portland, OR | 3.0 | 3.5 | 1580 | $2,500 | $1.58 | 4d | 1 | 1.23mi |
| 14909 SE Mill St Portland, OR | 3.0 | 1.0 | 1550 | $2,495 | $1.61 | 20d | 1 | 1.24mi |
| 2611 SE 105th Ave Portland, OR | 3.0 | 2.5 | 1340 | $2,299 | $1.72 | 44d | 1 | 1.40mi |
| 6130 SE 128th Ave Apt B Portland, OR | 3.0 | 2.0 | 1500 | $1,999 | $1.33 | 8d | 1 | 1.40mi |
| 11739 SE Yamhill St Portland, OR | 3.0 | 2.5 | 1600 | $2,450 | $1.53 | 44d | 1 | 1.44mi |
| 5010 SE 108th Ave Portland, OR | 3.0 | 2.0 | 1400 | $2,350 | $1.68 | 44d | 1 | 1.46mi |
Listing history 5 events
-
2026-06-18days on market $125,000 Active 4 DOM
-
2026-06-17days on market $125,000 Active 3 DOM
-
2026-06-16days on market $125,000 Active 2 DOM
-
2026-06-15remarks 195-char remark
-
2026-06-15$125,000 Active 1 DOM
ⓘ Source: listings_history table (triggers on properties + properties_extension) + one-shot
backfill from property_details.listing_events for pre-trigger history.
Climate risk First Street
- Flood 1/10 Low FEMA zone X (unshaded) · 0% chance over 30 yrs
- Wildfire 3/10 Moderate
- Heat 3/10 Moderate 7 d/yr ≥92°F today · 15 d/yr by 30 yrs out
- Wind 1/10 Low
- Air quality 10/10 Extreme 23 unhealthy d/yr today · 27 by 30 yrs out
Nearby sold comps map
Loading sold comps map…
Walkable amenities ~0.75 mi
Loading nearby amenities…
Taxation est. · year 1
- Rental income
- $27,774
- − Mortgage interest
- −$7,002
- − Property taxes
- −$1,875
- − Insurance
- −$625
- − Repairs & maintenance
- −$2,222
- − Management
- −$2,222
- − Depreciation
- −$3,636
- Taxable income
- $10,192
- Est. tax owed @ 24.0%
- −$2,446
- After-tax cash flow
- $9,129/yr
For passive investors: Depreciation is non-cash, so a rental often shows a tax loss while cash-flowing — sheltering income. Rental losses are passive: they offset passive income freely, and up to $25,000/yr can offset ordinary (W-2) income if you actively participate and your MAGI is under $100k (phasing out to $0 by $150k); unused losses carry forward. On sale, claimed depreciation is recaptured at up to 25%, and gains may owe capital-gains tax (a 1031 exchange can defer both). Figures are a year-1 estimate at your 24.0% rate — not tax advice; consult a CPA.
Schools (NCES district)
- District
- David Douglas SD 40
- NCES district ID
- 4103940
- Math proficiency
- 34% ▲ 1.00%
- Reading proficiency
- 49% ▲ 1.00%
- Median HH income
- $42,781
- Composite
- 37.38/100
- National rank
- #8926
- State rank
- #99 of 183 in OR
Livability — Portland
- Score
- 77/100
- State rank
- #72
- US rank
- #3256
Category grades
Schools grade is shown separately in the Schools card above.
Census & demographics
- Census place
- Portland, OR
- County
- Multnomah County · 786,692 people
- City population
- 774,334
- Metro
- Portland-Vancouver-Hillsboro, OR-WA
- Population (ZIP)
- 37,558
- Household income
- $75,090
- Rent vs Own
- Severe rent burden
- 1744.0
Population outlook (Multnomah County) Hauer SSP2
- Today (2025)
- 930,825 people
- By 2030
- 996,904 · +7.1%
- By 2040
- 1,121,379 · +20.5%
- By 2050
- 1,242,124 · +33.4%
- By 2075
- 1,464,431 · +57.3%
- By 2100
- 1,576,181 · +69.3%
Race, ethnicity, and origin ACS 2023
- Neighborhood character
- Diverse neighborhood (Simpson 0.67)
- Race & ethnicity
- White 51% Hispanic / Latino 21% Asian 13% Two or more races 12% Black 9% Pacific Islander 1%
- Hispanic origin (detail)
- Mexican 15% Cuban 1%
- Common ancestry
- Italian 3% Scotch-Irish 2% Subsaharan African 2%
- Foreign-born
- 25% · Canada, Vietnam, China
- Languages at home
- 63% English-only · Spanish 16% Vietnamese 6% Russian/Polish/Slavic 5%
Political lean MEDSL · Multnomah
- 2024 margin
- Solid D (+62.1) · D 79.3% · R 17.2% · Other 3.5%
- 2008→2024 swing
- +6.0pp toward D · 2008: 56.1pp · 2024: 62.1pp
- All cycles
- 2024: D+62.1 2020: D+61.3 2016: D+58.3 2012: D+54.9 2008: D+56.1
Not yet ingested
- Civics
- —
Market trends
- HPI YoY
- ▼ -334.44%
- Current HPI
- 289.931
- Rent YoY
- ▲ 1.64%
- Metro
- Portland-Vancouver-Hillsboro, OR-WA
- State GDP YoY
- ▲ 2.05%
- F500 in state
- 2
Industry mix (Fortune 500 HQ in OR)
| Industry | F500 HQs | Revenue |
|---|---|---|
| Consumer Goods | 1 | $51B |
|
||
Price history
1 event — show timeline
- 2026-06-14 Listed $125,000 RMLS
Property tax history
-7.0%/yrLatest (2025): $145 · +38.3% YoY. Source: county tax records.
Cash-flow waterfall
monthlySold comps — $/sqft
last 12 mo · ≤1 miLoading sold comps…