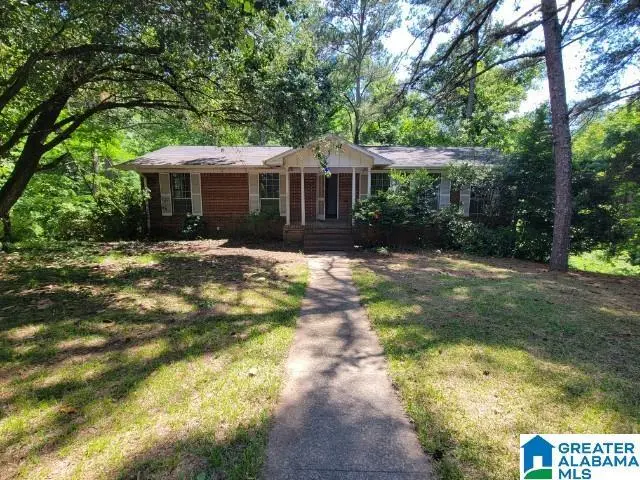
108 Remington Rd · Birmingham, AL
Flood risk 1/10 · Minimal
- FEMA flood zone
- X (unshaded)
- Chance of flooding over 30 yrs
- 0.0%
- Est. flood insurance / yr
- $473 – $860
Fire risk 3/10 · Minor
- Est. fire insurance / yr
- $916 – $1,700
Heat risk 5/10 · Moderate
- Hot days now (above 106°F)
- 7 days/yr
- Hot days in 30 yrs
- 19 days/yr
Wind risk 6/10 · Moderate
- Chance of severe wind over 30 yrs
- 27.0%
Air-quality risk 5/10 · Moderate
- Unhealthy air days now
- 7 days/yr
- Unhealthy air days in 30 yrs
- 9 days/yr
Risk factors via First Street. Map © Google.
Why this score? — see what drove the B grade
The composite is a weighted blend of 9 inputs, each scored 0–100. Each bar is that input's sub-score; the figure is the points it added to the 100-point composite (weight × sub-score).
- Cash flow +30.0/30.0
- ARV discount +15.0/15.0
- DSCR +10.0/10.0
- 1% rule +8.6/10.0
- Livability +3.4/5.0
- Rent growth +3.3/5.0
- Condition / age +2.5/5.0
- Schools +0.9/10.0
- Appreciation +0.0/10.0
$99,900
🖨 Deal sheet 📄 Offer letter ✓ Due diligence
Listing remarks
Investor Special! 3BR/2BA home at 108 Remington Road sold strictly "As Is. " This property is a blank canvas awaiting a total makeover. All plumbing and the exterior condenser unit have been removed. The interior features hardwood floors in need of repair, missing toilets, and non-functional kitchen appliances. The rear deck has been removed, providing a fresh start for outdoor design. Located in the Birmingham City School system with easy access via Center Point Pkwy. Cash or rehab loans only. Bring your toolbox and your vision!
Key facts
- 0.41 acre lot
- Garage
- Built 1966
Property features AI
Exterior
- Parking: Side garage entry; 1 total garage space (garage shown as 1 space, basement-level garage noted); Driveway parking
- Utilities: Public water; Connected sewer; Electric water heater; Internet service available
- Home design: 4-sided brick construction; Existing (already built); Tri-level: no; Split level: no; Split foyer: no
- Construction: 4-sided brick exterior; Basement foundation
- Exterior features: No pool; No patio, deck, or garden; Not waterfront; Basement foundation
Interior
- Kitchen: Laminate countertops
- Bedrooms: Master bedroom on main level; Additional bedrooms on main level
- Flooring: Hardwood; Tile; Vinyl
- Bathrooms: Two full bathrooms; Separate shower and tub/shower combo
- Heating & cooling: Forced air heating; No central air
- Interior features: Smooth ceilings; Unfinished daylight basement; Attic present; Main level living areas (living room, dining room, kitchen, keeping room, master bedroom and bath) - single level main living
- Laundry & utility: Laundry located in the basement; Utilities in garage; Electric dryer hookup
Neighborhood map
What this means for you Summary
Snapshot
- This is a 3-bed/2.0-bath single-family listed at $100k.
Deal economics
- At list price, monthly cash flow is $385 ($5k/yr) — positive.
- The deal already cash-flows at list — no discount required.
- Meets the 1% rule at list price ($1k rent vs $100k).
- Cap rate 10.9% vs local median 6.2% in Birmingham — top-decile yield for the area; either an underpriced asset or a hidden risk that comps aren't pricing in. Stress-test before assuming the spread holds.
Location & tenants
- Location reads 67/100 on livability (#78 in AL) — a middle-class / working-renter tenant base. Strengths: commute A+, cost of living A+, housing A+; Watch: amenities C-, crime F, employment F.
- Birmingham City (urban): math 4% / reading 20% proficiency, ranked #116 of 129 in AL (top 90%) — low school quality limits family demand, transient renter base, plan for 1-2y turnover; 82% free/reduced lunch — lower-income household profile, screen leases tightly.
- Zoned schools: Sun Valley Elementary School (math 2% / reading 17%, grade F, #568 of 627 statewide, top 94%, 611 students, 82% FRL); Huffman High Schoolmagnet (math 2% / reading 2%, grade F, #291 of 305 statewide, top 100%, 1,147 students, 72% FRL).
- Market conditions: Rents rising (+3.0%/yr); 334 active listings in the ZIP; 40 comparable units currently listed for rent nearby; rentals at typical pace (median 19d on market — plan ~3-4 weeks tenant-placement turnaround); 2,114 units permitted in Jefferson County in 2024 (556 in 5+ unit buildings).
- This rent runs 31% of the median local income ($53k/yr) — at the standard rent-burdened threshold; future hikes will face affordability resistance.
Forward outlook
- Local home prices are declining (-3.0%/yr); year-one equity from $691 of loan paydown is wiped out by about $3k of value loss. Plan a longer hold.
- Jefferson County population projected to shrink 4% by 2050 — rents likely to lag national; underwrite the cash flow, not the appreciation.
- At projected returns (-3.0% appreciation + 3.0% rent growth), your $28k cash investment doubles in ~8 years — after that, you're playing with house money.
Negotiation context
- Only 7 days on market — expect competitive offers; lowballing is unlikely to land.
Risks & watch-outs
- Climate carrying-cost: major wind risk, 27% chance of damaging wind over 30y; extreme-heat days projected 7→19/yr by 2055 (HVAC capex compounding) — expect insurance premiums to compound above CPI over the hold.
Questions for the listing agent
- Built in 1966 — when were the roof, HVAC, electrical panel, plumbing, and water heater last replaced?
- Is there a deadline driving the sale (1031 exchange, divorce, estate, relocation)? That informs how much negotiation room exists.
- Schools are F-rated, which usually means shorter tenancies and higher turnover. Who's the typical renter profile here, and what's been the actual vacancy rate?
- Crime grade is F in this area — have there been break-ins, vandalism, or insurance claims at this property in the last 3 years? What carrier currently insures it and at what premium?
- What's the average days-on-market for RENTAL listings here right now (not sales)? A rising rental-DOM trend means longer vacancies and softer asking-rent achievability than the comps imply.
- What's the recent tenant-quality profile in this submarket — average credit score on applications, eviction rate, late-payment / NSF rate, and stable-employment percentage? A property-management company in the area should have these aggregated.
- How much new for-sale + rental construction is in the pipeline within 1–3 miles? Heavy new supply typically softens prices + rents 12–24 months out; constrained supply supports both.
Investment metrics
- 1% rule
- 1.36% ✓
- Cap rate
- 10.92%
- Cash-on-cash
- 16.51%
- DSCR
- 1.73
- GRM
- 6.1
CMA / ARV
- ARV (median comp)
- $174,715
- List price
- $99,900
- Delta
- -42.82%
- Verdict
- UNDERPRICED
- Comps
- 20 within 1.0 mi
Show comp detail 12 sales within ~0.75 mi
| Address | Dist | Beds/Ba | Sqft | Sold | Price | $/sf | Match |
|---|---|---|---|---|---|---|---|
| 108 Remington Rd | 0.00mi | 3/2.0 | 1,568 (0%) | 0mo | $103,000 | $66 | 100 |
| 134 Freda Jane Ln | 0.22mi | 3/2.0 | 1,561 (-0%) | 3mo | $170,000 | $109 | 87 |
| 201 Redstone Way | 0.18mi | 3/2.0 | 1,582 (+1%) | 8mo | $182,000 | $115 | 83 |
| 118 Redstone Dr | 0.37mi | 3/2.0 | 1,570 (+0%) | 2mo | $112,000 | $71 | 81 |
| 205 Redstone Way | 0.17mi | 4/2.0 (+1) | 1,478 (-6%) | 7mo | $175,000 | $118 | 72 |
| 945 Nelson Dr | 0.74mi | 3/2.0 | 1,563 (-0%) | 6mo | $170,000 | $109 | 60 |
| 937 Hickory Dr | 0.64mi | 4/2.0 (+1) | 1,622 (+3%) | 6mo | $165,000 | $102 | 54 |
| 321 Glynn Dr | 0.73mi | 3/1.5 | 1,401 (-11%) | 1mo | $140,000 | $100 | 45 |
| 93 Moonglow Dr | 0.70mi | 3/1.0 | 1,680 (+7%) | 10mo | $127,000 | $76 | 43 |
| 437 Wedgeworth Rd | 0.75mi | 2/1.5 (-1) | 1,407 (-10%) | 2mo | $114,900 | $82 | 39 |
| 1125 Five Mile Rd | 0.72mi | 3/2.0 | 1,346 (-14%) | 6mo | $140,000 | $104 | 38 |
| 1152 Dogwood Ln | 0.75mi | 3/1.0 | 1,371 (-13%) | 4mo | $127,000 | $93 | 37 |
Match score weights: distance 35% · size 25% · config 20% · recency 20%. Top-matched comps best support the ARV.
Projected returns pro-forma
-3.0% appreciation · 3.04% rent growth · sell at horizon
- IRR
- 7.7%
- Equity multiple
- 1.30×
- Total profit
- $8,398
- Equity at exit
- $14,895
- IRR
- 17.0%
- Equity multiple
- 2.40×
- Total profit
- $39,182
- Equity at exit
- $8,638
Cash invested: $27,972 (down + closing). Projections, not guarantees.
Landlord ↔ Tenant lean methodology
- Overall (STATE)
- 90 Strongly Landlord-Friendly
- State Alabama
- 90 Strongly Landlord-Friendly · R+15
- County
- — inherits STATE
- City
- — inherits STATE
ZIP-level market 35215
- Home prices YoY
- -34.4%
- Rents YoY
- 3.0%
- Active inventory
- 334
- Price-to-rent
- 6.1×
Monthly cashflow live
- Estimated rent
- $1,361 high interval (Pro) →
- Mortgage (P&I)
- −$524
- Tax est. 1.5%
- −$125 /mo · $1,498/yr
- Insurance
- −$42
- HOA
- −$0
- Vacancy / Maint / Mgmt
- −$286
- Net cashflow
- $385
Break-even live
UW: 25.0% down · 7.5% · 30yr · 1.5% tax · 5.0% vac · 8.0% maint · 8.0% mgmt
Financing live
Cash to close
- Down payment
- $24,975
- Closing costs
- $2,997
- Reserves months
- —
- Total cash needed
- —
Loan-product check · same deal, 3 products live
Conventional
25% down · 7.5% · 30yr
- Down + closing
- —
- Monthly P&I
- —
- Monthly cashflow
- —
- DSCR
- —
- Eligible?
- —
Personal DTI + credit; lowest rate.
DSCR
20% down · 8.5% · 30yr
- Down + closing
- —
- Monthly P&I
- —
- Monthly cashflow
- —
- DSCR
- —
- Eligible?
- —
No personal income docs; deal must DSCR.
Hard money
10% down · 12.0% · 12mo
- Down + closing
- —
- Monthly P&I
- —
- Monthly cashflow
- —
- DSCR
- —
- Eligible?
- —
Short-term bridge; refi at stabilization.
Rent comps 40 comps
| Address | Beds | Baths | Sqft | Rent | $/sqft | DOM | Units | Dist |
|---|---|---|---|---|---|---|---|---|
| 1128 Lay Dr Birmingham, AL | 3.0 | 1.5 | 1700 | $1,410 | $0.83 | 11d | 1 | 0.19mi |
| 241 Mamie Ln Birmingham, AL | 3.0 | 2.0 | 1242 | $1,495 | $1.20 | 3d | 1 | 0.24mi |
| 217 Killough Dr Birmingham, AL | 3.0 | 2.0 | 1212 | $1,200 | $0.99 | 14d | 1 | 0.27mi |
| 46 Sunscape Dr Birmingham, AL | 4.0 | 2.0 | 1178 | $1,450 | $1.23 | 43d | 1 | 0.50mi |
| 40 Sunscape Dr Birmingham, AL | 3.0 | 2.0 | 1283 | $1,555 | $1.21 | 1d | 1 | 0.55mi |
| 957 Hickory Cir Birmingham, AL | 3.0 | 2.0 | 1364 | $1,195 | $0.88 | 3d | 1 | 0.58mi |
| 617 Carson Crest Cir Birmingham, AL | 4.0 | 2.0 | 1528 | $1,723 | $1.13 | 15d | 1 | 0.62mi |
| 1177 Five Mile Rd Birmingham, AL | 3.0 | 2.0 | 1636 | $1,100 | $0.67 | 43d | 1 | 0.75mi |
| 769 15th Ct NW Birmingham, AL | 3.0 | 1.5 | 1130 | $1,310 | $1.16 | 11d | 1 | 0.80mi |
| 921 Charles Ct Birmingham, AL | 4.0 | 2.0 | 1529 | $1,450 | $0.95 | 43d | 1 | 0.82mi |
| 316 Pine St Birmingham, AL | 3.0 | 1.0 | 1232 | $1,100 | $0.89 | 43d | 1 | 0.83mi |
| 1112 Violet Dr Birmingham, AL | 3.0 | 2.0 | 1414 | $1,600 | $1.13 | 11d | 1 | 0.83mi |
| 252 Westwood Dr Birmingham, AL | 3.0 | 1.5 | 1124 | $1,400 | $1.25 | 1d | 1 | 0.84mi |
| 433 Orchid Rd Birmingham, AL | 3.0 | 1.0 | 1162 | $1,255 | $1.08 | 15d | 1 | 0.87mi |
| 945 Elizabeth Dr Birmingham, AL | 3.0 | 1.0 | 1227 | $1,125 | $0.92 | 3d | 1 | 0.92mi |
| 1301 5th Pl NW Center Point, AL | 3.0 | 1.0 | 1170 | $1,100 | $0.94 | 3d | 1 | 0.93mi |
| 621 15th Ave NW Birmingham, AL | 4.0 | 2.0 | 1070 | $1,200 | $1.12 | 15d | 1 | 0.94mi |
| 1305 5th Pl NW Center Point, AL | 3.0 | 2.0 | 1092 | $1,200 | $1.10 | 43d | 1 | 0.95mi |
| 1328 5th Pl NW Center Point, AL | 3.0 | 1.0 | 1250 | $1,050 | $0.84 | 15d | 1 | 0.96mi |
| 932 Five Mile Rd Birmingham, AL | 3.0 | 1.5 | 1200 | $1,175 | $0.98 | 19d | 1 | 0.96mi |
| 400 13th Ave NW Birmingham, AL | 2.0 | 1.0 | 1100 | $890 | $0.81 | 43d | 1 | 0.97mi |
| 1333 5th Pl NW Center Point, AL | 3.0 | 2.0 | 1056 | $1,275 | $1.21 | 43d | 1 | 1.00mi |
| 1232 Oakwood St Birmingham, AL | 3.0 | 1.5 | 1301 | $1,223 | $0.94 | 23d | 1 | 1.00mi |
| 1356 5th Pl NW Center Point, AL | 3.0 | 1.0 | 1064 | $1,105 | $1.04 | 43d | 1 | 1.01mi |
| 940 Meadowbrook Dr Birmingham, AL | 4.0 | 1.0 | 1149 | $1,300 | $1.13 | 43d | 1 | 1.03mi |
| 221 Lawson Rd Birmingham, AL | 3.0 | 1.5 | 1102 | $1,325 | $1.20 | 23d | 1 | 1.08mi |
| 1225 Birchwood St Birmingham, AL | 3.0 | 2.0 | 1092 | $1,175 | $1.08 | 3d | 1 | 1.08mi |
| 929 Meadowbrook Dr Birmingham, AL | 3.0 | 2.0 | 1649 | $1,200 | $0.73 | 11d | 1 | 1.08mi |
| 520 Camellia Rd Birmingham, AL | 3.0 | 1.0 | 1053 | $1,100 | $1.04 | 3d | 1 | 1.08mi |
| 912 Meadowbrook Dr Birmingham, AL | 3.0 | 1.0 | 1178 | $1,100 | $0.93 | 43d | 1 | 1.09mi |
| 500 15th Ave NW Center Point, AL | 3.0 | 1.0 | 1079 | $1,050 | $0.97 | 2d | 1 | 1.12mi |
| 1153 Linwood St Birmingham, AL | 3.0 | 2.0 | 1250 | $1,295 | $1.04 | 2d | 1 | 1.12mi |
| 832 Meadowbrook Dr Birmingham, AL | 3.0 | 2.0 | 1228 | $1,225 | $1.00 | 23d | 1 | 1.15mi |
| 1237 Linwood St Birmingham, AL | 3.0 | 1.5 | 1066 | $995 | $0.93 | 43d | 1 | 1.15mi |
| 405 13th Ct NW Center Point, AL | 4.0 | 1.5 | 1248 | $1,415 | $1.13 | 21d | 1 | 1.15mi |
| 120 Shawnee Ln NW Birmingham, AL | 3.0 | 1.0 | 1120 | $1,075 | $0.96 | 43d | 1 | 1.19mi |
| 324 13th Ter NW Center Point, AL | 3.0 | 1.5 | 1418 | $1,295 | $0.91 | 23d | 1 | 1.20mi |
| 656 Valley Crest Dr Birmingham, AL | 2.0 | 1.5 | 1088 | $1,350 | $1.24 | 1d | 1 | 1.22mi |
| 1612 Glenwood St NW Center Point, AL | 4.0 | 3.0 | 1344 | $1,480 | $1.10 | 23d | 1 | 1.23mi |
| 108 13th Ave NW Center Point, AL | 4.0 | 2.0 | 1444 | $1,265 | $0.88 | 23d | 1 | 1.31mi |
Listing history 1 events
-
2026-04-29$99,900 Active 545-char remark
ⓘ Source: listings_history table (triggers on properties + properties_extension) + one-shot
backfill from property_details.listing_events for pre-trigger history.
Climate risk First Street
- Flood 1/10 Low FEMA zone X (unshaded) · 0% chance over 30 yrs
- Wildfire 3/10 Moderate
- Heat 5/10 Major 7 d/yr ≥106°F today · 19 d/yr by 30 yrs out
- Wind 6/10 Major 27% chance of damaging wind over 30 yrs
- Air quality 5/10 Major 7 unhealthy d/yr today · 9 by 30 yrs out
Nearby sold comps map
Loading sold comps map…
Walkable amenities ~0.75 mi
Loading nearby amenities…
Taxation est. · year 1
- Rental income
- $16,332
- − Mortgage interest
- −$5,596
- − Property taxes
- −$1,498
- − Insurance
- −$500
- − Repairs & maintenance
- −$1,307
- − Management
- −$1,307
- − Depreciation
- −$2,906
- Taxable income
- $3,219
- Est. tax owed @ 24.0%
- −$773
- After-tax cash flow
- $3,845/yr
For passive investors: Depreciation is non-cash, so a rental often shows a tax loss while cash-flowing — sheltering income. Rental losses are passive: they offset passive income freely, and up to $25,000/yr can offset ordinary (W-2) income if you actively participate and your MAGI is under $100k (phasing out to $0 by $150k); unused losses carry forward. On sale, claimed depreciation is recaptured at up to 25%, and gains may owe capital-gains tax (a 1031 exchange can defer both). Figures are a year-1 estimate at your 24.0% rate — not tax advice; consult a CPA.
Schools (NCES district)
- District
- Birmingham City
- NCES district ID
- 0100390
- Math proficiency
- 4% ▼ -17.00%
- Reading proficiency
- 20% ▼ -4.00%
- Median HH income
- $31,988
- Composite
- 9.49/100
- National rank
- #9850
- State rank
- #116 of 129 in AL
Livability — Birmingham
- Score
- 67/100
- State rank
- #78
- US rank
- #10412
Category grades
Schools grade is shown separately in the Schools card above.
Census & demographics
- Census place
- Birmingham, AL
- County
- Jefferson County · 527,445 people
- City population
- 210,422
- Metro
- Birmingham-Hoover, AL
- Population (ZIP)
- 43,903
- Household income
- $52,793
- Rent vs Own
- Severe rent burden
- 1729.0
Population outlook (Jefferson County) Hauer SSP2
- Today (2025)
- 669,185 people
- By 2030
- 669,694 · +0.1%
- By 2040
- 661,388 · -1.2%
- By 2050
- 643,086 · -3.9%
- By 2075
- 577,267 · -13.7%
- By 2100
- 474,758 · -29.1%
Race, ethnicity, and origin ACS 2023
- Neighborhood character
- Predominantly Black (75%)
- Race & ethnicity
- Black 75% White 15% Hispanic / Latino 7% Two or more races 3%
- Hispanic origin (detail)
- Mexican 4%
- Common ancestry
- Lithuanian 1% Italian 1% Slovak 1%
- Foreign-born
- 4% · Canada
- Languages at home
- 92% English-only · Spanish 7%
Political lean MEDSL · Jefferson
- 2024 margin
- D (+10.4) · D 54.6% · R 44.2% · Other 1.2%
- 2008→2024 swing
- +5.4pp toward D · 2008: 5.1pp · 2024: 10.4pp
- All cycles
- 2024: D+10.4 2020: D+13.2 2016: D+7.2 2012: D+6.0 2008: D+5.1
Not yet ingested
- Civics
- —
Market trends
- HPI YoY
- ▼ -112.97%
- Current HPI
- 215.0607
- Rent YoY
- ▲ 3.04%
- Metro
- Birmingham-Hoover, AL
- State GDP YoY
- ▲ 2.94%
- F500 in state
- 4
Industry mix (Fortune 500 HQ in AL)
| Industry | F500 HQs | Revenue |
|---|---|---|
| Financial Services | 1 | $8B |
|
||
| Healthcare | 1 | $5B |
|
||
Price history
+3.1% since first listed3 events — show timeline
- 2026-06-05 Sold (MLS) $103,000 Greater Alabama MLS
- 2026-05-21 Pending — Greater Alabama MLS
- 2026-04-29 Listed $99,900 Greater Alabama MLS
Cash-flow waterfall
monthlySold comps — $/sqft
last 12 mo · ≤1 miLoading sold comps…