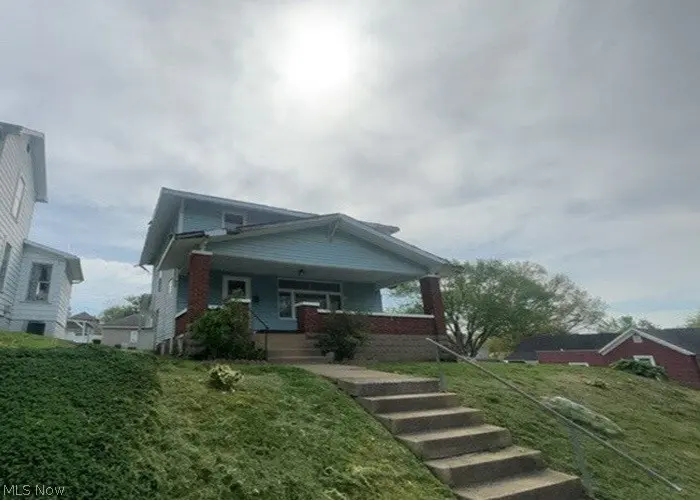
604 N 5th St · Cambridge, OH
Flood risk 1/10 · Minimal
- FEMA flood zone
- X (unshaded)
- Chance of flooding over 30 yrs
- 0.0%
- Est. flood insurance / yr
- $473 – $860
Fire risk 1/10 · Minimal
- Est. fire insurance / yr
- $713 – $1,323
Heat risk 3/10 · Minor
- Hot days now (above 99°F)
- 7 days/yr
- Hot days in 30 yrs
- 18 days/yr
Wind risk 1/10 · Minimal
- Chance of severe wind over 30 yrs
- 1.0%
Air-quality risk 2/10 · Minimal
- Unhealthy air days now
- 1 days/yr
- Unhealthy air days in 30 yrs
- 1 days/yr
Risk factors via First Street. Map © Google.
Why this score? — see what drove the D grade
The composite is a weighted blend of 9 inputs, each scored 0–100. Each bar is that input's sub-score; the figure is the points it added to the 100-point composite (weight × sub-score).
- Cash flow +15.0/30.0
- ARV discount +7.5/15.0
- 1% rule +5.0/10.0
- DSCR +5.0/10.0
- Livability +3.4/5.0
- Schools +2.9/10.0
- Rent growth +2.5/5.0
- Condition / age +2.5/5.0
- Appreciation +0.0/10.0
$23,400
🖨 Deal sheet 📄 Offer letter ✓ Due diligence
Listing remarks
Great opportunity to buy this two story fixer upper located in Cambridge, OH and sitting on a . 16 acre lot (53x132) with a covered front porch and a back deck. The interior has 1476 sq. ft. with 3 bedrooms and 1 bathroom, living room, dining room, plus a full basement with a built in 1 car garage
Key facts
- 6,995 sq ft lot
- Garage
- Built 1926
Property features AI
Exterior
- Parking: Built-in parking; One-car garage
- Utilities: Public water; Public sewer
- Home design: Two-story home; Vinyl siding; Slate roof; Above-grade finished area approximately 1,476
- Construction: Built per appraiser records; Vinyl siding construction
- Exterior features: Public water; Public sewer
Interior
- Bedrooms: One main-level bedroom
- Bathrooms: One full bathroom (main level)
- Heating & cooling: Forced-air gas heating
- Interior features: Full unfinished basement
Neighborhood map
What this means for you Summary
Snapshot
- This is a 3-bed/1.0-bath single-family listed at $23k.
Deal economics
- At list price, monthly cash flow is $1k ($12k/yr) — positive.
- The deal already cash-flows at list — no discount required.
- Meets the 1% rule at list price ($2k rent vs $23k).
- Cap rate 59.0% vs local median 5.7% in Cambridge — top-decile yield for the area; either an underpriced asset or a hidden risk that comps aren't pricing in. Stress-test before assuming the spread holds.
Location & tenants
- Location reads 68/100 on livability (#579 in OH) — a middle-class / working-renter tenant base. Strengths: cost of living A+, housing A+, crime A-; Watch: amenities D-, commute F, employment D-.
- Cambridge City (town): math 28% / reading 42% proficiency, ranked #565 of 656 in OH (top 86%) — families likely to look elsewhere, expect single-tenant / working-renter base with shorter leases.
- Market conditions: 90 active listings in the ZIP; 37 units permitted in Guernsey County in 2024 (0 in 5+ unit buildings).
- This rent runs 35% of the median local income ($52k/yr) — at the standard rent-burdened threshold; future hikes will face affordability resistance.
Forward outlook
- Local home prices are declining (-3.0%/yr); year-one equity from $162 of loan paydown is wiped out by about $702 of value loss. Plan a longer hold.
- Guernsey County population projected at -20% by 2050 — secular population decline; favor cash flow + early exit over multi-decade hold.
- At projected returns (-3.0% appreciation + 3.0% rent growth), your $7k cash investment doubles in ~1 year — after that, you're playing with house money.
Negotiation context
- Only 9 days on market — expect competitive offers; lowballing is unlikely to land.
Risks & watch-outs
- Watch-outs: built in 1926 — expect roof / HVAC / electrical / plumbing capex.
Questions for the listing agent
- Built in 1926 — when were the roof, HVAC, electrical panel, plumbing, and water heater last replaced?
- Is there a deadline driving the sale (1031 exchange, divorce, estate, relocation)? That informs how much negotiation room exists.
- The area grade is low — what's the realistic commute time and amenity access for the typical tenant pool here? Any planned neighborhood developments (good or bad) we should know about?
- What's the average days-on-market for RENTAL listings here right now (not sales)? A rising rental-DOM trend means longer vacancies and softer asking-rent achievability than the comps imply.
- What's the recent tenant-quality profile in this submarket — average credit score on applications, eviction rate, late-payment / NSF rate, and stable-employment percentage? A property-management company in the area should have these aggregated.
- How much new for-sale + rental construction is in the pipeline within 1–3 miles? Heavy new supply typically softens prices + rents 12–24 months out; constrained supply supports both.
Investment metrics
- 1% rule
- 6.44% ✓
- Cap rate
- 59.02%
- Cash-on-cash
- 188.32%
- DSCR
- 9.38
- GRM
- 1.3
CMA / ARV
- ARV (on-the-fly)
- $168,264
- Comps found
- 12
Show comp detail 12 sales within ~0.75 mi
| Address | Dist | Beds/Ba | Sqft | Sold | Price | $/sf | Match |
|---|---|---|---|---|---|---|---|
| 604 N 5th St | 0.00mi | 3/1.0 | 1,476 (0%) | 1mo | $40,000 | $27 | 99 |
| 428 Foster Ave | 0.09mi | 4/1.0 (+1) | 1,408 (-5%) | 6mo | $69,000 | $49 | 78 |
| 620 N 9 St | 0.36mi | 3/1.5 | 1,400 (-5%) | 4mo | $222,000 | $159 | 69 |
| 506 N 10th | 0.47mi | 3/1.5 | 1,528 (+4%) | 7mo | $185,000 | $121 | 64 |
| 424 Gomber Ave | 0.32mi | 3/1.5 | 1,600 (+8%) | 9mo | $50,000 | $31 | 62 |
| 532 Orchard Ave | 0.70mi | 3/1.5 | 1,433 (-3%) | 3mo | $174,500 | $122 | 58 |
| 516 N 11th St | 0.54mi | 3/2.0 | 1,344 (-9%) | 4mo | $182,000 | $135 | 53 |
| 431 N 12th St | 0.58mi | 3/2.0 | 1,320 (-11%) | 7mo | $55,000 | $42 | 46 |
| 600 Orchard Ave | 0.70mi | 3/2.0 | 1,381 (-6%) | 9mo | $158,000 | $114 | 45 |
| 1206 Foster Ave | 0.60mi | 3/1.5 | 1,268 (-14%) | 5mo | $180,000 | $142 | 42 |
| 1408 Stewart Ave | 0.74mi | 3/1.5 | 1,642 (+11%) | 4mo | $182,000 | $111 | 41 |
| 303 Mathews Dr | 0.70mi | 2/1.5 (-1) | 1,336 (-10%) | 8mo | $128,750 | $96 | 38 |
Match score weights: distance 35% · size 25% · config 20% · recency 20%. Top-matched comps best support the ARV.
Projected returns pro-forma
-3.0% appreciation · 3.0% rent growth · sell at horizon
- IRR
- —
- Equity multiple
- 10.42×
- Total profit
- $61,718
- Equity at exit
- $3,489
- IRR
- —
- Equity multiple
- 22.09×
- Total profit
- $138,161
- Equity at exit
- $2,023
Cash invested: $6,552 (down + closing). Projections, not guarantees.
Landlord ↔ Tenant lean methodology
- Overall (STATE)
- 73 Landlord-Friendly
- State Ohio
- 73 Landlord-Friendly · R+6
- County
- — inherits STATE
- City
- — inherits STATE
ZIP-level market 43725
- Active inventory
- 90
- Price-to-rent
- 1.3×
Monthly cashflow live
- Estimated rent
- $1,506 medium interval (Pro) →
- Mortgage (P&I)
- −$123
- Tax est. 1.5%
- −$29 /mo · $351/yr
- Insurance
- −$10
- HOA
- −$0
- Vacancy / Maint / Mgmt
- −$316
- Net cashflow
- $1,028
Break-even live
UW: 25.0% down · 7.5% · 30yr · 1.5% tax · 5.0% vac · 8.0% maint · 8.0% mgmt
Financing live
Cash to close
- Down payment
- $5,850
- Closing costs
- $702
- Reserves months
- —
- Total cash needed
- —
Loan-product check · same deal, 3 products live
Conventional
25% down · 7.5% · 30yr
- Down + closing
- —
- Monthly P&I
- —
- Monthly cashflow
- —
- DSCR
- —
- Eligible?
- —
Personal DTI + credit; lowest rate.
DSCR
20% down · 8.5% · 30yr
- Down + closing
- —
- Monthly P&I
- —
- Monthly cashflow
- —
- DSCR
- —
- Eligible?
- —
No personal income docs; deal must DSCR.
Hard money
10% down · 12.0% · 12mo
- Down + closing
- —
- Monthly P&I
- —
- Monthly cashflow
- —
- DSCR
- —
- Eligible?
- —
Short-term bridge; refi at stabilization.
Listing history 2 events
-
2026-04-29status Pending
-
2026-04-20$23,400 Active
ⓘ Source: listings_history table (triggers on properties + properties_extension) + one-shot
backfill from property_details.listing_events for pre-trigger history.
Climate risk First Street
- Flood 1/10 Low FEMA zone X (unshaded) · 0% chance over 30 yrs
- Wildfire 1/10 Low
- Heat 3/10 Moderate 7 d/yr ≥99°F today · 18 d/yr by 30 yrs out
- Wind 1/10 Low 100% chance of damaging wind over 30 yrs
- Air quality 2/10 Low 1 unhealthy d/yr today · 1 by 30 yrs out
Nearby sold comps map
Loading sold comps map…
Walkable amenities ~0.75 mi
Loading nearby amenities…
Taxation est. · year 1
- Rental income
- $18,075
- − Mortgage interest
- −$1,311
- − Property taxes
- −$351
- − Insurance
- −$117
- − Repairs & maintenance
- −$1,446
- − Management
- −$1,446
- − Depreciation
- −$681
- Taxable income
- $12,723
- Est. tax owed @ 24.0%
- −$3,054
- After-tax cash flow
- $9,285/yr
For passive investors: Depreciation is non-cash, so a rental often shows a tax loss while cash-flowing — sheltering income. Rental losses are passive: they offset passive income freely, and up to $25,000/yr can offset ordinary (W-2) income if you actively participate and your MAGI is under $100k (phasing out to $0 by $150k); unused losses carry forward. On sale, claimed depreciation is recaptured at up to 25%, and gains may owe capital-gains tax (a 1031 exchange can defer both). Figures are a year-1 estimate at your 24.0% rate — not tax advice; consult a CPA.
Schools (NCES district)
- District
- Cambridge City
- NCES district ID
- 3904369
- Math proficiency
- 28% ▼ -28.00%
- Reading proficiency
- 42% ▼ -17.00%
- Median HH income
- $33,874
- Composite
- 28.76/100
- National rank
- #6673
- State rank
- #565 of 656 in OH
Livability — Cambridge
- Score
- 68/100
- State rank
- #579
- US rank
- #9829
Category grades
Schools grade is shown separately in the Schools card above.
Census & demographics
- Census place
- Cambridge, OH
- County
- Guernsey · 34,843 people
- Population (ZIP)
- 19,728
- Household income
- $51,612
- Rent vs Own
- Severe rent burden
- 12.5
Population outlook (Guernsey County) Hauer SSP2
- Today (2025)
- 37,281 people
- By 2030
- 35,900 · -3.7%
- By 2040
- 32,861 · -11.9%
- By 2050
- 29,700 · -20.3%
- By 2075
- 22,199 · -40.5%
- By 2100
- 15,192 · -59.3%
Race, ethnicity, and origin ACS 2023
- Neighborhood character
- Predominantly White (91%)
- Race & ethnicity
- White 91% Two or more races 4% Black 3% Hispanic / Latino 2%
- Common ancestry
- Lithuanian 3% Slovak 2% Serbian 2%
- Foreign-born
- 1% · Canada
- Languages at home
- 98% English-only · Spanish 1% German/W. Germanic 1%
Political lean MEDSL · Guernsey
- 2024 margin
- Solid R (+52.1) · D 23.6% · R 75.7%
- 2008→2024 swing
- -43.0pp toward R · 2008: -9.1pp · 2024: -52.1pp
- All cycles
- 2024: R+52.1 2020: R+48.4 2016: R+42.6 2012: R+9.7 2008: R+9.1
Not yet ingested
- Civics
- —
Market trends
- HPI YoY
- ▼ -167.03%
- Current HPI
- 197.722
- Rent YoY
- —
- Metro
- —
- State GDP YoY
- ▲ 1.98%
- F500 in state
- 48
Industry mix (Fortune 500 HQ in OH)
| Industry | F500 HQs | Revenue |
|---|---|---|
| Insurance | 3 | $145B |
|
||
| Industrial Machinery | 3 | $49B |
|
||
| Financial Services | 3 | $24B |
|
||
| Consumer Goods | 2 | $93B |
|
||
| Aerospace / Defense | 2 | $47B |
|
||
| Utilities | 2 | $33B |
|
||
Price history
2 events — show timeline
- 2026-04-29 Pending — MLSNOW
- 2026-04-20 Listed $23,400 MLSNOW
Property tax history
+4.4%/yrLatest (2025): $1,358 · +2.9% YoY. Source: county tax records.
Cash-flow waterfall
monthlySold comps — $/sqft
last 12 mo · ≤1 miLoading sold comps…