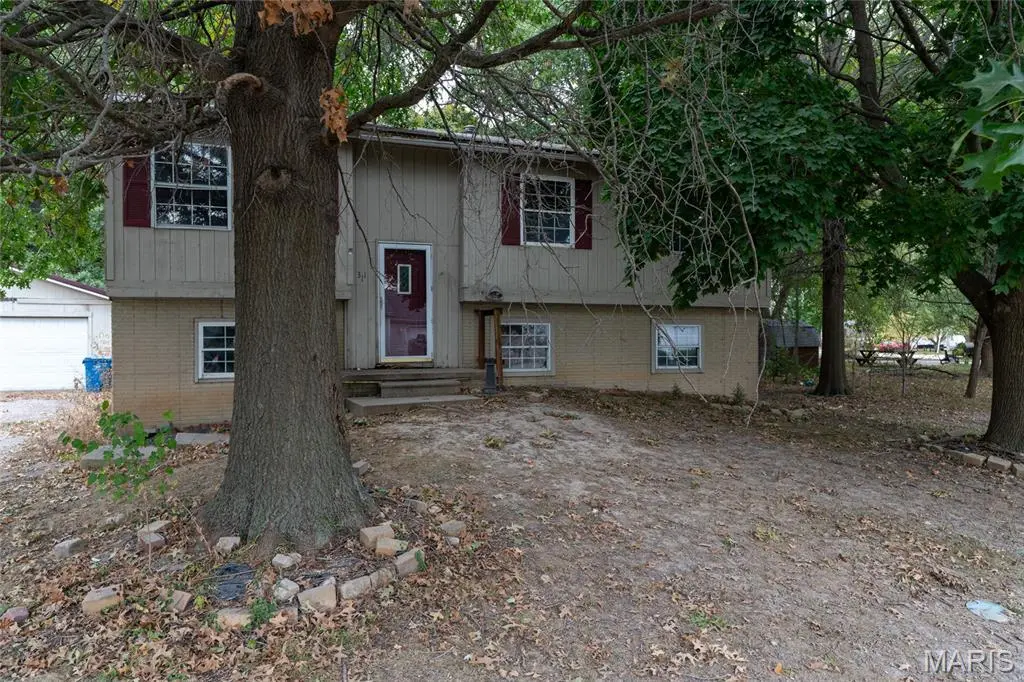
311 Colfax St · Mount Olive, IL
Flood risk 1/10 · Minimal
- FEMA flood zone
- —
- Chance of flooding over 30 yrs
- 0.0%
- Est. flood insurance / yr
- —
Fire risk 1/10 · Minimal
- Est. fire insurance / yr
- $804 – $1,492
Heat risk 4/10 · Minor
- Hot days now (above 105°F)
- 7 days/yr
- Hot days in 30 yrs
- 20 days/yr
Wind risk 2/10 · Minimal
- Chance of severe wind over 30 yrs
- 1.0%
Air-quality risk 2/10 · Minimal
- Unhealthy air days now
- 1 days/yr
- Unhealthy air days in 30 yrs
- 1 days/yr
Risk factors via First Street. Map © Google.
Why this score? — see what drove the B+ grade
The composite is a weighted blend of 9 inputs, each scored 0–100. Each bar is that input's sub-score; the figure is the points it added to the 100-point composite (weight × sub-score).
- Cash flow +30.0/30.0
- 1% rule +10.0/10.0
- DSCR +10.0/10.0
- Appreciation +10.0/10.0
- ARV discount +7.5/15.0
- Livability +3.1/5.0
- Rent growth +2.5/5.0
- Condition / age +2.5/5.0
- Schools +1.5/10.0
$50,000
🖨 Deal sheet (PDF) 📄 Offer letter ✓ Due diligence
Listing remarks MLS
Double Lot Spacious yard with Detached oversized garage in town, with plenty of Parking. Bi-Level. Perfect investment property 3 Bedrooms on the upper level with additional living in the lower level. 2 Full baths. Home will need some TLC.
Key facts
- Spacious yard
- Plenty of parking
- Double lot
Tags
Neighborhood map
What this means for you Summary
Snapshot
- This is a 4-bed/2.0-bath single-family listed at $50k.
Deal economics
- At list price, monthly cash flow is $560 ($7k/yr) — positive.
- The deal already cash-flows at list — no discount required.
- Meets the 1% rule at list price ($1k rent vs $50k).
- Recommended offer: $44k (12.0% below list) — sets the bar for market timing.
Location & tenants
- Location reads 61/100 on livability (#937 in IL) — a middle-class / working-renter tenant base. Strengths: cost of living A+, housing A+, crime A; Watch: employment D+, schools F, amenities F.
- Mount Olive CUSD 5 (rural): math 16% / reading 17% proficiency, ranked #483 of 620 in IL (top 78%) — low school quality limits family demand, transient renter base, plan for 1-2y turnover.
- Market conditions: 21 active listings in the ZIP; 70 units permitted in Macoupin County in 2024 (0 in 5+ unit buildings).
Forward outlook
- In year one you build about $5k of equity ($346 loan paydown + $5k appreciation (10.0% local appreciation)).
- Macoupin County population projected at -27% by 2050 — secular population decline; favor cash flow + early exit over multi-decade hold.
- At projected returns (10.0% appreciation + 3.0% rent growth), your $14k cash investment doubles in ~2 years — after that, you're playing with house money.
- By year 6, paydown + projected appreciation supports a ~$31k cash-out refi (75% LTV) — recoverable capital for the next deal without selling this one.
Negotiation context
- It's been on market 203 days — a 12% lower offer ($44k) is reasonable based on typical stale-listing flexibility.
- 3 sale attempts since 16y ago; this cycle's ask has dropped $10k (17%) from the opening price — seller is motivated, your offer sets the floor, not the list.
Risks & watch-outs
- Watch-outs: property tax is 3.7% of price.
Questions for the listing agent
- It's been on market 203 days. Have you received any prior offers? Is the seller open to a 12% concession, seller financing, or rate buy-down credit?
- Built in 1979 — when were the roof, HVAC, electrical panel, plumbing, and water heater last replaced?
- Property tax is high relative to price — has the assessment been appealed recently, and will the sale trigger a re-assessment?
- Why hasn't it sold? Are there any deal-killer items the seller is aware of (foundation, flood, title, zoning, code violations)?
- Is there a deadline driving the sale (1031 exchange, divorce, estate, relocation)? That informs how much negotiation room exists.
- Schools are F-rated, which usually means shorter tenancies and higher turnover. Who's the typical renter profile here, and what's been the actual vacancy rate?
- What's the average days-on-market for RENTAL listings here right now (not sales)? A rising rental-DOM trend means longer vacancies and softer asking-rent achievability than the comps imply.
- What's the recent tenant-quality profile in this submarket — average credit score on applications, eviction rate, late-payment / NSF rate, and stable-employment percentage? A property-management company in the area should have these aggregated.
- How much new for-sale + rental construction is in the pipeline within 1–3 miles? Heavy new supply typically softens prices + rents 12–24 months out; constrained supply supports both.
Investment metrics
- 1% rule
- 2.52% ✓
- Cap rate
- 19.74%
- Cash-on-cash
- 48.02%
- DSCR
- 3.14
- GRM
- 3.3
CMA / ARV
- ARV (median comp)
- $174,266
- List price
- $50,000
- Delta
- -71.31%
- Verdict
- UNDERPRICED
- Comps
- 20 within 1.0 mi
Show comp detail 10 sales within ~0.75 mi
| Address | Dist | Beds/Ba | Sqft | Sold | Price | $/sf | Match |
|---|---|---|---|---|---|---|---|
| 505 Colfax St | 0.14mi | 3/2.0 (-1) | 1,830 (+2%) | 12mo | $249,900 | $137 | 76 |
| 111 W 4th South St | 0.34mi | 3/2.0 (-1) | 1,843 (+2%) | 2mo | $125,000 | $68 | 73 |
| 306 E Putnam St | 0.20mi | 3/1.0 (-1) | 1,659 (-8%) | 1mo | $227,500 | $137 | 68 |
| 109 W 2nd St S | 0.42mi | 4/2.0 | 1,700 (-6%) | 11mo | $192,000 | $113 | 62 |
| 407 Benton St | 0.08mi | 4/2.0 | 1,600 (-11%) | 19mo | $258,600 | $162 | 62 |
| 211 S Lake St | 0.58mi | 3/1.0 (-1) | 1,870 (+4%) | 0mo | $145,000 | $78 | 57 |
| 302 W 6th St S | 0.40mi | 3/1.5 (-1) | 1,920 (+7%) | 15mo | $190,000 | $99 | 51 |
| 113 E Benton St | 0.17mi | 4/1.0 | 1,559 (-13%) | 23mo | $116,000 | $74 | 47 |
| 301 E 3rd North St | 0.66mi | 3/1.5 (-1) | 1,650 (-8%) | 6mo | $174,900 | $106 | 44 |
| 211 W 2nd S | 0.49mi | 3/2.0 (-1) | 1,568 (-13%) | 22mo | $114,900 | $73 | 33 |
Match score weights: distance 35% · size 25% · config 20% · recency 20%. Top-matched comps best support the ARV.
Projected returns pro-forma
10.0% appreciation · 3.0% rent growth · sell at horizon
- IRR
- 62.0%
- Equity multiple
- 5.50×
- Total profit
- $62,988
- Equity at exit
- $45,044
- IRR
- 55.5%
- Equity multiple
- 12.26×
- Total profit
- $157,577
- Equity at exit
- $97,139
Cash invested: $14,000 (down + closing). Projections, not guarantees.
Landlord ↔ Tenant lean methodology
- Overall (STATE)
- 43 Moderately Tenant-Leaning
- State Illinois
- 43 Moderately Tenant-Leaning · D+7
- County
- — inherits STATE
- City
- — inherits STATE
ZIP-level market 62069
- Home prices YoY
- 12.0%
- Active inventory
- 21
- Price-to-rent
- 3.3×
Monthly cashflow live
- Estimated rent
- $1,261 medium interval (Pro) →
- Mortgage (P&I)
- −$262
- Tax from tax record
- −$153 /mo · $1,833/yr
- Insurance
- −$21
- HOA
- −$0
- Vacancy / Maint / Mgmt
- −$265
- Net cashflow
- $560
Break-even live
Sensitivity live
| Price | -10% $589 | -5% $574 | +0% $560 | +5% $546 | +10% $532 |
|---|---|---|---|---|---|
| Rent | -10% $461 | -5% $510 | +0% $560 | +5% $610 | +10% $660 |
| Rate | -1.0pp $585 | -0.5pp $573 | base $560 | +0.5pp $547 | +1.0pp $534 |
UW: 25.0% down · 7.5% · 30yr · 1.5% tax · 5.0% vac · 8.0% maint · 8.0% mgmt
Financing live
Cash to close
- Down payment
- $12,500
- Closing costs
- $1,500
- Reserves months
- —
- Total cash needed
- —
Loan-product check · same deal, 3 products live
Conventional
25% down · 7.5% · 30yr
- Down + closing
- —
- Monthly P&I
- —
- Monthly cashflow
- —
- DSCR
- —
- Eligible?
- —
Personal DTI + credit; lowest rate.
DSCR
20% down · 8.5% · 30yr
- Down + closing
- —
- Monthly P&I
- —
- Monthly cashflow
- —
- DSCR
- —
- Eligible?
- —
No personal income docs; deal must DSCR.
Hard money
10% down · 12.0% · 12mo
- Down + closing
- —
- Monthly P&I
- —
- Monthly cashflow
- —
- DSCR
- —
- Eligible?
- —
Short-term bridge; refi at stabilization.
Listing history 20 events
-
2026-06-09statusdays on market $50,000 Pending 203 DOM
-
2026-06-08days on market $50,000 Active 202 DOM
-
2026-06-07days on market $50,000 Active 201 DOM
-
2026-06-04days on market $50,000 Active 197 DOM
-
2026-06-02days on market $50,000 Active 196 DOM
-
2026-06-01days on market $50,000 Active 195 DOM
-
2026-05-31days on market $50,000 Active 194 DOM
-
2026-05-31days on market $50,000 Active 193 DOM
-
2026-04-24status Active 239-char remark
Show marketing remark (239 chars)
Double Lot Spacious yard with Detached oversized garage in town, with plenty of Parking. Bi-Level. Perfect investment property 3 Bedrooms on the upper level with additional living in the lower level. 2 Full baths. Home will need some TLC.
-
2026-03-26status Pending 239-char remark
Show marketing remark (239 chars)
Double Lot Spacious yard with Detached oversized garage in town, with plenty of Parking. Bi-Level. Perfect investment property 3 Bedrooms on the upper level with additional living in the lower level. 2 Full baths. Home will need some TLC.
-
2026-03-25historical Active Under Contract 239-char remark
Show marketing remark (239 chars)
Double Lot Spacious yard with Detached oversized garage in town, with plenty of Parking. Bi-Level. Perfect investment property 3 Bedrooms on the upper level with additional living in the lower level. 2 Full baths. Home will need some TLC.
-
2026-01-12price $50,000 239-char remark
Show marketing remark (239 chars)
Double Lot Spacious yard with Detached oversized garage in town, with plenty of Parking. Bi-Level. Perfect investment property 3 Bedrooms on the upper level with additional living in the lower level. 2 Full baths. Home will need some TLC.
-
2025-10-21$60,000 Active 239-char remark
Show marketing remark (239 chars)
Double Lot Spacious yard with Detached oversized garage in town, with plenty of Parking. Bi-Level. Perfect investment property 3 Bedrooms on the upper level with additional living in the lower level. 2 Full baths. Home will need some TLC.
-
2025-10-21historical $60,000 239-char remark
Show marketing remark (239 chars)
Double Lot Spacious yard with Detached oversized garage in town, with plenty of Parking. Bi-Level. Perfect investment property 3 Bedrooms on the upper level with additional living in the lower level. 2 Full baths. Home will need some TLC.
-
2021-08-06historical
-
2011-12-01soldstatus $65,000
-
2011-06-16soldstatus $40,500
-
2011-06-01soldstatus $40,500
-
2010-12-23$47,500
-
2008-07-21soldstatus $97,747
ⓘ Source: listings_history table (triggers on properties + properties_extension) + one-shot
backfill from property_details.listing_events for pre-trigger history.
Tax reassessment forecast IL · Partial reset (capped growth)
- Current annual tax
- $1,833 · $153/mo
- Projected year-2 tax
- $1,833 · $153/mo
- Expected delta
- $0/yr ($0/mo · 0.0%)
ⓘ Screening estimate from a state-policy table — verify with the county assessor before closing.
Climate risk First Street
- Flood 1/10 Low 0% chance over 30 yrs
- Wildfire 1/10 Low
- Heat 4/10 Moderate 7 d/yr ≥105°F today · 20 d/yr by 30 yrs out
- Wind 2/10 Low 100% chance of damaging wind over 30 yrs
- Air quality 2/10 Low 1 unhealthy d/yr today · 1 by 30 yrs out
Nearby sold comps map
Loading sold comps map…
Walkable amenities ~0.75 mi
Loading nearby amenities…
Taxation est. · year 1
- Rental income
- $15,129
- − Mortgage interest
- −$2,801
- − Property taxes
- −$1,833
- − Insurance
- −$250
- − Repairs & maintenance
- −$1,210
- − Management
- −$1,210
- − Depreciation
- −$1,455
- Taxable income
- $6,370
- Est. tax owed @ 24.0%
- −$1,529
- After-tax cash flow
- $5,194/yr
For passive investors: Depreciation is non-cash, so a rental often shows a tax loss while cash-flowing — sheltering income. Rental losses are passive: they offset passive income freely, and up to $25,000/yr can offset ordinary (W-2) income if you actively participate and your MAGI is under $100k (phasing out to $0 by $150k); unused losses carry forward. On sale, claimed depreciation is recaptured at up to 25%, and gains may owe capital-gains tax (a 1031 exchange can defer both). Figures are a year-1 estimate at your 24.0% rate — not tax advice; consult a CPA.
Schools (NCES district)
- District
- Mount Olive CUSD 5
- NCES district ID
- 1727180
- Math proficiency
- 16% ▼ -21.00%
- Reading proficiency
- 17% ▼ -18.00%
- Median HH income
- $46,749
- Composite
- 14.7/100
- National rank
- #9402
- State rank
- #483 of 620 in IL
Livability — Mount Olive
- Score
- 61/100
- State rank
- #937
- US rank
- #18221
Category grades
Schools grade is shown separately in the Schools card above.
Census & demographics
- Census place
- Mount Olive, IL
- Population (ZIP)
- 3,102
Population outlook (Macoupin County) Hauer SSP2
- Today (2025)
- 42,867 people
- By 2030
- 40,796 · -4.8%
- By 2040
- 36,135 · -15.7%
- By 2050
- 31,469 · -26.6%
- By 2075
- 22,102 · -48.4%
- By 2100
- 15,380 · -64.1%
Race, ethnicity, and origin ACS 2023
- Neighborhood character
- Predominantly White (96%)
- Race & ethnicity
- White 96% Two or more races 3%
- Common ancestry
- Lithuanian 2% Iranian 2% Romanian 2%
- Foreign-born
- 1%
Political lean MEDSL · Macoupin
- 2024 margin
- Solid R (+39.2) · D 29.4% · R 68.7% · Other 1.9%
- 2008→2024 swing
- -49.0pp toward R · 2008: 9.8pp · 2024: -39.2pp
- All cycles
- 2024: R+39.2 2020: R+36.5 2016: R+35.0 2012: R+7.0 2008: D+9.8
Not yet ingested
- Civics
- —
Market trends
- HPI YoY
- ▲ 21.34%
- Current HPI
- 199.5
- Rent YoY
- —
- Metro
- —
- State GDP YoY
- ▲ 1.59%
- F500 in state
- 60
Industry mix (Fortune 500 HQ in IL)
| Industry | F500 HQs | Revenue |
|---|---|---|
| Insurance | 4 | $201B |
|
||
| Consumer Goods | 4 | $87B |
|
||
| Industrial Machinery | 3 | $64B |
|
||
| Healthcare | 2 | $55B |
|
||
| Retail / Pharmacy | 1 | $148B |
|
||
| Agriculture / Food | 1 | $86B |
|
||
Price history
-48.8% since first listed12 events — show timeline
- 2026-04-24 Relisted — MARIS as Distributed by MLS Grid
- 2026-03-26 Pending — MARIS as Distributed by MLS Grid
- 2026-03-25 Contingent — MARIS as Distributed by MLS Grid
- 2026-01-12 Price Changed $50,000 MARIS as Distributed by MLS Grid
- 2025-10-21 Listed $60,000 MARIS as Distributed by MLS Grid
- 2025-10-21 Coming Soon $60,000 MARIS as Distributed by MLS Grid
- 2021-08-06 Listing Removed — RMLSA as Distributed by MLS Grid
- 2011-12-01 Sold (Public Records) $65,000 Public Records
- 2011-06-16 Sold (MLS) $40,500 RMLSA as Distributed by MLS Grid
- 2011-06-01 Sold (Public Records) $40,500 Public Records
- 2010-12-23 Listed $47,500 RMLSA as Distributed by MLS Grid
- 2008-07-21 Sold (Public Records) $97,747 Public Records
Property tax history
+1.8%/yrLatest (2024): $1,833 · +4.9% YoY. Source: county tax records.
Cash-flow waterfall
monthlySold comps — $/sqft
last 12 mo · ≤1 miLoading sold comps…