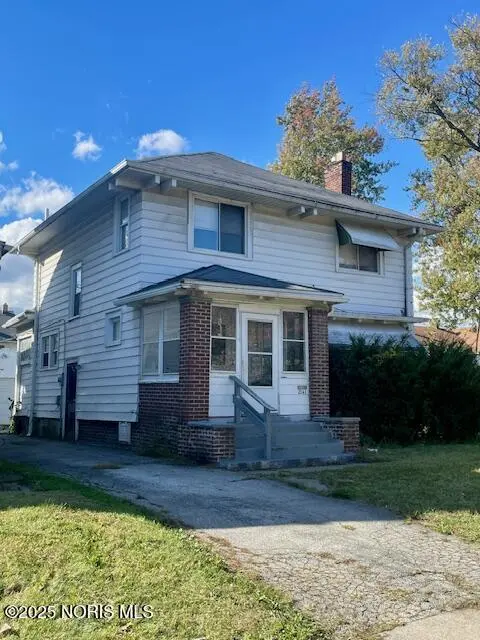
2141 Joffre Ave · Toledo, OH
Flood risk 1/10 · Minimal
- FEMA flood zone
- X (unshaded)
- Chance of flooding over 30 yrs
- 0.0%
- Est. flood insurance / yr
- $473 – $860
Fire risk 1/10 · Minimal
- Est. fire insurance / yr
- $713 – $1,323
Heat risk 3/10 · Minor
- Hot days now (above 101°F)
- 7 days/yr
- Hot days in 30 yrs
- 16 days/yr
Wind risk 2/10 · Minimal
- Chance of severe wind over 30 yrs
- —
Air-quality risk 2/10 · Minimal
- Unhealthy air days now
- 1 days/yr
- Unhealthy air days in 30 yrs
- 3 days/yr
Risk factors via First Street. Map © Google.
Why this score? — see what drove the B grade
The composite is a weighted blend of 9 inputs, each scored 0–100. Each bar is that input's sub-score; the figure is the points it added to the 100-point composite (weight × sub-score).
- Cash flow +30.0/30.0
- ARV discount +10.7/15.0
- DSCR +10.0/10.0
- 1% rule +9.4/10.0
- Rent growth +4.5/5.0
- Livability +3.3/5.0
- Condition / age +2.5/5.0
- Schools +1.6/10.0
- Appreciation +0.0/10.0
$84,900
🖨 Deal sheet 📄 Offer letter ✓ Due diligence
Listing remarks MLS
Step inside this large, wonderful updated traditional. Updates include: updated bath, new flat roof 2021, 2 car garage 2022, and vinyl plank floors in 2022. Great floor plan with an extra bedroom or den on main level. Gas fireplace adds comfort and ambience . Nice covered porch Property has a happy tenant. rents at 1225.00 per month. Tenant lease ends on 5/30/26. No tours until accepted offer.
Key facts
- Covered porch
- New flat roof
- Updated bath
Tags
Neighborhood map
What this means for you Summary
Snapshot
- This is a 3-bed/1.0-bath single-family listed at $85k.
Deal economics
- At list price, monthly cash flow is $408 ($5k/yr) — positive.
- The deal already cash-flows at list — no discount required.
- Meets the 1% rule at list price ($1k rent vs $85k).
- Recommended offer: $75k (12.0% below list) — sets the bar for market timing.
- Cap rate 12.1% vs local median 7.6% in Toledo — top-decile yield for the area; either an underpriced asset or a hidden risk that comps aren't pricing in. Stress-test before assuming the spread holds.
Location & tenants
- Location reads 66/100 on livability (#645 in OH) — a middle-class / working-renter tenant base. Strengths: cost of living A+, housing A+, health & safety A+; Watch: amenities C-, schools D-, crime F.
- Toledo City (urban): math 15% / reading 24% proficiency, ranked #634 of 656 in OH (top 97%) — low school quality limits family demand, transient renter base, plan for 1-2y turnover; 72% free/reduced lunch — lower-income household profile, screen leases tightly.
- Market conditions: Rents rising fast (+8.2%/yr); 83 active listings in the ZIP; 16 comparable units currently listed for rent nearby; rentals lingering (median 44d on market — plan ~5-8 weeks vacancy on turnover, expect pricing pressure); 56% of comp listings sitting > 30 days — soft ceiling on asking rent; lower-income renter base — watch delinquency; 415 units permitted in Lucas County in 2024 (122 in 5+ unit buildings).
- This rent runs 35% of the median local income ($41k/yr) — at the standard rent-burdened threshold; future hikes will face affordability resistance.
Forward outlook
- Local home prices are declining (-3.0%/yr); year-one equity from $587 of loan paydown is wiped out by about $3k of value loss. Plan a longer hold.
- Lucas County population projected at -16% by 2050 — secular population decline; favor cash flow + early exit over multi-decade hold.
- At projected returns (-3.0% appreciation + 8.0% rent growth), your $24k cash investment doubles in ~5 years — after that, you're playing with house money.
Negotiation context
- It's been on market 215 days — a 12% lower offer ($75k) is reasonable based on typical stale-listing flexibility.
- 8 sale attempts since 20y ago with the ask held roughly flat each time — persistent listings suggest the price (not the market) is what's stuck; bring a comps-based counter.
Risks & watch-outs
- Watch-outs: built in 1920 — expect roof / HVAC / electrical / plumbing capex.
Questions for the listing agent
- It's been on market 215 days. Have you received any prior offers? Is the seller open to a 12% concession, seller financing, or rate buy-down credit?
- Built in 1920 — when were the roof, HVAC, electrical panel, plumbing, and water heater last replaced?
- Why hasn't it sold? Are there any deal-killer items the seller is aware of (foundation, flood, title, zoning, code violations)?
- Is there a deadline driving the sale (1031 exchange, divorce, estate, relocation)? That informs how much negotiation room exists.
- Schools are D-rated, which usually means shorter tenancies and higher turnover. Who's the typical renter profile here, and what's been the actual vacancy rate?
- Crime grade is F in this area — have there been break-ins, vandalism, or insurance claims at this property in the last 3 years? What carrier currently insures it and at what premium?
- What's the average days-on-market for RENTAL listings here right now (not sales)? A rising rental-DOM trend means longer vacancies and softer asking-rent achievability than the comps imply.
- What's the recent tenant-quality profile in this submarket — average credit score on applications, eviction rate, late-payment / NSF rate, and stable-employment percentage? A property-management company in the area should have these aggregated.
- How much new for-sale + rental construction is in the pipeline within 1–3 miles? Heavy new supply typically softens prices + rents 12–24 months out; constrained supply supports both.
Investment metrics
- 1% rule
- 1.44% ✓
- Cap rate
- 12.06%
- Cash-on-cash
- 20.58%
- DSCR
- 1.92
- GRM
- 5.8
CMA / ARV
- ARV (median comp)
- $91,378
- List price
- $84,900
- Delta
- -7.09%
- Verdict
- FAIR
- Comps
- 20 within 1.0 mi
Show comp detail 12 sales within ~0.75 mi
| Address | Dist | Beds/Ba | Sqft | Sold | Price | $/sf | Match |
|---|---|---|---|---|---|---|---|
| 2114 Parkdale Ave | 0.05mi | 3/1.0 | 1,737 (+0%) | 2mo | $125,000 | $72 | 95 |
| 2053 Calumet Ave | 0.10mi | 3/1.0 | 1,840 (+6%) | 5mo | $55,000 | $30 | 81 |
| 1844 Freeman St | 0.14mi | 3/1.5 | 1,630 (-6%) | 1mo | $40,000 | $25 | 81 |
| 1808 Freeman St | 0.12mi | 3/1.5 | 1,561 (-10%) | 7mo | $91,488 | $59 | 70 |
| 2144 Hawthorne St | 0.33mi | 3/1.0 | 1,564 (-10%) | 3mo | $40,000 | $26 | 66 |
| 1424 Addington Rd | 0.64mi | 3/1.5 | 1,726 (-1%) | 3mo | $153,198 | $89 | 65 |
| 1948 Sussex Pl | 0.52mi | 4/1.0 (+1) | 1,746 (+1%) | 9mo | $162,000 | $93 | 62 |
| 2004 Calumet Ave | 0.20mi | 4/1.5 (+1) | 1,557 (-10%) | 7mo | $50,000 | $32 | 60 |
| 1513 Waverly Ave | 0.57mi | 3/1.5 | 1,578 (-9%) | 7mo | $123,400 | $78 | 51 |
| 1938 Fernwood Ave | 0.57mi | 3/1.0 | 1,502 (-14%) | 3mo | $95,900 | $64 | 49 |
| 1311 Fitchland Ave | 0.68mi | 4/2.0 (+1) | 1,480 (-15%) | 9mo | $127,500 | $86 | 27 |
| 1449 Norwood Ave | 0.68mi | 4/2.0 (+1) | 1,484 (-14%) | 11mo | $135,000 | $91 | 26 |
Match score weights: distance 35% · size 25% · config 20% · recency 20%. Top-matched comps best support the ARV.
Projected returns pro-forma
-3.0% appreciation · 8.0% rent growth · sell at horizon
- IRR
- 18.3%
- Equity multiple
- 1.79×
- Total profit
- $18,665
- Equity at exit
- $12,659
- IRR
- 29.9%
- Equity multiple
- 4.33×
- Total profit
- $79,063
- Equity at exit
- $7,341
Cash invested: $23,772 (down + closing). Projections, not guarantees.
Landlord ↔ Tenant lean methodology
- Overall (STATE)
- 73 Landlord-Friendly
- State Ohio
- 73 Landlord-Friendly · R+6
- County
- — inherits STATE
- City
- — inherits STATE
ZIP-level market 43607
- Home prices YoY
- -27.5%
- Rents YoY
- 8.2%
- Active inventory
- 83
- Price-to-rent
- 5.8×
Monthly cashflow live
- Estimated rent
- $1,221 high interval (Pro) →
- Mortgage (P&I)
- −$445
- Tax from tax record
- −$76 /mo · $915/yr
- Insurance
- −$35
- HOA
- −$0
- Vacancy / Maint / Mgmt
- −$256
- Net cashflow
- $408
Break-even live
UW: 25.0% down · 7.5% · 30yr · 1.5% tax · 5.0% vac · 8.0% maint · 8.0% mgmt
Financing live
Cash to close
- Down payment
- $21,225
- Closing costs
- $2,547
- Reserves months
- —
- Total cash needed
- —
Loan-product check · same deal, 3 products live
Conventional
25% down · 7.5% · 30yr
- Down + closing
- —
- Monthly P&I
- —
- Monthly cashflow
- —
- DSCR
- —
- Eligible?
- —
Personal DTI + credit; lowest rate.
DSCR
20% down · 8.5% · 30yr
- Down + closing
- —
- Monthly P&I
- —
- Monthly cashflow
- —
- DSCR
- —
- Eligible?
- —
No personal income docs; deal must DSCR.
Hard money
10% down · 12.0% · 12mo
- Down + closing
- —
- Monthly P&I
- —
- Monthly cashflow
- —
- DSCR
- —
- Eligible?
- —
Short-term bridge; refi at stabilization.
Rent comps 16 comps
| Address | Beds | Baths | Sqft | Rent | $/sqft | DOM | Units | Dist |
|---|---|---|---|---|---|---|---|---|
| 2117 Clinton St Toledo, OH | 3.0 | 1.0 | 1256 | $1,115 | $0.89 | 43d | 1 | 0.15mi |
| 2356 Torrey Hill Dr Unit 11 Toledo, OH | 2.0 | 1.0 | 1050 | $800 | $0.76 | 43d | 1 | 0.41mi |
| 1436 Palmetto Ave Toledo, OH | 3.0 | 1.0 | 1678 | $1,400 | $0.83 | 23d | 1 | 0.80mi |
| 2037 Alvin St Toledo, OH | 3.0 | 1.0 | 1260 | $1,175 | $0.93 | 43d | 1 | 0.83mi |
| 2632 Algonquin Pkwy Toledo, OH | 3.0 | 1.5 | 1568 | $800 | $0.51 | 23d | 1 | 0.89mi |
| 915 Woodstock Ave Toledo, OH | 3.0 | 1.5 | 1500 | $1,100 | $0.73 | 23d | 1 | 0.97mi |
| 2637 Greenway St Toledo, OH | 2.0 | 1.0 | 1082 | $900 | $0.83 | 43d | 1 | 0.98mi |
| 1573 Jermain Dr Toledo, OH | 3.0 | 1.0 | 1254 | $1,195 | $0.95 | 13d | 1 | 0.99mi |
| 1140 Palmwood Ave Toledo, OH | 3.0 | 1.0 | 1292 | $1,500 | $1.16 | 43d | 1 | 1.03mi |
| 2734 Powhattan Pkwy Toledo, OH | 2.0 | 1.0 | 1144 | $900 | $0.79 | 43d | 1 | 1.06mi |
| 1026 Oakwood Ave Toledo, OH | 2.0 | 1.0 | 1100 | $850 | $0.77 | 43d | 1 | 1.11mi |
| 1718 Giant St Toledo, OH | 3.0 | 1.0 | 1080 | $1,395 | $1.29 | 13d | 1 | 1.16mi |
| 960 W Delaware Ave Toledo, OH | 3.0 | 1.0 | 1224 | $1,050 | $0.86 | 23d | 1 | 1.17mi |
| 1122 Pinewood Ave Toledo, OH | 3.0 | 1.0 | 1559 | $1,150 | $0.74 | 13d | 1 | 1.17mi |
| 2447 Maplewood Ave Toledo, OH | 2.0 | 1.0 | 1538 | $897 | $0.58 | 43d | 1 | 1.28mi |
| 319 N Detroit Ave Toledo, OH | 3.0 | 1.0 | 1341 | $845 | $0.63 | 43d | 1 | 1.35mi |
Listing history 38 events
-
2026-06-18days on market $84,900 Active 215 DOM
-
2026-06-17days on market $84,900 Active 214 DOM
-
2026-06-16days on market $84,900 Active 213 DOM
-
2026-06-15days on market $84,900 Active 212 DOM
-
2026-06-14days on market $84,900 Active 210 DOM
-
2026-06-10days on market $84,900 Active 207 DOM
-
2026-06-09days on market $84,900 Active 206 DOM
-
2026-06-08days on market $84,900 Active 205 DOM
-
2026-06-07days on market $84,900 Active 204 DOM
-
2026-06-05days on market $84,900 Active 201 DOM
-
2026-06-03days on market $84,900 Active 200 DOM
-
2026-06-02days on market $84,900 Active 199 DOM
-
2026-06-01days on market $84,900 Active 198 DOM
-
2026-05-31days on market $84,900 Active 197 DOM
-
2026-05-30days on market $84,900 Active 196 DOM
-
2026-05-06status Active 398-char remark
Show marketing remark (398 chars)
Step inside this large, wonderful updated traditional. Updates include: updated bath, new flat roof 2021, 2 car garage 2022, and vinyl plank floors in 2022. Great floor plan with an extra bedroom or den on main level. Gas fireplace adds comfort and ambience . Nice covered porch Property has a happy tenant. rents at 1225.00 per month. Tenant lease ends on 5/30/26. No tours until accepted offer.
-
2026-05-05historical 398-char remark
Show marketing remark (398 chars)
Step inside this large, wonderful updated traditional. Updates include: updated bath, new flat roof 2021, 2 car garage 2022, and vinyl plank floors in 2022. Great floor plan with an extra bedroom or den on main level. Gas fireplace adds comfort and ambience . Nice covered porch Property has a happy tenant. rents at 1225.00 per month. Tenant lease ends on 5/30/26. No tours until accepted offer.
-
2025-11-05$84,900 Active 398-char remark
Show marketing remark (398 chars)
Step inside this large, wonderful updated traditional. Updates include: updated bath, new flat roof 2021, 2 car garage 2022, and vinyl plank floors in 2022. Great floor plan with an extra bedroom or den on main level. Gas fireplace adds comfort and ambience . Nice covered porch Property has a happy tenant. rents at 1225.00 per month. Tenant lease ends on 5/30/26. No tours until accepted offer.
-
2025-10-14price $77,000 208-char remark
Show marketing remark (208 chars)
Get Inside this 2 story home offering spacious rooms. Main floor den and laundry. Updates include kithcen windows, furnace, central air. Don't wait. See it today!!! Subject to Sellers finding suitablehousing.
-
2025-10-14price $10,500
Show marketing remark (208 chars)
Get Inside this 2 story home offering spacious rooms. Main floor den and laundry. Updates include kithcen windows, furnace, central air. Don't wait. See it today!!! Subject to Sellers finding suitablehousing.
-
2022-06-15soldstatus $100,000
-
2022-06-09status Pending
-
2022-06-09soldstatus $67,500 Closed
-
2022-05-26historical Contingent
-
2022-05-25status Active
-
2022-05-12historical Contingent
-
2022-05-09$67,500 Active
-
2022-03-14historical
-
2021-08-12$64,900 Active
-
2021-08-09historical
-
2015-12-11soldstatus $10,500
-
2015-11-21price $17,000
-
2015-10-05$17,000
-
2015-02-28historical
-
2014-10-06$78,000
-
2006-08-30soldstatus $77,000
-
2006-08-29soldstatus $77,000 208-char remark
Show marketing remark (208 chars)
Get Inside this 2 story home offering spacious rooms. Main floor den and laundry. Updates include kithcen windows, furnace, central air. Don't wait. See it today!!! Subject to Sellers finding suitablehousing.
-
2006-03-09$79,900 208-char remark
Show marketing remark (208 chars)
Get Inside this 2 story home offering spacious rooms. Main floor den and laundry. Updates include kithcen windows, furnace, central air. Don't wait. See it today!!! Subject to Sellers finding suitablehousing.
ⓘ Source: listings_history table (triggers on properties + properties_extension) + one-shot
backfill from property_details.listing_events for pre-trigger history.
Tax reassessment forecast OH · Partial reset (capped growth)
- Current annual tax
- $915 · $76/mo
- Projected year-2 tax
- $1,120 · $93/mo
- Expected delta
- +$205/yr (+$17/mo · 22.3%)
ⓘ Screening estimate from a state-policy table — verify with the county assessor before closing.
Climate risk First Street
- Flood 1/10 Low FEMA zone X (unshaded) · 0% chance over 30 yrs
- Wildfire 1/10 Low
- Heat 3/10 Moderate 7 d/yr ≥101°F today · 16 d/yr by 30 yrs out
- Wind 2/10 Low
- Air quality 2/10 Low 1 unhealthy d/yr today · 3 by 30 yrs out
Nearby sold comps map
Loading sold comps map…
Walkable amenities ~0.75 mi
Loading nearby amenities…
Taxation est. · year 1
- Rental income
- $14,652
- − Mortgage interest
- −$4,756
- − Property taxes
- −$915
- − Insurance
- −$424
- − Repairs & maintenance
- −$1,172
- − Management
- −$1,172
- − Depreciation
- −$2,470
- Taxable income
- $3,743
- Est. tax owed @ 24.0%
- −$898
- After-tax cash flow
- $3,995/yr
For passive investors: Depreciation is non-cash, so a rental often shows a tax loss while cash-flowing — sheltering income. Rental losses are passive: they offset passive income freely, and up to $25,000/yr can offset ordinary (W-2) income if you actively participate and your MAGI is under $100k (phasing out to $0 by $150k); unused losses carry forward. On sale, claimed depreciation is recaptured at up to 25%, and gains may owe capital-gains tax (a 1031 exchange can defer both). Figures are a year-1 estimate at your 24.0% rate — not tax advice; consult a CPA.
Schools (NCES district)
- District
- Toledo City
- NCES district ID
- 3904490
- Math proficiency
- 15% ▼ -16.00%
- Reading proficiency
- 24% ▼ -13.00%
- Median HH income
- $32,137
- Composite
- 15.76/100
- National rank
- #9276
- State rank
- #634 of 656 in OH
Livability — Toledo
- Score
- 66/100
- State rank
- #645
- US rank
- #11442
Category grades
Schools grade is shown separately in the Schools card above.
Census & demographics
- Census place
- Toledo, OH
- County
- Lucas County · 380,724 people
- City population
- 280,811
- Metro
- Toledo, OH
- Population (ZIP)
- 19,469
- Household income
- $41,335
- Rent vs Own
- Severe rent burden
- 1157.0
Population outlook (Lucas County) Hauer SSP2
- Today (2025)
- 420,751 people
- By 2030
- 410,187 · -2.5%
- By 2040
- 384,019 · -8.7%
- By 2050
- 355,125 · -15.6%
- By 2075
- 291,683 · -30.7%
- By 2100
- 233,670 · -44.5%
Race, ethnicity, and origin ACS 2023
- Neighborhood character
- Diverse neighborhood (Simpson 0.57)
- Race & ethnicity
- Black 59% White 27% Two or more races 6% Hispanic / Latino 6% Asian 3%
- Hispanic origin (detail)
- Mexican 3% Puerto Rican 2%
- Common ancestry
- Lithuanian 2% Romanian 2% Slovak 1%
- Foreign-born
- 4% · Canada
- Languages at home
- 94% English-only · Other Indo-European 1% Spanish 1% Russian/Polish/Slavic 1%
Political lean MEDSL · Lucas
- 2024 margin
- D (+12.6) · D 55.8% · R 43.2%
- 2008→2024 swing
- -18.9pp toward R · 2008: 31.4pp · 2024: 12.6pp
- All cycles
- 2024: D+12.6 2020: D+16.8 2016: D+17.4 2012: D+30.4 2008: D+31.4
Not yet ingested
- Civics
- —
Market trends
- HPI YoY
- ▼ -66.58%
- Current HPI
- 175.2772
- Rent YoY
- ▲ 8.19%
- Metro
- Toledo, OH
- State GDP YoY
- ▲ 1.98%
- F500 in state
- 48
Industry mix (Fortune 500 HQ in OH)
| Industry | F500 HQs | Revenue |
|---|---|---|
| Insurance | 3 | $145B |
|
||
| Industrial Machinery | 3 | $49B |
|
||
| Financial Services | 3 | $24B |
|
||
| Consumer Goods | 2 | $93B |
|
||
| Aerospace / Defense | 2 | $47B |
|
||
| Utilities | 2 | $33B |
|
||
Price history
+6.3% since first listed23 events — show timeline
- 2026-05-06 Relisted — NORIS
- 2026-05-05 Listing Removed — NORIS
- 2025-11-05 Listed $84,900 NORIS
- 2025-10-14 Price Changed $77,000 NORIS
- 2025-10-14 Price Changed $10,500 NORIS
- 2022-06-15 Sold (Public Records) $100,000 Public Records
- 2022-06-09 Pending — NORIS
- 2022-06-09 Sold (MLS) $67,500 NORIS
- 2022-05-26 Contingent — NORIS
- 2022-05-25 Relisted — NORIS
- 2022-05-12 Contingent — NORIS
- 2022-05-09 Listed $67,500 NORIS
- 2022-03-14 Listing Removed — NORIS
- 2021-08-12 Listed $64,900 NORIS
- 2021-08-09 Coming Soon — NORIS
- 2015-12-11 Sold (MLS) $10,500 NORIS
- 2015-11-21 Price Changed $17,000 NORIS
- 2015-10-05 Listed $17,000 NORIS
- 2015-02-28 Listing Removed — NORIS
- 2014-10-06 Listed $78,000 NORIS
- 2006-08-30 Sold (Public Records) $77,000 Public Records
- 2006-08-29 Sold (MLS) $77,000 NORIS
- 2006-03-09 Listed $79,900 NORIS
Property tax history
+1.0%/yrLatest (2025): $915 · +13.0% YoY. Source: county tax records.
Cash-flow waterfall
monthlySold comps — $/sqft
last 12 mo · ≤1 miLoading sold comps…