1855 Fox Run Dr #1 · Lake Charles, LA
Flood risk No data
- FEMA flood zone
- —
- Chance of flooding over 30 yrs
- —
- Est. flood insurance / yr
- —
Fire risk No data
- Est. fire insurance / yr
- —
Heat risk No data
- Hot days now (above threshold)
- —
- Hot days in 30 yrs
- —
Wind risk No data
- Chance of severe wind over 30 yrs
- —
Air-quality risk No data
- Unhealthy air days now
- —
- Unhealthy air days in 30 yrs
- —
Risk factors via First Street. Map © Google.
Why this score? — see what drove the B+ grade
The composite is a weighted blend of 9 inputs, each scored 0–100. Each bar is that input's sub-score; the figure is the points it added to the 100-point composite (weight × sub-score).
- Cash flow +29.9/30.0
- ARV discount +15.0/15.0
- DSCR +10.0/10.0
- 1% rule +7.2/10.0
- Rent growth +5.0/5.0
- Livability +3.4/5.0
- Schools +3.1/10.0
- Condition / age +2.5/5.0
- Appreciation +0.0/10.0
$119,000
🖨 Deal sheet 📄 Offer letter ✓ Due diligence
Listing remarks MLS
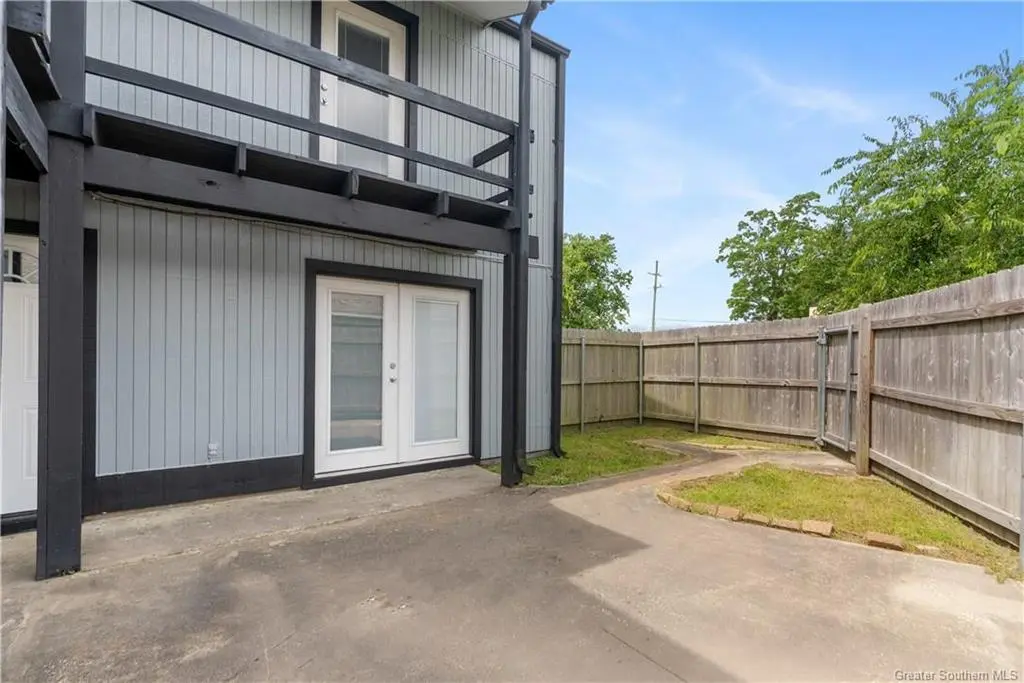
Discover this beautifully updated condo offering a perfect balance of style, comfort, and convenience.
Key facts
- Parking
- Built 1978
- Listed 308 days
Neighborhood map
What this means for you Summary
Snapshot
- This is a 2-bed/1.5-bath townhouse listed at $119k.
Deal economics
- At list price, monthly cash flow is $439 ($5k/yr) — positive.
- The deal already cash-flows at list — no discount required.
- Meets the 1% rule at list price ($1k rent vs $119k).
- Recommended offer: $105k (12.0% below list) — sets the bar for market timing.
- Cap rate 10.7% vs local median 4.3% in Lake Charles — top-decile yield for the area; either an underpriced asset or a hidden risk that comps aren't pricing in. Stress-test before assuming the spread holds.
Location & tenants
- Location reads 68/100 on livability (#95 in LA) — a middle-class / working-renter tenant base. Strengths: commute A+, cost of living A+, housing A+; Watch: crime F, amenities F, employment D-.
- Calcasieu Parish (other): math 30% / reading 44% proficiency, ranked #29 of 98 in LA (top 30%) — families likely to look elsewhere, expect single-tenant / working-renter base with shorter leases.
- Market conditions: Rents rising fast (+15.1%/yr); 456 active listings in the ZIP; 6 comparable units currently listed for rent nearby; rentals lingering (median 44d on market — plan ~5-8 weeks vacancy on turnover, expect pricing pressure); 50% of comp listings sitting > 30 days — soft ceiling on asking rent; solid renter incomes; 1,298 units permitted in Calcasieu Parish in 2024 (526 in 5+ unit buildings).
Forward outlook
- Local home prices are declining (-3.0%/yr); year-one equity from $823 of loan paydown is wiped out by about $4k of value loss. Plan a longer hold.
- Calcasieu County population projected at +11% by 2050 — modest demand growth; plan on rents tracking national, not racing it.
- At projected returns (-3.0% appreciation + 8.0% rent growth), your $33k cash investment doubles in ~6 years — after that, you're playing with house money.
Negotiation context
- It's been on market 309 days — a 12% lower offer ($105k) is reasonable based on typical stale-listing flexibility.
- 2 sale attempts since 10y ago; this cycle's ask has dropped $11k (8%) from the opening price — seller is motivated, your offer sets the floor, not the list.
Questions for the listing agent
- It's been on market 309 days. Have you received any prior offers? Is the seller open to a 12% concession, seller financing, or rate buy-down credit?
- Built in 1978 — when were the roof, HVAC, electrical panel, plumbing, and water heater last replaced?
- Why hasn't it sold? Are there any deal-killer items the seller is aware of (foundation, flood, title, zoning, code violations)?
- Is there a deadline driving the sale (1031 exchange, divorce, estate, relocation)? That informs how much negotiation room exists.
- Schools are B-rated — typically a magnet for longer-tenancy family renters. What's the average tenant stay here, and is there a school-zone premium baked into asking?
- Crime grade is F in this area — have there been break-ins, vandalism, or insurance claims at this property in the last 3 years? What carrier currently insures it and at what premium?
- What's the average days-on-market for RENTAL listings here right now (not sales)? A rising rental-DOM trend means longer vacancies and softer asking-rent achievability than the comps imply.
- What's the recent tenant-quality profile in this submarket — average credit score on applications, eviction rate, late-payment / NSF rate, and stable-employment percentage? A property-management company in the area should have these aggregated.
- How much new for-sale + rental construction is in the pipeline within 1–3 miles? Heavy new supply typically softens prices + rents 12–24 months out; constrained supply supports both.
Investment metrics
- 1% rule
- 1.22% ✓
- Cap rate
- 10.72%
- Cash-on-cash
- 15.81%
- DSCR
- 1.70
- GRM
- 6.8
CMA / ARV
- ARV (median comp)
- $153,224
- List price
- $119,000
- Delta
- -22.34%
- Verdict
- UNDERPRICED
- Comps
- 17 within 1.0 mi
Show comp detail 4 sales within ~0.75 mi
| Address | Dist | Beds/Ba | Sqft | Sold | Price | $/sf | Match |
|---|---|---|---|---|---|---|---|
| 1709 Fox Run Dr | 0.20mi | 2/1.5 | 1,015 (-0%) | 6mo | $85,000 | $84 | 85 |
| 1731 Fox Run Dr | 0.17mi | 2/2.0 | 1,007 (-1%) | 16mo | $120,000 | $119 | 75 |
| 1823 Tallowood Dr | 0.13mi | 2/1.5 | 932 (-8%) | 13mo | $135,000 | $145 | 69 |
| 4526 Summerdale St | 0.72mi | 2/1.0 | 975 (-4%) | 9mo | $160,000 | $164 | 50 |
Match score weights: distance 35% · size 25% · config 20% · recency 20%. Top-matched comps best support the ARV.
Projected returns pro-forma
-3.0% appreciation · 8.0% rent growth · sell at horizon
- IRR
- 11.7%
- Equity multiple
- 1.49×
- Total profit
- $16,296
- Equity at exit
- $17,743
- IRR
- 24.1%
- Equity multiple
- 3.55×
- Total profit
- $84,920
- Equity at exit
- $10,289
Cash invested: $33,320 (down + closing). Projections, not guarantees.
Landlord ↔ Tenant lean methodology
- Overall (STATE)
- 90 Strongly Landlord-Friendly
- State Louisiana
- 90 Strongly Landlord-Friendly · R+12
- County
- — inherits STATE
- City
- — inherits STATE
ZIP-level market 70605
- Rents YoY
- 15.1%
- Active inventory
- 456
- Price-to-rent
- 6.8×
Monthly cashflow live
- Estimated rent
- $1,452 high interval (Pro) →
- Mortgage (P&I)
- −$624
- Tax from tax record
- −$35 /mo · $418/yr
- Insurance
- −$50
- HOA
- −$0
- Vacancy / Maint / Mgmt
- −$305
- Net cashflow
- $439
Break-even live
UW: 25.0% down · 7.5% · 30yr · 1.5% tax · 5.0% vac · 8.0% maint · 8.0% mgmt
Financing live
Cash to close
- Down payment
- $29,750
- Closing costs
- $3,570
- Reserves months
- —
- Total cash needed
- —
Loan-product check · same deal, 3 products live
Conventional
25% down · 7.5% · 30yr
- Down + closing
- —
- Monthly P&I
- —
- Monthly cashflow
- —
- DSCR
- —
- Eligible?
- —
Personal DTI + credit; lowest rate.
DSCR
20% down · 8.5% · 30yr
- Down + closing
- —
- Monthly P&I
- —
- Monthly cashflow
- —
- DSCR
- —
- Eligible?
- —
No personal income docs; deal must DSCR.
Hard money
10% down · 12.0% · 12mo
- Down + closing
- —
- Monthly P&I
- —
- Monthly cashflow
- —
- DSCR
- —
- Eligible?
- —
Short-term bridge; refi at stabilization.
Rent comps 6 comps
| Address | Beds | Baths | Sqft | Rent | $/sqft | DOM | Units | Dist |
|---|---|---|---|---|---|---|---|---|
| 4650 Nelson Rd Lake Charles, LA | 1.0–3.0 | 1.0–2.0 | 1032 | $1,618 | $1.57 | 13d | 24 | 0.67mi |
| 1711 Mignonette Ln Unit 13-C Lake Charles, LA | 2.0 | 1.5 | 1275 | $1,095 | $0.86 | 43d | 1 | 1.05mi |
| 2845 Country Club Rd Lake Charles, LA | 1.0–2.0 | 1.0–2.0 | 900 | $1,889 | $2.10 | 13d | 8 | 1.16mi |
| 155 Heather St Lake Charles, LA | 3.0 | 2.0 | 1316 | $1,650 | $1.25 | 13d | 1 | 1.32mi |
| 4021 Nelson Rd Lake Charles, LA | 3.0 | 2.0 | 1362 | $1,600 | $1.17 | 43d | 1 | 1.39mi |
| 4015 Nelson Rd Lake Charles, LA | 3.0 | 1.0 | 1300 | $1,200 | $0.92 | 43d | 1 | 1.41mi |
Listing history 19 events
-
2026-06-10days on market $119,000 Active 309 DOM
-
2026-06-09days on market $119,000 Active 308 DOM
-
2026-06-08days on market $119,000 Active 307 DOM
-
2026-06-07days on market $119,000 Active 306 DOM
-
2026-06-05days on market $119,000 Active 303 DOM
-
2026-06-02days on market $119,000 Active 301 DOM
-
2026-06-01days on market $119,000 Active 300 DOM
-
2026-05-31days on market $119,000 Active 299 DOM
-
2026-05-30days on market $119,000 Active 298 DOM
-
2025-12-12price $119,000 102-char remark
Show marketing remark (102 chars)
Discover this beautifully updated condo offering a perfect balance of style, comfort, and convenience.
-
2025-09-19price $124,952 102-char remark
Show marketing remark (102 chars)
Discover this beautifully updated condo offering a perfect balance of style, comfort, and convenience.
-
2025-09-06price $128,500 102-char remark
Show marketing remark (102 chars)
Discover this beautifully updated condo offering a perfect balance of style, comfort, and convenience.
-
2025-06-11$129,980 Active 102-char remark
Show marketing remark (102 chars)
Discover this beautifully updated condo offering a perfect balance of style, comfort, and convenience.
-
2019-09-17soldstatus $110,000
-
2016-12-20soldstatus $80,000
-
2016-12-19soldstatus 238-char remark
Show marketing remark (238 chars)
Great condo located in South Lake Charles. This condo is perfect for any first time home buyer! Laminate wood flooring in the living and bedrooms. Large laundry room doubles as a half bathroom downstairs. Private fenced in concrete patio.
-
2016-11-09$94,500 238-char remark
Show marketing remark (238 chars)
Great condo located in South Lake Charles. This condo is perfect for any first time home buyer! Laminate wood flooring in the living and bedrooms. Large laundry room doubles as a half bathroom downstairs. Private fenced in concrete patio.
-
2006-02-27soldstatus $77,200
-
2001-10-16soldstatus $47,000
ⓘ Source: listings_history table (triggers on properties + properties_extension) + one-shot
backfill from property_details.listing_events for pre-trigger history.
Tax reassessment forecast LA · Resets to sale price
- Current annual tax
- $418 · $35/mo
- Projected year-2 tax
- $654 · $55/mo
- Expected delta
- +$236/yr (+$20/mo · 56.4%)
ⓘ Screening estimate from a state-policy table — verify with the county assessor before closing.
Nearby sold comps map
Loading sold comps map…
Walkable amenities ~0.75 mi
Loading nearby amenities…
Taxation est. · year 1
- Rental income
- $17,428
- − Mortgage interest
- −$6,666
- − Property taxes
- −$418
- − Insurance
- −$595
- − Repairs & maintenance
- −$1,394
- − Management
- −$1,394
- − Depreciation
- −$3,462
- Taxable income
- $3,499
- Est. tax owed @ 24.0%
- −$840
- After-tax cash flow
- $4,427/yr
For passive investors: Depreciation is non-cash, so a rental often shows a tax loss while cash-flowing — sheltering income. Rental losses are passive: they offset passive income freely, and up to $25,000/yr can offset ordinary (W-2) income if you actively participate and your MAGI is under $100k (phasing out to $0 by $150k); unused losses carry forward. On sale, claimed depreciation is recaptured at up to 25%, and gains may owe capital-gains tax (a 1031 exchange can defer both). Figures are a year-1 estimate at your 24.0% rate — not tax advice; consult a CPA.
Schools (NCES district)
- District
- Calcasieu Parish
- NCES district ID
- 2200330
- Math proficiency
- 30% ▼ -39.00%
- Reading proficiency
- 44% ▼ -33.00%
- Median HH income
- $44,700
- Composite
- 31.45/100
- National rank
- #5979
- State rank
- #29 of 98 in LA
Livability — Lake Charles
- Score
- 68/100
- State rank
- #95
- US rank
- #9820
Category grades
Schools grade is shown separately in the Schools card above.
Census & demographics
- Census place
- Lake Charles, LA
- County
- Calcasieu Parish · 170,889 people
- City population
- 133,538
- Metro
- Lake Charles, LA
- Population (ZIP)
- 40,482
- Household income
- $86,015
- Rent vs Own
- Severe rent burden
- 1328.0
Population outlook (Calcasieu County) Hauer SSP2
- Today (2025)
- 212,179 people
- By 2030
- 218,199 · +2.8%
- By 2040
- 228,486 · +7.7%
- By 2050
- 236,208 · +11.3%
- By 2075
- 251,696 · +18.6%
- By 2100
- 247,848 · +16.8%
Race, ethnicity, and origin ACS 2023
- Neighborhood character
- Predominantly White (79%)
- Race & ethnicity
- White 79% Black 10% Hispanic / Latino 6% Two or more races 6% Asian 3%
- Hispanic origin (detail)
- Mexican 2%
- Common ancestry
- Lithuanian 12% Italian 3% Slovak 2%
- Foreign-born
- 6% · Canada, Jamaica
- Languages at home
- 92% English-only · Spanish 4% Other Indo-European 2% Other Asian/Pacific 1%
Political lean MEDSL · Calcasieu
- 2024 margin
- Solid R (+39.6) · D 29.5% · R 69.0% · Other 1.5%
- 2008→2024 swing
- -15.0pp toward R · 2008: -24.6pp · 2024: -39.6pp
- All cycles
- 2024: R+39.6 2020: R+35.2 2016: R+33.3 2012: R+28.7 2008: R+24.6
Not yet ingested
- Civics
- —
Market trends
- HPI YoY
- ▼ -102.68%
- Current HPI
- 105.1903
- Rent YoY
- ▲ 15.10%
- Metro
- Lake Charles, LA
- State GDP YoY
- ▲ 3.29%
- F500 in state
- 10
Industry mix (Fortune 500 HQ in LA)
| Industry | F500 HQs | Revenue |
|---|---|---|
| Telecommunications | 2 | $23B |
|
||
| Utilities | 1 | $12B |
|
||
| Wholesale / Distribution | 1 | $5B |
|
||
| Advertising | 1 | $2B |
|
||
Price history
+153.2% since first listed10 events — show timeline
- 2025-12-12 Price Changed $119,000 SWLAR
- 2025-09-19 Price Changed $124,952 SWLAR
- 2025-09-06 Price Changed $128,500 SWLAR
- 2025-06-11 Listed $129,980 SWLAR
- 2019-09-17 Sold (Public Records) $110,000 Public Records
- 2016-12-20 Sold (Public Records) $80,000 Public Records
- 2016-12-19 Sold (MLS) — SWLAR
- 2016-11-09 Listed $94,500 SWLAR
- 2006-02-27 Sold (Public Records) $77,200 Public Records
- 2001-10-16 Sold (Public Records) $47,000 Public Records
Property tax history
+0.1%/yrLatest (2025): $418 · +2.4% YoY. Source: county tax records.
Cash-flow waterfall
monthlySold comps — $/sqft
last 12 mo · ≤1 miLoading sold comps…