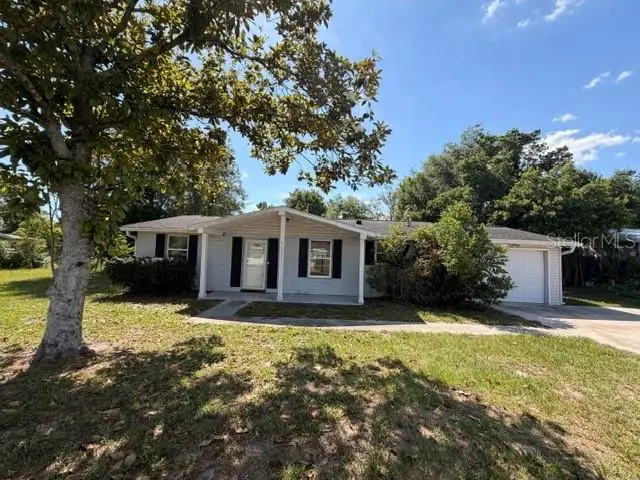
14346 SW 39th Ter · Marion Oaks, FL
Flood risk 1/10 · Minimal
- FEMA flood zone
- X (unshaded)
- Chance of flooding over 30 yrs
- 0.0%
- Est. flood insurance / yr
- $507 – $1,088
Fire risk 4/10 · Minor
- Est. fire insurance / yr
- $947 – $1,759
Heat risk 8/10 · Major
- Hot days now (above 108°F)
- 7 days/yr
- Hot days in 30 yrs
- 22 days/yr
Wind risk 9/10 · Severe
- Chance of severe wind over 30 yrs
- 99.0%
Air-quality risk 3/10 · Minor
- Unhealthy air days now
- 2 days/yr
- Unhealthy air days in 30 yrs
- 4 days/yr
Risk factors via First Street. Map © Google.
Why this score? — see what drove the C+ grade
The composite is a weighted blend of 9 inputs, each scored 0–100. Each bar is that input's sub-score; the figure is the points it added to the 100-point composite (weight × sub-score).
- Cash flow +21.4/30.0
- ARV discount +15.0/15.0
- 1% rule +7.0/10.0
- DSCR +6.8/10.0
- Schools +3.6/10.0
- Livability +2.5/5.0
- Condition / age +2.5/5.0
- Rent growth +2.3/5.0
- Appreciation +0.0/10.0
$149,000
🖨 Deal sheet 📄 Offer letter ✓ Due diligence
Listing remarks MLS
Enjoy the hot summer days with this beautiful pool home. It features 3 Bedrooms, 2 Baths, 1 Car garage, large fenced back yard, utility room and Florida room. Additionally, it has laminate floors and carpet in the rooms. Includes all stainless steel appliances,
Key facts
- In-ground pool
- 0.37 acre lot
- Garage
Tags
Property features AI
Finance
- Other: Lot approximately 0.37 acres (105 x 155, paved road); Unfurnished; Pets allowed
Exterior
- Parking: Attached garage with 1 parking space
- Utilities: Public water; Public sewer; Cable available; Electricity available
- Home design: Single family residence; One story; Faces southwest; Residential zoning (R1)
- Construction: Concrete and stucco construction; Shingle roof; Slab foundation; Built on one level
- Exterior features: Chain link fencing; In-ground private pool
Interior
- Kitchen: No appliances included
- Bedrooms: 3 bedrooms
- Flooring: Carpet; Linoleum
- Bathrooms: 2 full bathrooms
- Heating & cooling: Central heating; Central air conditioning
- Interior features: Thermostat
- Laundry & utility: Laundry located in garage
Neighborhood map
What this means for you Summary
Snapshot
- This is a 3-bed/2.0-bath single-family listed at $149k.
Deal economics
- At list price, monthly cash flow is $220 ($3k/yr) — positive.
- The deal already cash-flows at list — no discount required.
- Meets the 1% rule at list price ($2k rent vs $149k).
- Cap rate 8.1% vs local median 4.8% in Marion Oaks — top-decile yield for the area; either an underpriced asset or a hidden risk that comps aren't pricing in. Stress-test before assuming the spread holds.
Location & tenants
- Location reads: area grade C — affects rentability + tenant quality, not the cash-flow math above.
- Marion (rural): math 42% / reading 43% proficiency, ranked #61 of 73 in FL (top 84%) — families likely to look elsewhere, expect single-tenant / working-renter base with shorter leases; 61% free/reduced lunch — lower-income household profile, screen leases tightly.
- Market conditions: Rents soft (-0.7%/yr); 1355 active listings in the ZIP; 23 comparable units currently listed for rent nearby; rentals at typical pace (median 14d on market — plan ~3-4 weeks tenant-placement turnaround); 7,071 units permitted in Marion County in 2024 (534 in 5+ unit buildings).
Forward outlook
- Local home prices are declining (-3.0%/yr); year-one equity from $1k of loan paydown is wiped out by about $4k of value loss. Plan a longer hold.
- Marion County population projected at +13% by 2050 — modest demand growth; plan on rents tracking national, not racing it.
Negotiation context
- Only 7 days on market — expect competitive offers; lowballing is unlikely to land.
- 8 sale attempts since 19y ago with the ask held roughly flat each time — persistent listings suggest the price (not the market) is what's stuck; bring a comps-based counter.
Risks & watch-outs
- Watch-outs: property tax is 2.8% of price.
- Climate carrying-cost: severe wind risk, 99% chance of damaging wind over 30y; extreme-heat days projected 7→22/yr by 2055 (HVAC capex compounding) — expect insurance premiums to compound above CPI over the hold.
Questions for the listing agent
- Built in 1977 — when were the roof, HVAC, electrical panel, plumbing, and water heater last replaced?
- Property tax is high relative to price — has the assessment been appealed recently, and will the sale trigger a re-assessment?
- Is there a deadline driving the sale (1031 exchange, divorce, estate, relocation)? That informs how much negotiation room exists.
- What's the average days-on-market for RENTAL listings here right now (not sales)? A rising rental-DOM trend means longer vacancies and softer asking-rent achievability than the comps imply.
- What's the recent tenant-quality profile in this submarket — average credit score on applications, eviction rate, late-payment / NSF rate, and stable-employment percentage? A property-management company in the area should have these aggregated.
- How much new for-sale + rental construction is in the pipeline within 1–3 miles? Heavy new supply typically softens prices + rents 12–24 months out; constrained supply supports both.
Investment metrics
- 1% rule
- 1.20% ✓
- Cap rate
- 8.06%
- Cash-on-cash
- 6.32%
- DSCR
- 1.28
- GRM
- 7.0
CMA / ARV
- ARV (on-the-fly)
- $192,192
- Comps found
- 12
Show comp detail 12 sales within ~0.75 mi
| Address | Dist | Beds/Ba | Sqft | Sold | Price | $/sf | Match |
|---|---|---|---|---|---|---|---|
| 14545 SW 34th Terrace Rd | 0.51mi | 3/2.0 | 1,285 (+4%) | 11mo | $178,000 | $139 | 60 |
| 3573 SW 147th Lane Rd | 0.50mi | 3/2.0 | 1,328 (+8%) | 7mo | $179,900 | $135 | 58 |
| 3530 SW 147th Lane Road Rd | 0.58mi | 3/1.5 | 1,184 (-4%) | 8mo | $129,000 | $109 | 58 |
| 173 Marion Oaks Ln | 0.44mi | 2/2.0 (-1) | 1,289 (+5%) | 15mo | $159,000 | $123 | 55 |
| 14526 SW 43rd Court Rd | 0.27mi | 3/2.0 | 1,344 (+9%) | 21mo | $209,000 | $156 | 54 |
| 14540 SW 35th Terrace Rd | 0.32mi | 3/2.0 | 1,104 (-10%) | 18mo | $199,000 | $180 | 53 |
| 14530 SW 35th Terrace Rd | 0.32mi | 2/2.0 (-1) | 1,325 (+8%) | 18mo | $199,000 | $150 | 52 |
| 14556 SW 45th Cir | 0.36mi | 3/2.0 | 1,378 (+12%) | 14mo | $238,900 | $173 | 52 |
| 4756 SW 143rd Loop | 0.62mi | 3/2.0 | 1,228 (-0%) | 23mo | $276,000 | $225 | 51 |
| 14256 SW 43rd Court Rd | 0.09mi | 2/2.0 (-1) | 1,387 (+13%) | 24mo | $247,000 | $178 | 50 |
| 223 Marion Oaks Ln | 0.55mi | 2/2.0 (-1) | 1,121 (-9%) | 9mo | $130,000 | $116 | 47 |
| 15011 SW 37th Ter | 0.74mi | 2/2.0 (-1) | 1,240 (+1%) | 18mo | $210,000 | $169 | 44 |
Match score weights: distance 35% · size 25% · config 20% · recency 20%. Top-matched comps best support the ARV.
Projected returns pro-forma
-3.0% appreciation · 0.0% rent growth · sell at horizon
- IRR
- -10.4%
- Equity multiple
- 0.63×
- Total profit
- $-15,262
- Equity at exit
- $22,216
- IRR
- -6.6%
- Equity multiple
- 0.64×
- Total profit
- $-14,989
- Equity at exit
- $12,883
Cash invested: $41,720 (down + closing). Projections, not guarantees.
Landlord ↔ Tenant lean methodology
- Overall (STATE)
- 87 Strongly Landlord-Friendly
- State Florida
- 87 Strongly Landlord-Friendly · R+3
- County
- — inherits STATE
- City
- — inherits STATE
ZIP-level market 34473
- Home prices YoY
- -16.8%
- Rents YoY
- -0.7%
- Active inventory
- 1355
- Price-to-rent
- 7.0×
Monthly cashflow live
- Estimated rent
- $1,786 high interval (Pro) →
- Mortgage (P&I)
- −$781
- Tax from tax record
- −$348 /mo · $4,173/yr
- Insurance
- −$62
- HOA
- −$0
- Vacancy / Maint / Mgmt
- −$375
- Net cashflow
- $220
Break-even live
UW: 25.0% down · 7.5% · 30yr · 1.5% tax · 5.0% vac · 8.0% maint · 8.0% mgmt
Financing live
Cash to close
- Down payment
- $37,250
- Closing costs
- $4,470
- Reserves months
- —
- Total cash needed
- —
Loan-product check · same deal, 3 products live
Conventional
25% down · 7.5% · 30yr
- Down + closing
- —
- Monthly P&I
- —
- Monthly cashflow
- —
- DSCR
- —
- Eligible?
- —
Personal DTI + credit; lowest rate.
DSCR
20% down · 8.5% · 30yr
- Down + closing
- —
- Monthly P&I
- —
- Monthly cashflow
- —
- DSCR
- —
- Eligible?
- —
No personal income docs; deal must DSCR.
Hard money
10% down · 12.0% · 12mo
- Down + closing
- —
- Monthly P&I
- —
- Monthly cashflow
- —
- DSCR
- —
- Eligible?
- —
Short-term bridge; refi at stabilization.
Rent comps 23 comps
| Address | Beds | Baths | Sqft | Rent | $/sqft | DOM | Units | Dist |
|---|---|---|---|---|---|---|---|---|
| 4309 SW 143rd Lane Rd Ocala, FL | 3.0 | 2.0 | 1238 | $1,799 | $1.45 | 14d | 1 | 0.22mi |
| 14525 SW 42nd Terrace Rd Ocala, FL | 3.0 | 2.0 | 1344 | $1,850 | $1.38 | 14d | 1 | 0.29mi |
| 14430 SW 34th Terrace Rd Ocala, FL | 2.0 | 2.0 | 1025 | $1,350 | $1.32 | 14d | 1 | 0.30mi |
| 14193 SW 44th Ct Ocala, FL | 3.0 | 2.0 | 1449 | $1,599 | $1.10 | 14d | 1 | 0.41mi |
| 4004 SW 138th Pl Ocala, FL | 3.0 | 2.0 | 1348 | $1,695 | $1.26 | 21d | 1 | 0.52mi |
| 14614 SW 46th Ct Ocala, FL | 3.0 | 2.0 | 1200 | $1,800 | $1.50 | 21d | 1 | 0.62mi |
| 251 Marion Oaks Crse Ocala, FL | 3.0 | 2.0 | 1373 | $1,795 | $1.31 | 21d | 1 | 0.62mi |
| 14856 SW 35th Cir Ocala, FL | 2.0 | 2.0 | 1036 | $1,450 | $1.40 | 14d | 1 | 0.66mi |
| 13731 SW 40th Cir Ocala, FL | 3.0 | 2.0 | 1463 | $1,695 | $1.16 | 14d | 1 | 0.69mi |
| 13805 SW 43rd Cir Ocala, FL | 4.0 | 2.0 | 1494 | $1,800 | $1.20 | 21d | 1 | 0.70mi |
| 3313 SW 147th St Ocala, FL | 2.0 | 2.0 | 1121 | $1,400 | $1.25 | 21d | 1 | 0.76mi |
| 3567 SW 151st St Ocala, FL | 2.0 | 2.0 | 1126 | $1,450 | $1.29 | 21d | 1 | 0.84mi |
| 14965 SW 48th Ave Ocala, FL | 4.0 | 2.0 | 1342 | $1,700 | $1.27 | 14d | 1 | 0.93mi |
| 15018 SW 48th Ave Ocala, FL | 3.0 | 2.0 | 1413 | $1,625 | $1.15 | 14d | 1 | 0.97mi |
| 15095 SW 51st Ter Ocala, FL | 3.0 | 2.0 | 1196 | $1,500 | $1.25 | 14d | 1 | 1.23mi |
| 3011 SW 140th Loop Ocala, FL | 3.0 | 2.0 | 1335 | $1,695 | $1.27 | 21d | 1 | 1.24mi |
| 2730 SW 145th Place Rd Ocala, FL | 3.0 | 2.0 | 1373 | $1,725 | $1.26 | 21d | 1 | 1.25mi |
| 2632 SW 145th Place Rd Ocala, FL | 3.0 | 2.0 | 1488 | $1,675 | $1.13 | 14d | 1 | 1.33mi |
| 2598 SW 147th Pl Ocala, FL | 3.0 | 2.0 | 1442 | $1,750 | $1.21 | 14d | 1 | 1.40mi |
| 15729 SW 34th Court Rd Ocala, FL | 2.0 | 2.0 | 984 | $1,400 | $1.42 | 14d | 1 | 1.41mi |
| 3971 SW 130th Loop Ocala, FL | 4.0 | 2.0 | 1485 | $2,000 | $1.35 | 14d | 1 | 1.42mi |
| 15739 SW 34th Court Rd Ocala, FL | 2.0 | 2.0 | 984 | $1,400 | $1.42 | 14d | 1 | 1.42mi |
| 15434 SW 29th Terrace Rd Ocala, FL | 3.0 | 2.0 | 1399 | $1,780 | $1.27 | 14d | 1 | 1.50mi |
Listing history 7 events
-
2026-06-18statusdays on market $149,000 Pending 7 DOM
-
2026-06-17days on market $149,000 Active 6 DOM
-
2026-06-16days on market $149,000 Active 5 DOM
-
2026-06-15days on market $149,000 Active 4 DOM
-
2026-06-14days on market $149,000 Active 2 DOM
-
2026-06-13remarks 151-char remark
-
2026-06-13$149,000 Active 1 DOM
ⓘ Source: listings_history table (triggers on properties + properties_extension) + one-shot
backfill from property_details.listing_events for pre-trigger history.
Tax reassessment forecast FL · Resets to sale price
- Current annual tax
- $4,173 · $348/mo
- Projected year-2 tax
- $4,173 · $348/mo
- Expected delta
- $0/yr ($0/mo · 0.0%)
ⓘ Screening estimate from a state-policy table — verify with the county assessor before closing.
Climate risk First Street
- Flood 1/10 Low FEMA zone X (unshaded) · 0% chance over 30 yrs
- Wildfire 4/10 Moderate
- Heat 8/10 Severe 7 d/yr ≥108°F today · 22 d/yr by 30 yrs out
- Wind 9/10 Extreme 99% chance of damaging wind over 30 yrs
- Air quality 3/10 Moderate 2 unhealthy d/yr today · 4 by 30 yrs out
Nearby sold comps map
Loading sold comps map…
Walkable amenities ~0.75 mi
Loading nearby amenities…
Taxation est. · year 1
- Rental income
- $21,431
- − Mortgage interest
- −$8,346
- − Property taxes
- −$4,173
- − Insurance
- −$745
- − Repairs & maintenance
- −$1,714
- − Management
- −$1,714
- − Depreciation
- −$4,335
- Taxable income
- $403
- Est. tax owed @ 24.0%
- −$97
- After-tax cash flow
- $2,539/yr
For passive investors: Depreciation is non-cash, so a rental often shows a tax loss while cash-flowing — sheltering income. Rental losses are passive: they offset passive income freely, and up to $25,000/yr can offset ordinary (W-2) income if you actively participate and your MAGI is under $100k (phasing out to $0 by $150k); unused losses carry forward. On sale, claimed depreciation is recaptured at up to 25%, and gains may owe capital-gains tax (a 1031 exchange can defer both). Figures are a year-1 estimate at your 24.0% rate — not tax advice; consult a CPA.
Schools (NCES district)
- District
- Marion
- NCES district ID
- 1201260
- Math proficiency
- 42% ▼ -7.00%
- Reading proficiency
- 43% ▼ -4.00%
- Median HH income
- $40,015
- Composite
- 35.61/100
- National rank
- #4890
- State rank
- #61 of 73 in FL
Livability — Marion Oaks
No livability data for this city. (Only ~50 U.S. cities are tracked.)
Census & demographics
- Census place
- Marion Oaks, FL
- County
- Marion County · 315,796 people
- City population
- 25,030
- Metro
- Ocala, FL
- Population (ZIP)
- 26,813
- Household income
- $72,366
- Rent vs Own
- Severe rent burden
- 228.0
Population outlook (Marion County) Hauer SSP2
- Today (2025)
- 365,905 people
- By 2030
- 376,768 · +3.0%
- By 2040
- 396,555 · +8.4%
- By 2050
- 412,723 · +12.8%
- By 2075
- 446,090 · +21.9%
- By 2100
- 436,193 · +19.2%
Race, ethnicity, and origin ACS 2023
- Neighborhood character
- Diverse neighborhood (Simpson 0.69)
- Race & ethnicity
- White 34% Black 33% Hispanic / Latino 29% Two or more races 19% Asian 1%
- Hispanic origin (detail)
- Mexican 1% Puerto Rican 17% Cuban 3%
- Common ancestry
- Hispanic 3% Portuguese 2% Romanian 1%
- Foreign-born
- 17% · Canada, Jamaica
- Languages at home
- 67% English-only · Spanish 27% French/Haitian/Cajun 4% Other Indo-European 1%
Political lean MEDSL · Marion
- 2024 margin
- Solid R (+31.6) · D 33.8% · R 65.5%
- 2008→2024 swing
- -20.0pp toward R · 2008: -11.6pp · 2024: -31.6pp
- All cycles
- 2024: R+31.6 2020: R+25.9 2016: R+26.2 2012: R+16.2 2008: R+11.6
Not yet ingested
- Civics
- —
Market trends
- HPI YoY
- ▼ -45.25%
- Current HPI
- 224.3536
- Rent YoY
- ▼ -0.67%
- Metro
- Ocala, FL
- State GDP YoY
- ▲ 3.28%
- F500 in state
- 36
Industry mix (Fortune 500 HQ in FL)
| Industry | F500 HQs | Revenue |
|---|---|---|
| Industrial Technology | 2 | $29B |
|
||
| Insurance | 2 | $17B |
|
||
| Retail | 1 | $60B |
|
||
| Technology Distribution | 1 | $58B |
|
||
| Homebuilding | 1 | $35B |
|
||
| Technology Manufacturing | 1 | $35B |
|
||
Price history
+181.7% since first listed18 events — show timeline
- 2026-06-11 Listed $149,000 Stellar MLS as Distributed by MLS Grid
- 2025-04-01 Listed $214,900 Stellar MLS as Distributed by MLS Grid
- 2019-11-25 Sold (Public Records) $147,900 Public Records
- 2019-11-22 Sold (MLS) $147,900 Stellar MLS as Distributed by MLS Grid
- 2019-07-12 Listed $145,900 Stellar MLS as Distributed by MLS Grid
- 2018-10-22 Sold (Public Records) $128,000 Public Records
- 2018-10-16 Sold (MLS) $128,000 Stellar MLS as Distributed by MLS Grid
- 2018-08-13 Listed $139,900 Stellar MLS as Distributed by MLS Grid
- 2018-05-25 Sold (MLS) $56,000 Stellar MLS as Distributed by MLS Grid
- 2018-05-09 Listed $56,000 Stellar MLS as Distributed by MLS Grid
- 2011-05-11 Listing Removed — Stellar MLS as Distributed by MLS Grid
- 2010-08-25 Listed $62,900 Stellar MLS as Distributed by MLS Grid
- 2010-06-30 Listing Removed — Stellar MLS as Distributed by MLS Grid
- 2010-01-18 Listed $68,000 Stellar MLS as Distributed by MLS Grid
- 2007-12-31 Listing Removed — Stellar MLS as Distributed by MLS Grid
- 2007-06-09 Listed $168,000 Stellar MLS as Distributed by MLS Grid
- 1985-12-01 Sold (Public Records) $51,500 Public Records
- 1983-03-01 Sold (Public Records) $52,900 Public Records
Property tax history
+20.3%/yrLatest (2025): $4,173 · +18.5% YoY. Source: county tax records.
Cash-flow waterfall
monthlySold comps — $/sqft
last 12 mo · ≤1 miLoading sold comps…