11 Barksdale Dr · Jacksonville, NC
Flood risk 1/10 · Minimal
- FEMA flood zone
- X (unshaded)
- Chance of flooding over 30 yrs
- 0.0%
- Est. flood insurance / yr
- $507 – $1,088
Fire risk 4/10 · Minor
- Est. fire insurance / yr
- $906 – $1,684
Heat risk 8/10 · Major
- Hot days now (above 105°F)
- 7 days/yr
- Hot days in 30 yrs
- 18 days/yr
Wind risk 8/10 · Major
- Chance of severe wind over 30 yrs
- 99.0%
Air-quality risk 3/10 · Minor
- Unhealthy air days now
- 2 days/yr
- Unhealthy air days in 30 yrs
- 3 days/yr
Risk factors via First Street. Map © Google.
Why this score? — see what drove the B grade
The composite is a weighted blend of 9 inputs, each scored 0–100. Each bar is that input's sub-score; the figure is the points it added to the 100-point composite (weight × sub-score).
- Cash flow +30.0/30.0
- 1% rule +10.0/10.0
- DSCR +10.0/10.0
- ARV discount +7.5/15.0
- Schools +3.9/10.0
- Rent growth +3.6/5.0
- Livability +3.6/5.0
- Condition / age +2.5/5.0
- Appreciation +0.0/10.0
$80,975
🖨 Deal sheet 📄 Offer letter ✓ Due diligence
Listing remarks
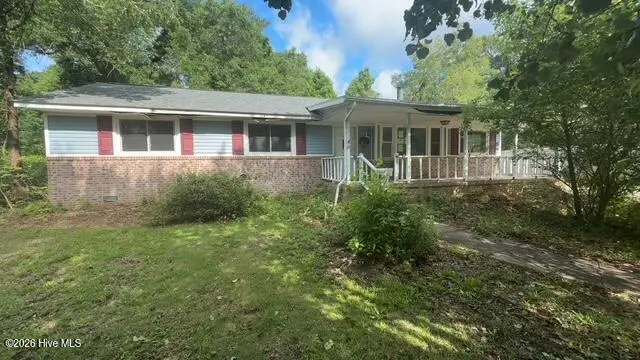
Ranch style home offers 3-beds and 1-bath. Covered front porch to welcome your guest or enjoy your morning coffee. Open concept for living room and dining room. Wood-burning fireplace featured in living area. Separate room that could be used for your office or as a family room. Entertain in the fenced backyard or watch your furry friends run and play. Home is located in the Northwoods Subdivision. ''This property may qualify for Seller Financing (Vendee). '' Property was built prior to 1978 and lead based paint potentially exists.
Key facts
- Covered front porch
- Open concept
- Fenced backyard
Tags
Property features AI
Finance
- Other: Zoning: RSF-7; Lot dimensions approximately 116 x 112 x 132 x 198 (0.42 acres)
Neighborhood map
What this means for you Summary
Snapshot
- This is a 3-bed/1.0-bath single-family listed at $81k.
Deal economics
- At list price, monthly cash flow is $591 ($7k/yr) — positive.
- The deal already cash-flows at list — no discount required.
- Meets the 1% rule at list price ($1k rent vs $81k).
- Cap rate 15.0% vs local median 4.4% in Jacksonville — top-decile yield for the area; either an underpriced asset or a hidden risk that comps aren't pricing in. Stress-test before assuming the spread holds.
Location & tenants
- Location reads 71/100 on livability (#111 in NC) — a middle-class / working-renter tenant base. Strengths: cost of living A+, housing A+, health & safety A+; Watch: employment D, crime F, amenities F.
- Onslow County Schools (other): math 42% / reading 49% proficiency, ranked #84 of 178 in NC (top 47%) — families likely to look elsewhere, expect single-tenant / working-renter base with shorter leases.
- Zoned schools: Parkwood Elementary (math 62% / reading 62%, grade B, #179 of 1,410 statewide, top 14%, 503 students, 52% FRL); Northwoods Park Middle (math 34% / reading 46%, grade F, #222 of 475 statewide, top 49%, 688 students, 52% FRL); Jacksonville High (math 52% / reading 66%, grade C+, #233 of 535 statewide, top 44%, 1,423 students, 44% FRL).
- Market conditions: Rents rising fast (+4.5%/yr); 380 active listings in the ZIP; 9 comparable units currently listed for rent nearby; rentals at typical pace (median 21d on market — plan ~3-4 weeks tenant-placement turnaround); 1,246 units permitted in Onslow County in 2024 (0 in 5+ unit buildings).
Forward outlook
- Local home prices are declining (-3.0%/yr); year-one equity from $560 of loan paydown is wiped out by about $2k of value loss. Plan a longer hold.
- At projected returns (-3.0% appreciation + 4.5% rent growth), your $23k cash investment doubles in ~4 years — after that, you're playing with house money.
Negotiation context
- Only 11 days on market — expect competitive offers; lowballing is unlikely to land.
- Current owner paid $60k; 35% above their basis — modest negotiation headroom, anchor on the comps not their cost.
Risks & watch-outs
- Climate carrying-cost: severe wind risk, 99% chance of damaging wind over 30y; extreme-heat days projected 7→18/yr by 2055 (HVAC capex compounding) — expect insurance premiums to compound above CPI over the hold.
Questions for the listing agent
- Built in 1962 — when were the roof, HVAC, electrical panel, plumbing, and water heater last replaced?
- Is there a deadline driving the sale (1031 exchange, divorce, estate, relocation)? That informs how much negotiation room exists.
- Crime grade is F in this area — have there been break-ins, vandalism, or insurance claims at this property in the last 3 years? What carrier currently insures it and at what premium?
- What's the average days-on-market for RENTAL listings here right now (not sales)? A rising rental-DOM trend means longer vacancies and softer asking-rent achievability than the comps imply.
- What's the recent tenant-quality profile in this submarket — average credit score on applications, eviction rate, late-payment / NSF rate, and stable-employment percentage? A property-management company in the area should have these aggregated.
- How much new for-sale + rental construction is in the pipeline within 1–3 miles? Heavy new supply typically softens prices + rents 12–24 months out; constrained supply supports both.
Investment metrics
- 1% rule
- 1.85% ✓
- Cap rate
- 15.05%
- Cash-on-cash
- 31.26%
- DSCR
- 2.39
- GRM
- 4.5
CMA / ARV
- ARV (on-the-fly)
- $233,536
- Comps found
- 12
Show comp detail 12 sales within ~0.75 mi
| Address | Dist | Beds/Ba | Sqft | Sold | Price | $/sf | Match |
|---|---|---|---|---|---|---|---|
| 13 Bosco Dr | 0.07mi | 3/1.5 | 1,188 (-10%) | 3mo | $140,000 | $118 | 76 |
| 721 Gardenview Dr | 0.45mi | 3/2.0 | 1,330 (+1%) | 2mo | $238,000 | $179 | 71 |
| 400 Seminole Trl | 0.22mi | 3/2.0 | 1,193 (-9%) | 2mo | $235,000 | $197 | 69 |
| 412 Seminole Trl | 0.17mi | 3/1.0 | 1,150 (-12%) | 3mo | $205,000 | $178 | 68 |
| 308 Woodhaven Dr | 0.66mi | 3/1.0 | 1,335 (+2%) | 3mo | $124,900 | $94 | 64 |
| 721 Vernon Dr | 0.52mi | 3/2.0 | 1,373 (+5%) | 1mo | $219,900 | $160 | 63 |
| 719 Page Dr | 0.59mi | 3/2.0 | 1,365 (+4%) | 4mo | $240,000 | $176 | 58 |
| 505 Maple St | 0.65mi | 3/2.0 | 1,301 (-1%) | 7mo | $218,000 | $168 | 58 |
| 408 Decatur Rd | 0.35mi | 3/2.0 | 1,150 (-12%) | 2mo | $234,600 | $204 | 57 |
| 608 Maple St | 0.52mi | 3/1.0 | 1,158 (-12%) | 2mo | $205,000 | $177 | 54 |
| 703 Christine Ave | 0.54mi | 3/2.0 | 1,182 (-10%) | 0mo | $245,000 | $207 | 54 |
| 801 Schoolfield Dr Lot 131 | 0.59mi | 3/2.0 | 1,500 (+14%) | 5mo | $339,582 | $226 | 41 |
Match score weights: distance 35% · size 25% · config 20% · recency 20%. Top-matched comps best support the ARV.
Projected returns pro-forma
-3.0% appreciation · 4.47% rent growth · sell at horizon
- IRR
- 27.8%
- Equity multiple
- 2.18×
- Total profit
- $26,787
- Equity at exit
- $12,074
- IRR
- 36.2%
- Equity multiple
- 4.59×
- Total profit
- $81,429
- Equity at exit
- $7,001
Cash invested: $22,673 (down + closing). Projections, not guarantees.
Landlord ↔ Tenant lean methodology
- Overall (STATE)
- 85 Strongly Landlord-Friendly
- State North Carolina
- 85 Strongly Landlord-Friendly · R+3
- County
- — inherits STATE
- City
- — inherits STATE
ZIP-level market 28540
- Home prices YoY
- -21.5%
- Rents YoY
- 4.5%
- Active inventory
- 380
- Price-to-rent
- 4.5×
Monthly cashflow live
- Estimated rent
- $1,495 high interval (Pro) →
- Mortgage (P&I)
- −$425
- Tax from tax record
- −$132 /mo · $1,586/yr
- Insurance
- −$34
- HOA
- −$0
- Vacancy / Maint / Mgmt
- −$314
- Net cashflow
- $591
Break-even live
UW: 25.0% down · 7.5% · 30yr · 1.5% tax · 5.0% vac · 8.0% maint · 8.0% mgmt
Financing live
Cash to close
- Down payment
- $20,244
- Closing costs
- $2,429
- Reserves months
- —
- Total cash needed
- —
Loan-product check · same deal, 3 products live
Conventional
25% down · 7.5% · 30yr
- Down + closing
- —
- Monthly P&I
- —
- Monthly cashflow
- —
- DSCR
- —
- Eligible?
- —
Personal DTI + credit; lowest rate.
DSCR
20% down · 8.5% · 30yr
- Down + closing
- —
- Monthly P&I
- —
- Monthly cashflow
- —
- DSCR
- —
- Eligible?
- —
No personal income docs; deal must DSCR.
Hard money
10% down · 12.0% · 12mo
- Down + closing
- —
- Monthly P&I
- —
- Monthly cashflow
- —
- DSCR
- —
- Eligible?
- —
Short-term bridge; refi at stabilization.
Rent comps 9 comps
| Address | Beds | Baths | Sqft | Rent | $/sqft | DOM | Units | Dist |
|---|---|---|---|---|---|---|---|---|
| 1030 Daniel Dr Jacksonville, NC | 3.0 | 2.0 | 1872 | $2,000 | $1.07 | 21d | 1 | 0.73mi |
| 508 Henderson Dr Jacksonville, NC | 3.0 | 1.0 | 1050 | $1,400 | $1.33 | 21d | 1 | 0.81mi |
| 16 White Oak St Jacksonville, NC | 3.0 | 2.0 | 1150 | $1,650 | $1.43 | 21d | 1 | 1.21mi |
| 113 N Shore Dr Jacksonville, NC | 3.0 | 1.0 | 1126 | $1,395 | $1.24 | 21d | 1 | 1.30mi |
| 200 Carmen Ave Jacksonville, NC | 1.0–2.0 | 1.0–1.5 | 871 | $1,320 | $1.52 | 13d | 6 | 1.31mi |
| 319 Bracken Pl Jacksonville, NC | 2.0 | 3.0 | 992 | $1,150 | $1.16 | 21d | 1 | 1.34mi |
| 2322 Indian Dr Unit A-3 Jacksonville, NC | 2.0 | 1.0 | 1120 | $1,150 | $1.03 | 13d | 1 | 1.46mi |
| 2318 Indian Dr Unit B-7 Jacksonville, NC | 2.0 | 1.0 | 1120 | $995 | $0.89 | 21d | 1 | 1.49mi |
| 1 S Onsville Pl Jacksonville, NC | 2.0 | 1.5 | 992 | $1,395 | $1.41 | 21d | 1 | 1.50mi |
Listing history 9 events
-
2026-06-09statusdays on market $80,975 Pending 11 DOM
-
2026-06-07days on market $80,975 Active 10 DOM
-
2026-06-03days on market $80,975 Active 6 DOM
-
2026-06-02days on market $80,975 Active 5 DOM
-
2026-06-01days on market $80,975 Active 4 DOM
-
2026-05-31days on market $80,975 Active 3 DOM
-
2026-05-30days on market $80,975 Active 2 DOM
-
2026-05-28$80,975 Active
-
1995-09-27soldstatus $60,000
ⓘ Source: listings_history table (triggers on properties + properties_extension) + one-shot
backfill from property_details.listing_events for pre-trigger history.
Tax reassessment forecast NC · Resets to sale price
- Current annual tax
- $1,586 · $132/mo
- Projected year-2 tax
- $1,586 · $132/mo
- Expected delta
- $0/yr ($0/mo · 0.0%)
ⓘ Screening estimate from a state-policy table — verify with the county assessor before closing.
Climate risk First Street
- Flood 1/10 Low FEMA zone X (unshaded) · 0% chance over 30 yrs
- Wildfire 4/10 Moderate
- Heat 8/10 Severe 7 d/yr ≥105°F today · 18 d/yr by 30 yrs out
- Wind 8/10 Severe 99% chance of damaging wind over 30 yrs
- Air quality 3/10 Moderate 2 unhealthy d/yr today · 3 by 30 yrs out
Nearby sold comps map
Loading sold comps map…
Walkable amenities ~0.75 mi
Loading nearby amenities…
Taxation est. · year 1
- Rental income
- $17,943
- − Mortgage interest
- −$4,536
- − Property taxes
- −$1,586
- − Insurance
- −$405
- − Repairs & maintenance
- −$1,435
- − Management
- −$1,435
- − Depreciation
- −$2,356
- Taxable income
- $6,190
- Est. tax owed @ 24.0%
- −$1,486
- After-tax cash flow
- $5,603/yr
For passive investors: Depreciation is non-cash, so a rental often shows a tax loss while cash-flowing — sheltering income. Rental losses are passive: they offset passive income freely, and up to $25,000/yr can offset ordinary (W-2) income if you actively participate and your MAGI is under $100k (phasing out to $0 by $150k); unused losses carry forward. On sale, claimed depreciation is recaptured at up to 25%, and gains may owe capital-gains tax (a 1031 exchange can defer both). Figures are a year-1 estimate at your 24.0% rate — not tax advice; consult a CPA.
Schools (NCES district)
- District
- Onslow County Schools
- NCES district ID
- 3703450
- Math proficiency
- 42% ▲ 6.00%
- Reading proficiency
- 49% ▲ 5.00%
- Median HH income
- $46,076
- Composite
- 38.66/100
- National rank
- #4148
- State rank
- #84 of 178 in NC
Livability — Jacksonville
- Score
- 71/100
- State rank
- #111
- US rank
- #6991
Category grades
Schools grade is shown separately in the Schools card above.
Census & demographics
- Census place
- Jacksonville, NC
- County
- Onslow County · 164,453 people
- City population
- 96,397
- Metro
- Jacksonville, NC
- Population (ZIP)
- 49,141
- Household income
- $65,625
- Rent vs Own
- Severe rent burden
- 1304.0
Population outlook (Onslow County) Hauer SSP2
- Today (2025)
- 189,789 people
- By 2030
- 194,463 · +2.5%
- By 2040
- 193,629 · +2.0%
- By 2050
- 193,248 · +1.8%
- By 2075
- 196,995 · +3.8%
- By 2100
- 201,513 · +6.2%
Race, ethnicity, and origin ACS 2023
- Neighborhood character
- Diverse neighborhood (Simpson 0.58)
- Race & ethnicity
- White 62% Black 14% Hispanic / Latino 14% Two or more races 13% Asian 2%
- Hispanic origin (detail)
- Mexican 5% Puerto Rican 6%
- Common ancestry
- Italian 3% Serbian 2% Romanian 2%
- Foreign-born
- 4% · Canada, China
- Languages at home
- 90% English-only · Spanish 7% Chinese 1% Other Asian/Pacific 1%
Political lean MEDSL · Onslow
- 2024 margin
- Solid R (+35.9) · D 31.5% · R 67.5% · Other 1.0%
- 2008→2024 swing
- -14.5pp toward R · 2008: -21.5pp · 2024: -35.9pp
- All cycles
- 2024: R+35.9 2020: R+30.2 2016: R+34.6 2012: R+27.0 2008: R+21.5
Not yet ingested
- Civics
- —
Market trends
- HPI YoY
- ▼ -60.11%
- Current HPI
- 219.5571
- Rent YoY
- ▲ 4.47%
- Metro
- Jacksonville, NC
- State GDP YoY
- ▲ 3.28%
- F500 in state
- 26
Industry mix (Fortune 500 HQ in NC)
| Industry | F500 HQs | Revenue |
|---|---|---|
| Financial Services | 2 | $213B |
|
||
| Retail | 2 | $95B |
|
||
| Industrial Conglomerate | 1 | $38B |
|
||
| Metals / Steel | 1 | $35B |
|
||
| Utilities | 1 | $30B |
|
||
| Industrial Machinery | 1 | $19B |
|
||
Price history
+35.0% since first listed2 events — show timeline
- 2026-05-28 Listed $80,975 Hive MLS
- 1995-09-27 Sold (Public Records) $60,000 Public Records
Property tax history
+1.7%/yrLatest (2025): $1,586 · +0.0% YoY. Source: county tax records.
Cash-flow waterfall
monthlySold comps — $/sqft
last 12 mo · ≤1 miLoading sold comps…