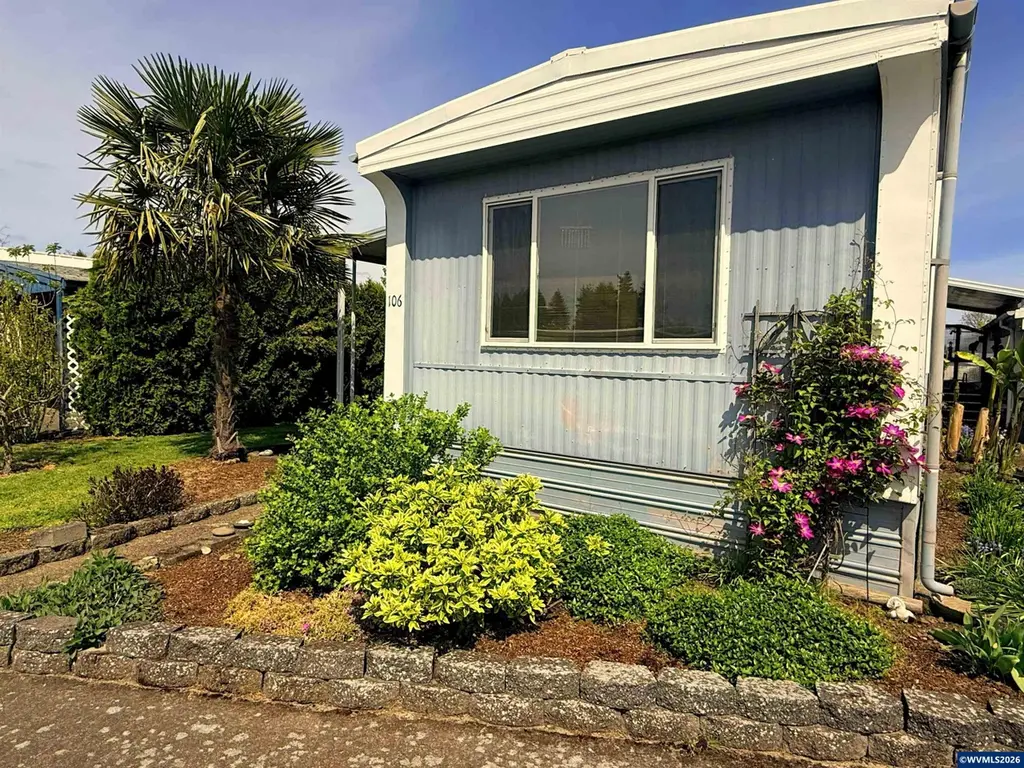
2232 42nd Ave NE #106 · Salem, OR
Flood risk 1/10 · Minimal
- FEMA flood zone
- X
- Chance of flooding over 30 yrs
- 0.0%
- Est. flood insurance / yr
- $435 – $905
Fire risk 1/10 · Minimal
- Est. fire insurance / yr
- $498 – $926
Heat risk 4/10 · Minor
- Hot days now (above threshold)
- 7 days/yr
- Hot days in 30 yrs
- 15 days/yr
Wind risk No data
- Chance of severe wind over 30 yrs
- —
Air-quality risk No data
- Unhealthy air days now
- —
- Unhealthy air days in 30 yrs
- —
Risk factors via First Street. Map © Google.
Why this score? — see what drove the B grade
The composite is a weighted blend of 9 inputs, each scored 0–100. Each bar is that input's sub-score; the figure is the points it added to the 100-point composite (weight × sub-score).
- Cash flow +30.0/30.0
- 1% rule +10.0/10.0
- DSCR +10.0/10.0
- ARV discount +7.5/15.0
- Livability +4.0/5.0
- Schools +3.7/10.0
- Rent growth +3.2/5.0
- Condition / age +2.5/5.0
- Appreciation +0.0/10.0
$40,000
🖨 Deal sheet 📄 Offer letter ✓ Due diligence
Listing remarks
Charming 2bd/1ba, light & bright with newer vinyl framed windows, newer water heater, lots of storage, and beautifully landscaped (see attached Featured List). Recently weatherized underneath the home. Kitchen has a large pantry, a 2021 electric range & refrigerator/freezer. Located in a 55+ gated community featuring an indoor, heated, salt-water pool, fully equipped fitness room, library, billiards, & inviting outdoor spaces w/ firepits & grills. A great opportunity to enjoy both comfort & connection.
Key facts
- Lots of storage
- Newer water heater
- Large pantry
Tags
Property features AI
Finance
- Other: Home warranty negotiable; No assessments/liens reported
- HOA & community: Park rent includes access to swimming pool; 55+ gated community with shared amenities: indoor heated salt-water pool, fitness room, library, billiards, outdoor spaces with firepits and grills
Exterior
- Parking: Carport; 2 garage spaces
- Security: Gated community
- Utilities: City water; City sewer; Electric water heater; City power available
- Home design: Single-wide mobile home; Adult (55+) park; Park includes a heated indoor salt-water pool and fitness room; Back door railing at carport; Exterior color: blue
- Construction: Built in 1979; Aluminum siding with lap style; Pier foundation; Metal or aluminum roof
- Exterior features: Partially fenced yard; Covered deck or covered patio; Landscaped yard; Shed (outbuilding); RV/Camper pad area
Interior
- Kitchen: Dishwasher; Electric range (installed 2021); Refrigerator/freezer (installed 2021)
- Bedrooms: Master bedroom on main level; Second bedroom on main level
- Flooring: Carpet; Vinyl; Tile
- Bathrooms: One bathroom on main level
- Heating & cooling: Electric heating; Forced air; Central air conditioning
- Interior features: High-speed communication available; Pantry in kitchen; Disposal
- Laundry & utility: Washer and dryer included; Utility room on main level; Newer electric water heater
Neighborhood map
What this means for you Summary
Snapshot
- This is a 2-bed/1.0-bath manufactured listed at $40k.
Deal economics
- At list price, monthly cash flow is $930 ($11k/yr) — positive.
- The deal already cash-flows at list — no discount required.
- Meets the 1% rule at list price ($2k rent vs $40k).
- Recommended offer: $39k (3.0% below list) — sets the bar for market timing.
- Cap rate 34.2% vs local median 2.9% in Salem — top-decile yield for the area; either an underpriced asset or a hidden risk that comps aren't pricing in. Stress-test before assuming the spread holds.
Location & tenants
- Location reads 79/100 on livability (#59 in OR, #2,084 nationally) — a middle-class / working-renter tenant base. Strengths: amenities A+, commute A+, housing A+; Watch: schools D, crime F.
- Salem-Keizer SD 24J (urban): math 34% / reading 47% proficiency, ranked #103 of 183 in OR (top 56%) — families likely to look elsewhere, expect single-tenant / working-renter base with shorter leases.
- Market conditions: Rents rising (+2.6%/yr); 133 active listings in the ZIP; 24 comparable units currently listed for rent nearby; rentals at typical pace (median 23d on market — plan ~3-4 weeks tenant-placement turnaround); solid renter incomes; 1,591 units permitted in Marion County in 2024 (716 in 5+ unit buildings).
Forward outlook
- Local home prices are declining (-3.0%/yr); year-one equity from $277 of loan paydown is wiped out by about $1k of value loss. Plan a longer hold.
- Marion County population projected at +17% by 2050 — long-run rental-demand tailwind backs the buy-and-hold thesis.
- At projected returns (-3.0% appreciation + 2.6% rent growth), your $11k cash investment doubles in ~2 years — after that, you're playing with house money.
Negotiation context
- It's been on market 45 days — a 3% lower offer ($39k) is reasonable based on typical stale-listing flexibility.
- 2 sale attempts with the ask held roughly flat each time — persistent listings suggest the price (not the market) is what's stuck; bring a comps-based counter.
- Current owner paid $20k; list at $40k implies a 100% gain — meaningful room to come down on a strong offer.
Questions for the listing agent
- It's been on market 45 days. Have you received any prior offers? Is the seller open to a 3% concession, seller financing, or rate buy-down credit?
- Built in 1979 — when were the roof, HVAC, electrical panel, plumbing, and water heater last replaced?
- Is there a deadline driving the sale (1031 exchange, divorce, estate, relocation)? That informs how much negotiation room exists.
- Schools are D-rated, which usually means shorter tenancies and higher turnover. Who's the typical renter profile here, and what's been the actual vacancy rate?
- Crime grade is F in this area — have there been break-ins, vandalism, or insurance claims at this property in the last 3 years? What carrier currently insures it and at what premium?
- What's the average days-on-market for RENTAL listings here right now (not sales)? A rising rental-DOM trend means longer vacancies and softer asking-rent achievability than the comps imply.
- What's the recent tenant-quality profile in this submarket — average credit score on applications, eviction rate, late-payment / NSF rate, and stable-employment percentage? A property-management company in the area should have these aggregated.
- How much new for-sale + rental construction is in the pipeline within 1–3 miles? Heavy new supply typically softens prices + rents 12–24 months out; constrained supply supports both.
Investment metrics
- 1% rule
- 3.77% ✓
- Cap rate
- 34.21%
- Cash-on-cash
- 99.70%
- DSCR
- 5.44
- GRM
- 2.2
CMA / ARV
- ARV (median comp)
- $15,540
- List price
- $40,000
- Delta
- 157.41%
- Verdict
- OVERPRICED
- Comps
- 8 within 1.0 mi
Show comp detail 12 sales within ~0.75 mi
| Address | Dist | Beds/Ba | Sqft | Sold | Price | $/sf | Match |
|---|---|---|---|---|---|---|---|
| 2232 42nd Ave SE #204 | 0.00mi | 2/1.0 | 945 (+1%) | 11mo | $70,000 | $74 | 89 |
| 2232 42nd Ave SE #322 | 0.00mi | 2/2.0 | 938 (0%) | 13mo | $45,000 | $48 | 85 |
| 2232 42nd Ave #610 | 0.00mi | 2/2.0 | 924 (-2%) | 12mo | $45,000 | $49 | 84 |
| 2200 Lancaster Dr SE Unit 1D | 0.24mi | 2/2.0 | 960 (+2%) | 2mo | $20,000 | $21 | 79 |
| 2232 42nd Ave SE #781 | 0.00mi | 2/2.0 | 871 (-7%) | 11mo | $13,000 | $15 | 75 |
| 2232 42nd Ave SE #111 | 0.00mi | 2/1.0 | 840 (-10%) | 11mo | $10,000 | $12 | 73 |
| 2232 42nd Ave SE #819 | 0.00mi | 2/2.0 | 1,026 (+9%) | 15mo | $76,000 | $74 | 68 |
| 4347 Essex St SE | 0.28mi | 2/2.0 | 960 (+2%) | 14mo | $38,000 | $40 | 67 |
| 2200 SE Lancaster Dr Unit 23A | 0.25mi | 2/1.0 | 828 (-12%) | 3mo | $7,000 | $8 | 67 |
| 4413 Essex St | 0.24mi | 2/1.0 | 840 (-10%) | 13mo | $55,000 | $65 | 60 |
| 2200 SE Lancaster Dr Unit 13D | 0.24mi | 2/2.0 | 1,056 (+13%) | 13mo | $135,000 | $128 | 53 |
| 2200 SE Lancaster Dr | 0.25mi | 2/2.0 | 1,056 (+13%) | 13mo | $135,000 | $128 | 53 |
Match score weights: distance 35% · size 25% · config 20% · recency 20%. Top-matched comps best support the ARV.
Projected returns pro-forma
-3.0% appreciation · 2.62% rent growth · sell at horizon
- IRR
- —
- Equity multiple
- 5.66×
- Total profit
- $52,220
- Equity at exit
- $5,964
- IRR
- —
- Equity multiple
- 11.67×
- Total profit
- $119,498
- Equity at exit
- $3,458
Cash invested: $11,200 (down + closing). Projections, not guarantees.
Landlord ↔ Tenant lean methodology
- Overall (STATE)
- 28 Tenant-Leaning
- State Oregon
- 28 Tenant-Leaning · D+6
- County
- — inherits STATE
- City
- — inherits STATE
ZIP-level market 97317
- Rents YoY
- 2.6%
- Active inventory
- 133
- Price-to-rent
- 2.2×
Monthly cashflow live
- Estimated rent
- $1,506 high interval (Pro) →
- Mortgage (P&I)
- −$210
- Tax from tax record
- −$33 /mo · $397/yr
- Insurance
- −$17
- HOA
- −$0
- Vacancy / Maint / Mgmt
- −$316
- Net cashflow
- $930
Break-even live
UW: 25.0% down · 7.5% · 30yr · 1.5% tax · 5.0% vac · 8.0% maint · 8.0% mgmt
Financing live
Cash to close
- Down payment
- $10,000
- Closing costs
- $1,200
- Reserves months
- —
- Total cash needed
- —
Loan-product check · same deal, 3 products live
Conventional
25% down · 7.5% · 30yr
- Down + closing
- —
- Monthly P&I
- —
- Monthly cashflow
- —
- DSCR
- —
- Eligible?
- —
Personal DTI + credit; lowest rate.
DSCR
20% down · 8.5% · 30yr
- Down + closing
- —
- Monthly P&I
- —
- Monthly cashflow
- —
- DSCR
- —
- Eligible?
- —
No personal income docs; deal must DSCR.
Hard money
10% down · 12.0% · 12mo
- Down + closing
- —
- Monthly P&I
- —
- Monthly cashflow
- —
- DSCR
- —
- Eligible?
- —
Short-term bridge; refi at stabilization.
Rent comps 24 comps
| Address | Beds | Baths | Sqft | Rent | $/sqft | DOM | Units | Dist |
|---|---|---|---|---|---|---|---|---|
| 4435 Campbell Dr SE Salem, OR | 2.0 | 1.0 | 807 | $1,445 | $1.79 | 23d | 1 | 0.15mi |
| 4243 Campbell Dr SE Unit 4243 Salem, OR | 3.0 | 1.0 | 936 | $1,550 | $1.66 | 13d | 1 | 0.17mi |
| 2728 Lancaster Dr SE Unit 2728-14 Salem, OR | 2.0 | 1.5 | 1000 | $1,195 | $1.20 | 43d | 1 | 0.32mi |
| 4665 Campbell Dr SE Salem, OR | 1.0–3.0 | 1.0–2.0 | 923 | $1,699 | $1.84 | 13d | 1 | 0.35mi |
| 1569 Whitaker Dr SE Salem, OR | 1.0–3.0 | 1.0–2.0 | 933 | $1,799 | $1.93 | 13d | 1 | 0.65mi |
| 1029 Raffon Ct SE Unit AR7171-3 Salem, OR | 2.0 | 1.5 | 927 | $1,700 | $1.83 | 23d | 1 | 0.65mi |
| 4976 Turquoise Ave SE Salem, OR | 2.0 | 2.0 | 918 | $1,495 | $1.63 | 13d | 5 | 0.71mi |
| 4807 Chinook Ct SE Salem, OR | 3.0 | 1.5 | 1104 | $2,200 | $1.99 | 13d | 1 | 0.89mi |
| 5192 Caplinger Rd SE Salem, OR | 1.0–3.0 | 1.0–2.0 | 927 | $1,554 | $1.67 | 13d | 25 | 1.01mi |
| 3897 Meadowlawn Loop SE Salem, OR | 1.0–3.0 | 1.0–2.0 | 962 | $1,619 | $1.68 | 13d | 26 | 1.14mi |
| 3828 Bayonne Dr SE Salem, OR | 2.0 | 1.0 | 980 | $1,299 | $1.33 | 13d | 1 | 1.17mi |
| 3822 Bayonne Dr SE Salem, OR | 2.0 | 1.0 | 980 | $1,299 | $1.33 | 23d | 1 | 1.17mi |
| 4433 Mahrt Ave SE Unit 4435-201 Salem, OR | 2.0 | 2.0 | 888 | $1,525 | $1.72 | 23d | 1 | 1.27mi |
| 4433 Mahrt Ave SE Unit 4437-206 Salem, OR | 2.0 | 2.0 | 932 | $1,525 | $1.64 | 43d | 1 | 1.27mi |
| 4433 Mahrt Ave SE Unit 4433-205 Salem, OR | 1.0 | 1.0 | 688 | $1,225 | $1.78 | 43d | 1 | 1.27mi |
| 143 Connecticut Ave SE Unit 143 Salem, OR | 1.0 | 1.0 | 705 | $950 | $1.35 | 13d | 1 | 1.35mi |
| 4242 State St Salem, OR | 1.0 | 1.0 | 684 | $1,325 | $1.94 | 23d | 1 | 1.38mi |
| 4611 State St Unit 4611 Salem, OR | 2.0 | 1.0 | 840 | $1,450 | $1.73 | 23d | 1 | 1.40mi |
| 4166 State St Salem, OR | 2.0 | 1.0 | 788 | $1,350 | $1.71 | 13d | 1 | 1.41mi |
| 178 Lancaster Dr SE Salem, OR | 2.0 | 2.0 | 952 | $1,495 | $1.57 | 13d | 1 | 1.42mi |
| 124 Stafford Ln NE Unit 124-203 Salem, OR | 3.0 | 2.0 | 1052 | $1,595 | $1.52 | 43d | 1 | 1.43mi |
| 138 Bayview Way NE Salem, OR | 2.0 | 1.0 | 850 | $1,395 | $1.64 | 13d | 3 | 1.44mi |
| 133 Stafford Ln NE Unit 133-103 Salem, OR | 2.0 | 1.0 | 827 | $1,195 | $1.44 | 43d | 1 | 1.46mi |
| 4135 State St Unit 11 Salem, OR | 2.0 | 1.0 | 820 | $1,195 | $1.46 | 43d | 1 | 1.48mi |
Listing history 19 events
-
2026-06-18days on market $40,000 Active 45 DOM
-
2026-06-17days on market $40,000 Active 44 DOM
-
2026-06-16days on market $40,000 Active 43 DOM
-
2026-06-15days on market $40,000 Active 42 DOM
-
2026-06-14days on market $40,000 Active 40 DOM
-
2026-06-10days on market $40,000 Active 37 DOM
-
2026-06-09days on market $40,000 Active 36 DOM
-
2026-06-08days on market $40,000 Active 35 DOM
-
2026-06-07days on market $40,000 Active 34 DOM
-
2026-06-03days on market $40,000 Active 30 DOM
-
2026-06-02days on market $40,000 Active 29 DOM
-
2026-06-01days on market $40,000 Active 28 DOM
-
2026-05-31days on market $40,000 Active 27 DOM
-
2026-05-30days on market $40,000 Active 26 DOM
-
2026-05-04$40,000 Active 526-char remark
-
2026-02-20historical
-
2025-12-03price $47,000
-
2025-11-03$50,000 Active
-
1983-06-24soldstatus $20,000
ⓘ Source: listings_history table (triggers on properties + properties_extension) + one-shot
backfill from property_details.listing_events for pre-trigger history.
Tax reassessment forecast OR · Resets to sale price
- Current annual tax
- $397 · $33/mo
- Projected year-2 tax
- $397 · $33/mo
- Expected delta
- $0/yr ($0/mo · 0.0%)
ⓘ Screening estimate from a state-policy table — verify with the county assessor before closing.
Climate risk First Street
- Flood 1/10 Low FEMA zone X · 0% chance over 30 yrs
- Wildfire 1/10 Low
- Heat 4/10 Moderate
Nearby sold comps map
Loading sold comps map…
Walkable amenities ~0.75 mi
Loading nearby amenities…
Taxation est. · year 1
- Rental income
- $18,077
- − Mortgage interest
- −$2,241
- − Property taxes
- −$397
- − Insurance
- −$200
- − Repairs & maintenance
- −$1,446
- − Management
- −$1,446
- − Depreciation
- −$1,164
- Taxable income
- $11,183
- Est. tax owed @ 24.0%
- −$2,684
- After-tax cash flow
- $8,482/yr
For passive investors: Depreciation is non-cash, so a rental often shows a tax loss while cash-flowing — sheltering income. Rental losses are passive: they offset passive income freely, and up to $25,000/yr can offset ordinary (W-2) income if you actively participate and your MAGI is under $100k (phasing out to $0 by $150k); unused losses carry forward. On sale, claimed depreciation is recaptured at up to 25%, and gains may owe capital-gains tax (a 1031 exchange can defer both). Figures are a year-1 estimate at your 24.0% rate — not tax advice; consult a CPA.
Schools (NCES district)
- District
- Salem-Keizer SD 24J
- NCES district ID
- 4110820
- Math proficiency
- 34% ▼ -1.00%
- Reading proficiency
- 47% ▼ -2.00%
- Median HH income
- $48,632
- Composite
- 37.16/100
- National rank
- #9017
- State rank
- #103 of 183 in OR
Livability — Salem
- Score
- 79/100
- State rank
- #59
- US rank
- #2084
Category grades
Schools grade is shown separately in the Schools card above.
Census & demographics
- Census place
- Salem, OR
- County
- Marion County · 258,219 people
- City population
- 193,601
- Metro
- Salem, OR
- Population (ZIP)
- 25,966
- Household income
- $84,393
- Rent vs Own
- Severe rent burden
- 395.0
Population outlook (Marion County) Hauer SSP2
- Today (2025)
- 360,940 people
- By 2030
- 375,178 · +3.9%
- By 2040
- 400,914 · +11.1%
- By 2050
- 422,187 · +17.0%
- By 2075
- 460,305 · +27.5%
- By 2100
- 464,025 · +28.6%
Race, ethnicity, and origin ACS 2023
- Neighborhood character
- Majority White (61%)
- Race & ethnicity
- White 61% Hispanic / Latino 28% Two or more races 17% Asian 2% Pacific Islander 2%
- Hispanic origin (detail)
- Mexican 26%
- Common ancestry
- Portuguese 4% Italian 2% Lithuanian 2%
- Foreign-born
- 11% · Canada, Vietnam
- Languages at home
- 74% English-only · Spanish 22% Russian/Polish/Slavic 2% German/W. Germanic 1%
Political lean MEDSL · Marion
- 2024 margin
- Toss-up / Even · D 47.5% · R 49.5% · Other 3.0%
- 2008→2024 swing
- -4.2pp toward R · 2008: 2.2pp · 2024: -2.0pp
- All cycles
- 2024: R+2.0 2020: D+1.1 2016: R+5.0 2012: R+3.5 2008: D+2.2
Not yet ingested
- Civics
- —
Market trends
- HPI YoY
- ▼ -471.73%
- Current HPI
- 307.3264
- Rent YoY
- ▲ 2.62%
- Metro
- Salem, OR
- State GDP YoY
- ▲ 2.05%
- F500 in state
- 2
Industry mix (Fortune 500 HQ in OR)
| Industry | F500 HQs | Revenue |
|---|---|---|
| Consumer Goods | 1 | $51B |
|
||
Price history
+100.0% since first listed5 events — show timeline
- 2026-05-04 Listed $40,000 WVMLS
- 2026-02-20 Listing Removed — WVMLS
- 2025-12-03 Price Changed $47,000 WVMLS
- 2025-11-03 Listed $50,000 WVMLS
- 1983-06-24 Sold (Public Records) $20,000 Public Records
Property tax history
+6.5%/yrLatest (2022): $397 · +2.9% YoY. Source: county tax records.
Cash-flow waterfall
monthlySold comps — $/sqft
last 12 mo · ≤1 miLoading sold comps…