2396 County Road 2050 · Hull, TX
Flood risk 1/10 · Minimal
- FEMA flood zone
- X (unshaded)
- Chance of flooding over 30 yrs
- 0.0%
- Est. flood insurance / yr
- $507 – $1,088
Fire risk 4/10 · Minor
- Est. fire insurance / yr
- $1,222 – $2,270
Heat risk 8/10 · Major
- Hot days now (above 112°F)
- 7 days/yr
- Hot days in 30 yrs
- 22 days/yr
Wind risk 8/10 · Major
- Chance of severe wind over 30 yrs
- 99.0%
Air-quality risk 2/10 · Minimal
- Unhealthy air days now
- 0 days/yr
- Unhealthy air days in 30 yrs
- 1 days/yr
Risk factors via First Street. Map © Google.
Why this score? — see what drove the C+ grade
The composite is a weighted blend of 9 inputs, each scored 0–100. Each bar is that input's sub-score; the figure is the points it added to the 100-point composite (weight × sub-score).
- Cash flow +25.7/30.0
- DSCR +8.6/10.0
- 1% rule +7.5/10.0
- ARV discount +7.5/15.0
- Appreciation +5.0/10.0
- Schools +3.6/10.0
- Rent growth +2.5/5.0
- Condition / age +2.5/5.0
- Livability +2.1/5.0
$110,000
🖨 Deal sheet 📄 Offer letter ✓ Due diligence
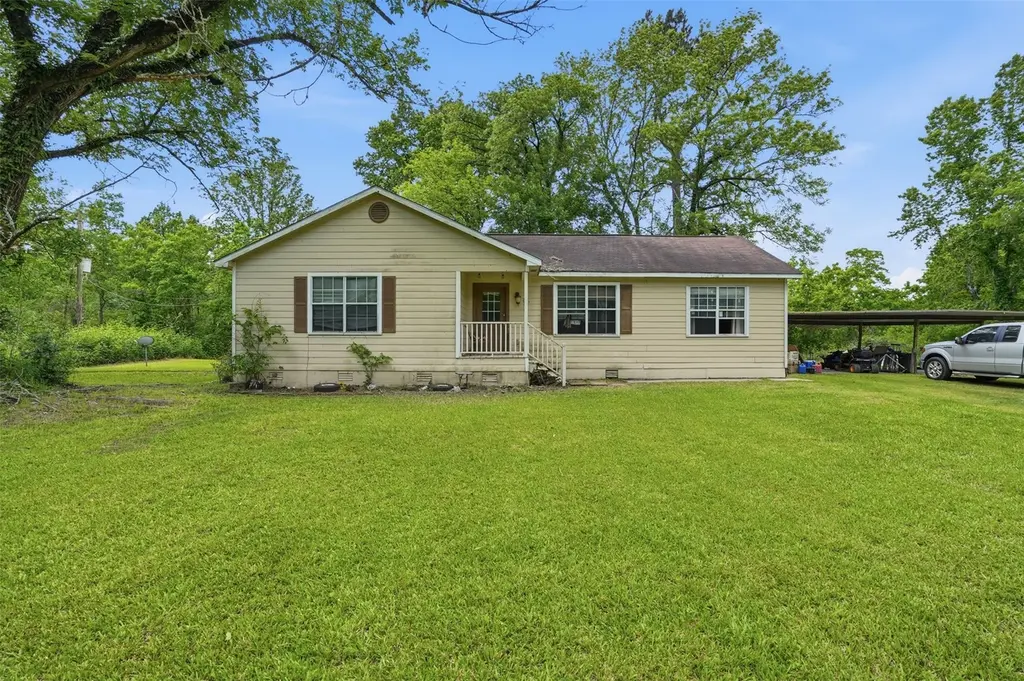
Listing remarks
Escape to the country with this charming single-story ranch home, perfectly situated on a sprawling, cleared lot in the quiet community of Hull, TX. Offering the privacy and peace of rural living, this property features a functional open layout designed for easy maintenance and comfort. The exterior boasts classic horizontal siding, a durable composition roof, and a pier and beam foundation. A welcoming front porch with white railing leads you inside, while the expansive lawn provides plenty of room for gardening, recreation, or future expansions. The property also includes a convenient oversized carport, offering ample space for vehicle storage and outdoor projects. Surrounded by a lush tr
Key facts
- 0.82 acre lot
- Garage
- Built 2006
Tags
Property features AI
Finance
- Other: Seller disclosure available
- Financial info: Lease not considered
Exterior
- Parking: Detached garage (1 parking space)
- Utilities: Public water; Public sewer
- Home design: Residential property; Built in 2006; Entry on first floor
- Construction: Vinyl siding; Composition roof; Pillar/post/pier foundation
- Exterior features: Cleared lot
Interior
- Bedrooms: Primary bedroom on the first floor; Additional bedrooms on the first floor
- Bathrooms: Three full bathrooms (all on the first floor); Primary bathroom on the first floor
- Heating & cooling: Central heating (electric and gas); Central air conditioning (electric and gas)
- Interior features: Six total rooms
Neighborhood map
What this means for you Summary
Snapshot
- This is a 3-bed/2.0-bath single-family listed at $110k.
Deal economics
- At list price, monthly cash flow is $264 ($3k/yr) — positive.
- The deal already cash-flows at list — no discount required.
- Meets the 1% rule at list price ($1k rent vs $110k).
- Recommended offer: $108k (1.5% below list) — sets the bar for market timing.
Location & tenants
- Location reads 41/100 on livability (#1,599 in TX) — a working-class tenant base; expect higher turnover. Strengths: cost of living A+, crime A; Watch: amenities F, commute F, employment F.
- Hardin ISD (rural): math 39% / reading 44% proficiency, ranked #354 of 826 in TX (top 43%) — families likely to look elsewhere, expect single-tenant / working-renter base with shorter leases.
- Zoned schools: Hardin H S (math 67% / reading 57%, grade B-, #237 of 1,632 statewide, top 16%, 394 students, 57% FRL) — zoned schools at 57% FRL track the district average.
- Zoned-school proficiency averages 62% at this address vs 42% district-wide (+20 pts) — the actual schools serving this property are materially stronger than the Hardin ISD average implies; a family-tenant draw the district grade alone would hide.
- Market conditions: 41 active listings in the ZIP; 1,321 units permitted in Liberty County in 2024 (0 in 5+ unit buildings).
Forward outlook
- In year one you build about $4k of equity ($761 loan paydown + $3k appreciation (3.0% local appreciation)).
- Liberty County population projected at +24% by 2050 — long-run rental-demand tailwind backs the buy-and-hold thesis.
- At projected returns (3.0% appreciation + 3.0% rent growth), your $31k cash investment doubles in ~4 years — after that, you're playing with house money.
- By year 8, paydown + projected appreciation supports a ~$30k cash-out refi (75% LTV) — recoverable capital for the next deal without selling this one.
Negotiation context
- It's been on market 26 days — a 2% lower offer ($108k) is reasonable based on typical stale-listing flexibility.
- 4 sale attempts; this cycle's ask has dropped $10k (8%) from the opening price — seller is motivated, your offer sets the floor, not the list.
Risks & watch-outs
- Climate carrying-cost: severe wind risk, 99% chance of damaging wind over 30y; extreme-heat days projected 7→22/yr by 2055 (HVAC capex compounding) — expect insurance premiums to compound above CPI over the hold.
Questions for the listing agent
- Is there a deadline driving the sale (1031 exchange, divorce, estate, relocation)? That informs how much negotiation room exists.
- Schools are F-rated, which usually means shorter tenancies and higher turnover. Who's the typical renter profile here, and what's been the actual vacancy rate?
- What's the average days-on-market for RENTAL listings here right now (not sales)? A rising rental-DOM trend means longer vacancies and softer asking-rent achievability than the comps imply.
- What's the recent tenant-quality profile in this submarket — average credit score on applications, eviction rate, late-payment / NSF rate, and stable-employment percentage? A property-management company in the area should have these aggregated.
- How much new for-sale + rental construction is in the pipeline within 1–3 miles? Heavy new supply typically softens prices + rents 12–24 months out; constrained supply supports both.
Investment metrics
- 1% rule
- 1.25% ✓
- Cap rate
- 9.17%
- Cash-on-cash
- 10.29%
- DSCR
- 1.46
- GRM
- 6.7
CMA / ARV
- ARV (median comp)
- $246,723
- List price
- $110,000
- Delta
- -55.42%
- Verdict
- UNDERPRICED
- Comps
- 2 within 1.0 mi
Show comp detail 1 sale within ~0.75 mi
| Address | Dist | Beds/Ba | Sqft | Sold | Price | $/sf | Match |
|---|---|---|---|---|---|---|---|
| 1938 County Road 2050 | 0.43mi | 3/2.0 | 1,192 (-13%) | 22mo | $199,000 | $167 | 40 |
Match score weights: distance 35% · size 25% · config 20% · recency 20%. Top-matched comps best support the ARV.
Projected returns pro-forma
3.0% appreciation · 3.0% rent growth · sell at horizon
- IRR
- 17.2%
- Equity multiple
- 1.98×
- Total profit
- $30,130
- Equity at exit
- $49,461
- IRR
- 18.7%
- Equity multiple
- 3.72×
- Total profit
- $83,783
- Equity at exit
- $76,225
Cash invested: $30,800 (down + closing). Projections, not guarantees.
Landlord ↔ Tenant lean methodology
- Overall (STATE)
- 87 Strongly Landlord-Friendly
- State Texas
- 87 Strongly Landlord-Friendly · R+5
- County
- — inherits STATE
- City
- — inherits STATE
ZIP-level market 77564
- Active inventory
- 41
- Price-to-rent
- 6.7×
Monthly cashflow live
- Estimated rent
- $1,374 medium interval (Pro) →
- Mortgage (P&I)
- −$577
- Tax from tax record
- −$199 /mo · $2,382/yr
- Insurance
- −$46
- HOA
- −$0
- Vacancy / Maint / Mgmt
- −$289
- Net cashflow
- $264
Break-even live
UW: 25.0% down · 7.5% · 30yr · 1.5% tax · 5.0% vac · 8.0% maint · 8.0% mgmt
Financing live
Cash to close
- Down payment
- $27,500
- Closing costs
- $3,300
- Reserves months
- —
- Total cash needed
- —
Loan-product check · same deal, 3 products live
Conventional
25% down · 7.5% · 30yr
- Down + closing
- —
- Monthly P&I
- —
- Monthly cashflow
- —
- DSCR
- —
- Eligible?
- —
Personal DTI + credit; lowest rate.
DSCR
20% down · 8.5% · 30yr
- Down + closing
- —
- Monthly P&I
- —
- Monthly cashflow
- —
- DSCR
- —
- Eligible?
- —
No personal income docs; deal must DSCR.
Hard money
10% down · 12.0% · 12mo
- Down + closing
- —
- Monthly P&I
- —
- Monthly cashflow
- —
- DSCR
- —
- Eligible?
- —
Short-term bridge; refi at stabilization.
Listing history 11 events
-
2026-05-12price $110,000 994-char remark
-
2026-05-08status Active 994-char remark
-
2026-05-02status Pending 994-char remark
-
2026-04-24$120,000 Active 994-char remark
-
2025-12-31historical
-
2025-05-09status Active
-
2025-05-06status Option Pending
-
2025-02-03price $184,990
-
2025-01-17$190,000 Active
-
2025-01-05historical
-
1985-10-25soldstatus
ⓘ Source: listings_history table (triggers on properties + properties_extension) + one-shot
backfill from property_details.listing_events for pre-trigger history.
Tax reassessment forecast TX · Resets to sale price
- Current annual tax
- $2,382 · $199/mo
- Projected year-2 tax
- $2,382 · $199/mo
- Expected delta
- $0/yr ($0/mo · 0.0%)
ⓘ Screening estimate from a state-policy table — verify with the county assessor before closing.
Climate risk First Street
- Flood 1/10 Low FEMA zone X (unshaded) · 0% chance over 30 yrs
- Wildfire 4/10 Moderate
- Heat 8/10 Severe 7 d/yr ≥112°F today · 22 d/yr by 30 yrs out
- Wind 8/10 Severe 99% chance of damaging wind over 30 yrs
- Air quality 2/10 Low 0 unhealthy d/yr today · 1 by 30 yrs out
Nearby sold comps map
Loading sold comps map…
Walkable amenities ~0.75 mi
Loading nearby amenities…
Taxation est. · year 1
- Rental income
- $16,486
- − Mortgage interest
- −$6,162
- − Property taxes
- −$2,382
- − Insurance
- −$550
- − Repairs & maintenance
- −$1,319
- − Management
- −$1,319
- − Depreciation
- −$3,200
- Taxable income
- $1,554
- Est. tax owed @ 24.0%
- −$373
- After-tax cash flow
- $2,796/yr
For passive investors: Depreciation is non-cash, so a rental often shows a tax loss while cash-flowing — sheltering income. Rental losses are passive: they offset passive income freely, and up to $25,000/yr can offset ordinary (W-2) income if you actively participate and your MAGI is under $100k (phasing out to $0 by $150k); unused losses carry forward. On sale, claimed depreciation is recaptured at up to 25%, and gains may owe capital-gains tax (a 1031 exchange can defer both). Figures are a year-1 estimate at your 24.0% rate — not tax advice; consult a CPA.
Schools (NCES district)
- District
- Hardin ISD
- NCES district ID
- 4822380
- Math proficiency
- 39% ▲ 1.00%
- Reading proficiency
- 44% ▲ 6.00%
- Median HH income
- $48,099
- Composite
- 35.54/100
- National rank
- #4907
- State rank
- #354 of 826 in TX
Livability — Hull
- Score
- 41/100
- State rank
- #1599
- US rank
- #27213
Category grades
Schools grade is shown separately in the Schools card above.
Census & demographics
- Population (ZIP)
- 1,876
Population outlook (Liberty County) Hauer SSP2
- Today (2025)
- 87,956 people
- By 2030
- 92,161 · +4.8%
- By 2040
- 100,784 · +14.6%
- By 2050
- 109,471 · +24.5%
- By 2075
- 133,470 · +51.7%
- By 2100
- 147,372 · +67.6%
Race, ethnicity, and origin ACS 2023
- Neighborhood character
- Predominantly White (84%)
- Race & ethnicity
- White 84% Hispanic / Latino 13% Two or more races 3%
- Hispanic origin (detail)
- Mexican 12%
- Common ancestry
- Lithuanian 12% Iranian 3% Slovak 3%
- Foreign-born
- 1% · Canada, China
- Languages at home
- 93% English-only · Spanish 6%
Political lean MEDSL · Liberty
- 2024 margin
- Solid R (+61.6) · D 19.0% · R 80.6%
- 2008→2024 swing
- -17.9pp toward R · 2008: -43.7pp · 2024: -61.6pp
- All cycles
- 2024: R+61.6 2020: R+59.7 2016: R+58.0 2012: R+53.3 2008: R+43.7
Not yet ingested
- Civics
- —
Market trends
- HPI YoY
- —
- Current HPI
- —
- Rent YoY
- —
- Metro
- —
- State GDP YoY
- ▲ 3.95%
- F500 in state
- 110
Industry mix (Fortune 500 HQ in TX)
| Industry | F500 HQs | Revenue |
|---|---|---|
| Energy | 16 | $1,198B |
|
||
| Technology | 5 | $198B |
|
||
| Engineering / Construction | 4 | $72B |
|
||
| Energy Services | 3 | $60B |
|
||
| Utilities | 3 | $41B |
|
||
| Healthcare | 2 | $330B |
|
||
Price history
-42.1% since first listed12 events — show timeline
- 2026-05-27 Pending — HARMLS
- 2026-05-12 Price Changed $110,000 HARMLS
- 2026-05-08 Relisted — HARMLS
- 2026-05-02 Pending — HARMLS
- 2026-04-24 Listed $120,000 HARMLS
- 2025-12-31 Listing Removed — HARMLS
- 2025-05-09 Relisted — HARMLS
- 2025-05-06 Pending — HARMLS
- 2025-02-03 Price Changed $184,990 HARMLS
- 2025-01-17 Listed $190,000 HARMLS
- 2025-01-05 Coming Soon — HARMLS
- 1985-10-25 Sold (Public Records) — Public Records
Property tax history
+5.7%/yrLatest (2025): $2,382 · +7.2% YoY. Source: county tax records.
Cash-flow waterfall
monthlySold comps — $/sqft
last 12 mo · ≤1 miLoading sold comps…